

Abstract
Parametric imaging with a linear regression function of the tracer activity curve fit is a non-compartmental method, which can be used for the evaluation of dynamic PET (dPET) studies. However, the dependency of the slope of the regression function fit on the 18F-Deoxyglucose (FDG) 2-tissue compartment parameters (vb, k1-k4) is not known yet. This study is focused on the impact of the 2-tissue compartment parameters on the slope of the curve. A data base of 1760 dynamic PET FDG studies with the corresponding 2-tissue compartment model parameter solutions were available and used to calculate synthetic time-activity data based on the 2-tissue compartment model. The input curve was calculated from the median values of the input curves of the 1760 dynamic data sets. Then, sequentially each of the five parameters (vb, k1-k4) of the 2-tissue compartment model was varied from 0.1 to 0.9 and tracer activity curves were calculated (60000 curves/parameter). A linear regression function was fitted to these curves. The comparison of the slope values of the regression function with the corresponding compartment data revealed a primary dependency on k3, which is associated with the intracellular phosphorylation of FDG. The squared correlation coefficient was high with r2=0.9716, which refers to 97 % explained variance of the data. k2 and vb had only a minor impact, while k1 and k4 had no impact on the slope values. The results demonstrate, that k3 has a major impact on the slope values calculated by the linear regression function.
Keywords: FDG, non-compartment model, parametric imaging
Introduction
Dynamic PET (dPET) and PET-CT (dPET-CT) with 18F-Deoxyglucose (FDG) had found limited use for scientific studies of patients, in particular for therapy management in oncological patients [1-3]. Doot et al. performed dPET examinations with 18F-fluoride in patients with bone metastases from breast cancer and showed, that the fluoride transport and flux can be accurately measured for metastases [2]. The quantitative analysis of a dPET study is usually performed using Volumes-of-Interest (VOIs) and compartment and/or non-compartment models. Additionally the calculation of parametric images can be helpful for the assessment of malignant lesions due to the enhanced image contrast [3]. One problem is to extract features from the tracer time-activity curve within a short time. Therefore, fast algorithms are favorable for routine use of dynamic PET-CT and parametric imaging.
Zhou et al. proposed a multi-graphical approach for the analysis of dynamic PET studies [4]. Fourier analysis of dPET data was used for PET examinations with 11C-ethanol in patients treated with percutaneous ethanol and tracer injection into the tumor [5]. The Fourier images were found to be useful to assess the dilution and redistribution of ethanol within the tumor. There are several problems associated with dPET studies. One problem is the time needed for the acquisition of a dynamic series. This can be solved by using a shortened acquisition protocol [6]. Another aspect is the selection of an appropriate model for the calculation of the parametric images. Messa et al. applied the Patlak analysis to the dynamic PET data and visualized the metabolism in liver metastases [7]. However, the Patlak analysis requires an input function for the calculations.
One model for fast parametric imaging is the calculation of a linear regression function, fitted to the time dependent FDG concentrations of the dPET data on a voxel base. This model had found use for dynamic PET studies [5,8,9]. Two parametric images are obtained: the slope and the intercept of the regression function. It is usually assumed, that the slope is associated with the trapped FDG. If this hypothesis is valid, the slope should be correlated with the k3 values of the 2-tissue compartment model. Aim of this study was to assess the impact of the parameters of the 2-tissue compartment model on the slope values of the linear regression fit.
Material and methods
Data sources
Generally, twenty-eight frames are acquired for each dPET or dPET-CT FDG study in oncological patients, using the following time intervals: 10 frames of 30 s, 5 frames of 60 sec, 5 frames of 120 s, and 8 frames of 300 s. The dynamic data are evaluated using a VOI technique and a 2-tissue compartment fit to obtain the parameters of this model for dedicated lesions. The 2-tissue compartment model provides five parameters: vb, the fractional blood volume, also referred to as vessel density, k1 and k2, the parameters of the transport of FDG into and out of the tissue, k3 and k4, the parameters for the phosphorylation and dephosphorylation of the intracellular FDG. Furthermore, the results from the VOI based analysis of these dPET studies were used to create a data base of input and target time activity curves, associated with the corresponding results of the 2-tissue compartment fit data. The data in the data base do not include any patient information, only input, target, and compartment data (vb, k1-k4) were available for this study. The dimension of the time activity data is the standardized uptake value (SUV). The SUV was calculated on the basis of the following formula [10]: SUV = tissue concentration [Bq/g]/(injected dose [Bq]/body weight [g]). For this study we were using 1760 dPET FDG time-activity data and corresponding compartment results (vb, k1-k4) from 634 PET examinations.
Model for parametric imaging
The model used for the fast generation of parametric images is based on a fit of a linear regression function (y=a*x+b) to the time (x) and activity (y) data of each voxel using all 28 frames of the dynamic series. The slope of the curve (a) and the intercept (b) are used to generate parametric images. The slope (a) is dependent on the change of the tracer activity curve over time, e.g. increasing with time or decreasing. The variable b is cutoff of the function with the y-axis for x=0. Usually it is assumed that the slope (a) is associated with the metabolism of FDG, while the variable b reflects the distribution volume of the tracer.
Synthetic data: input data (blood curve)
In order to assess the dependency of the slope on the 2-tissue compartment model parameters, synthetic time activity data were generated. Synthetic studies provide the advantage, that we can assess the effect of only one of the five 2-tissue compartment parameters on the slope values while keeping the other parameters of the model constant. This is not possible with patient studies, which provide numerous combinations of different compartment parameter settings.
The synthetic time-activity data were generated based on a set of parameters for the 2-tissue compartment model. First, an input curve is required, which reflect the blood concentrations of FDG, in order to calculate the time-activity data. The input curve was obtained by calculating the median values for each of the 28 time frames of the 1760 input curves of the data base. Thus an input curve was created using these median values for all 28 frames.
Synthetic data: time-activity data
Now, synthetic time-activity curves can be calculated using this input curve. For this purpose one compartment parameter of the 2-tissue compartment model was variable, while the other four compartment parameters were kept constant. In order to get values for the compartment parameter which was held constant, we used the same procedure like for the generation of the input curve. Thus, e.g. for vb we calculated the median from the 1760 vb values of the data base. The same was done for the other parameters k1-k4.
Now the time-activity data could be calculated. For example, vb of the 2-tissue compartment model was varied within a predefined range (from 0.1 to 0.9) and the remaining other 2-tissue compartment parameters (k1-k4) were set constant to their median values. When we keep k1-k4 constant and vary vb from 0.1 to 0.9, the results of this example are a variety of time-activity curves. The changes of the curves are only dependent on vb, because the other parameters k1-k4 are kept constant. For the next step, vb and k2-k4 were kept constant and k1 was varied from 0.1 to 0.9. This procedure was repeated for all 2-tissue compartment parameters. Thus, the impact of the individual 2-tissue compartment parameters on the slope could be assessed.
Fitting of the linear regression function
Overall, five synthetic dynamic studies were calculated, one synthetic study for each of the 2-tissue compartment parameters (vb, k1-k4). For each study, one compartment parameter was varied in 400 steps from 0.1 to 0.9 and all other parameters were kept constant using the corresponding median values calculated from the data base. Furthermore, we repeated the data generation 150 times for each step and added Gaussian noise to the time-activity curves to assess the impact of noise on the slope data. Thus, we obtained 400*150=60000 time-activity curves for each of the 2-tissue compartment parameters, resulting in 300000 curves for all five 2-tissue compartment parameters.
Now, the linear regression function was applied to the synthetic time activity curves to obtain the slope values. Because the 2-tissue compartment parameters were already known for all of the synthetic curves, the slope values could be correlated with the 2-tissue compartment parameters to assess the impact on the slope data.
Results
The time-dependent median values of the input curves stored in the data base were used to calculate a common input curve for the dynamic series (Figure 1). The maximum SUV of the input curve was 11.78, and was decreasing to 1.91 SUV one hour following FDG injection. The histograms of the compartment parameters for the 1760 patient data sets are shown in Figure 2A-E. The distribution of the parameters is different for each of the parameters.
Figure 1.
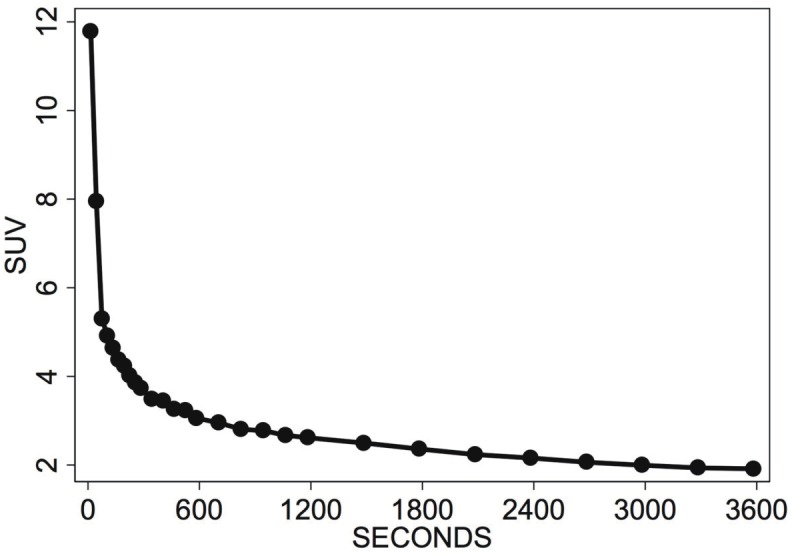
Input curve for FDG with 28 time frames, obtained by calculating the median for each time interval from 1760 input curves obtained in 634 oncological patients.
Figure 2.

Histograms of the 2-tissue compartment results of 1760 data sets. A: vb, B: k1, C: k2, D: k3, E: k4.
Overall, five synthetic studies were obtained, one study for each of the 2-tissue compartment model parameters. Each study was created by varying one compartment parameter from 0.1 to 0.9 in 400 steps while keeping the other parameters constant. Then the linear regression model was applied to these data and the slope values were compared to the corresponding reference data, the 2-tissue compartment parameters, which had been used to generate the time-activity curves. Thus, the impact of each parameter on the slope values was assessed.
The results are shown in Figure 3A-E. The data demonstrate, that the slope values are primarily dependent on k3, the phosphorylation of the intracellular FDG (Figure 3D). The fractional blood volume, vb, is usually low (90 % of all vb values are equal or less than 0.22) and the impact on the slope is nearby zero (Figure 3A), therefore vb does not have a significant impact on the slope values in clinical routine. The parameters k1 and especially k4 have no major impact on the slope, because the impact values are less than 0.001 for x=0.1 to x=0.9 (Figure 3B and Figure 3E). The median of k2 for the 1760 studies in the data base is 0.65, and 90 % of the k2 values are equal or greater than 0.33. Thus, most of the slope data obtained in patient studies will not be altered by k2, because the impact on the slope will be less than 0.001 (Figure 3C).
Figure 3.

A: Impact of the 2-tissue compartment parameter vb on the slope values. B: Impact of the 2-tissue compartment parameter k1 on the slope values. C: Impact of the 2-tissue compartment parameter k2 on the slope values. D: Impact of the 2-tissue compartment parameter k3 on the slope values. E: Impact of the 2-tissue compartment parameter k4 on the slope values.
While the correlation coefficient (r) is a parameter for the degree of relationship between two variables, e.g. the slope and a compartment parameter, the squared correlation coefficient (r^2) reflects the amount of variance in the slope data, which is dependent on a compartment parameter. A very high r2 refers to a tight correlation between two variables and a very low random variance of the data. The squared correlation coefficient (r^2) for the slope and k3 is 0.9716, which refers to an explained variance of 97 % of the data. Therefore, only 3 % of the variance is random and in 97 % the slope values are dependent on k3. Thus, the slope values reflect the k3 values of the 2-tissue compartment model for FDG accurately. The slope images may be named as k3 weighted images (k3w) due to the primary dependency on k3.
In an ongoing study we are evaluating the linear regression model with dPET-CT examinations of oncological patients. For this purpose the lower limit for the slope is set to zero to display only voxels with increasing FDG concentrations over time. One general problem of dPET-CT liver examinations is the concentration of non metabolized FDG in the blood as well as in the normal liver tissue. The non metabolized FDG concentrations in the background area can be high, which may prohibit the detection of metastases with a low FDG phosphorylation rate.
Figure 4A shows a CT image of a metastasis from a gastrointestinal stromal tumor (GIST) in the right lateral part of the liver. The patient had received chemotherapeutic treatment with imatinib for some months prior to dPET-CT. The standard PET FDG images (Figure 4C: FDG uptake image; figure 4E: fused PET-CT image) did not reveal any enhanced FDG uptake in the lesion. However in contrast to the normal FDG uptake image, the slope image (Figure 4D and Figure 4F) clearly reflects metabolized FDG in a part of the metastasis. The lesion can be visualized in the slope image due to the removal of non-metabolized FDG in the blood and the normal liver parenchyma.
Figure 4.

PET-CT of a patient with gastrointestinal stromal tumor and a liver metastasis following chemotherapeutic treatment. A, B: CT image of a dPET-CT examination. The metastasis is noted as a hypodense lesion in the lateral part of the liver. C: FDG uptake image of the liver (55-60 min p.i.). The metastasis has a lower FDG accumulation than the normal liver parenchyma. D: parametric image (k3w), reflecting the metabolized fraction of FDG. The FDG blood background activity is removed by the algorithm. The image demonstrates a circumscribed lesion with enhanced metabolism. E: fusion of the CT image and the FDG uptake image. The metastasis is noted as a low FDG uptake region. F: fusion of the CT image and the parametric image. The parametric image demonstrates, that the metastasis has residual metabolic activity.
Besides the improved detection of liver lesions in GIST, the k3w images may be helpful also for other tumor types. Figure 5A shows a regular PET-CT image of a patient with a desmoid. The desmoid was already known and dPET-CT was performed to assess the metabolic activity of the tumor. However, the regular PET-CT image was not helpful to delineate the mass. In contrast, the desmoid can be easily identified in the k3w image (Figure 5B). Two volumes-of-interest (VOIs) were placed over the desmoid and a reference area on the opposite side (Figure 5C). The time-activity curves (Figure 5D) demonstrate, that the tracer concentrations are decreasing over time in the reference tissue (green line), while the concentrations are moderately increasing in the desmoid (orange line). Nearly identical tracer concentrations were achieved for both VOIs after one hour, which explains the failure to identify the desmoid in the regular PET-CT uptake image due to missing image contrast. However, the slope, k3w, is negative for the reference VOI and clearly positive for the desmoid. The k3w image is confined to positive slope values, therefore the lesion is visible with high image contrast.
Figure 5.

FDG PET-CT of a patient with a desmoid. A: PET-CT image one hour after tracer application. No lesion can be delineated. B: parametric image of the FDG metabolism, obtained from the dynamic PET-CT data. Only the positive slope values are displayed, negative slope values are not shown. The desmoid is visible with high image contrast. C: two VOIs are placed in the image: one VOI for the desmoid and one VOI for a reference region, reflecting normal tissue. D: time-activity data for the desmoid and the normal tissue. The FDG concentrations are increasing with time in the desmoid, while the tracer concentrations are decreasing in the normal tissue. One hour following FDG injection nearly identical tracer concentrations were achieved in both VOIs. However, the slope of the tracer curve is positive for the desmoid and negative for the reference region, which facilitates the identification of the lesion.
Discussion
Dynamic PET and PET-CT studies are helpful to retrieve more detailed information about the time dependent distribution of a tracer. The VOI based quantitative assessment as well as parametric imaging has found limited use in oncological patients for both, improving tumor diagnostics and therapy management [1-3,5,7,10,11].
Factor analysis of dynamic 18F-fluorothymidine studies in patients with malignant brain tumors was applied by Schiepers et al. to dynamic PET data to delineate the vessels for further compartment analysis [11]. This approach was very helpful to obtain an input function for a tracer. Another model is the calculation of Patlak images. Patlak et al. described a graphical approach to obtain blood-to-brain transfer constants for dynamic PET FDG data [12]. The global influx can also be calculated from the 2-tissue compartment parameters using the formula influx = k1*k3/(k2+k3) [13]. Gambhir et al. compared the Patlak method to those results obtained with the 2-tissue compartment model and found a correlation of r=0.90 for both methods [14]. Parametric imaging by applying the Patlak analysis on a voxel level was performed from Messa et al. in patients with liver metastases to achieve a higher contrast [7]. Zasadny and Wahl improved the Patlak images by correlation filtering [15].
While the Patlak method is computationally a fast method, one limitation for the routine use is the requirement of an input function. The input function can be retrieved from the dynamic images, which eliminates the invasive arterial blood sampling or the hot hand method [16]. However, it demands some time for processing due to the placement of a VOI.
One important aspect for all models used for parametric imaging of PET FDG studies is the interpretation of the parametric results. Therefore, the parametric imaging methods should be compared to the 2-tissue compartment model for reference purposes. However, it is difficult to validate models only by correlating with the 2-tissue compartment results of dynamic patient studies, because the five 2-tissue compartment parameters vary from study to study, resulting in numerous combinations of the five parameters. Therefore, the impact of a single compartment parameter on a model parameter is difficult to assess. In contrast, synthetic 2-tissue compartment data have the advantage, that the impact of a single parameter on the slope values can be assessed. An input function is needed for the calculation of synthetic time activity curves. We used the median values of 1760 dPET time-activity data sets obtained from patient examinations to generate a common input function.
Figure 3A-E reveals a primary dependency of the slope values on k3 and a minor impact of k2 and vb. However, k2 usually exceeds 0.33 and vb is less than 0.22, therefore both parameters do not have an impact on the slope values in 90 % of the PET examinations. Thus, we can conclude that the slope values reflect primarily k3 of the 2-tissue compartment model, the intracellular phosphorylation of FDG.
The regression based method had been applied to the dynamic data of colorectal tumors to obtain parametric images [17]. Herzog et al. were among the first authors by applying the linear regression fitting procedure in brain tumors examined with O-(2-[18F]fluoroethyl)-L-tyrosine (FET) [18]. They implemented a fully automatic procedure to obtain the parametric images from dynamic patient studies. Herzog reported, that parametric images were helpful to differentiate high grade from low grade gliomas.
The delineation and detection is generally improved for lesions metabolizing FDG, if parametric images are used. The parametric imaging technique was applied in lung tumors and a contrast enhancement of more than 66 % was obtained [19]. Also in other tumors like head and neck tumors and breast carcinomas parametric imaging was found to be useful [20,21]. Figures 4 and 5 demonstrate, that the FDG concentration in the blood and liver tissue limits the detection of lesions in FDG uptake images. The removal of the FDG background by parametric imaging improves the lesion detection.
Apostolopoulos et al. evaluated parametric imaging with the linear regression function model in patients with liver metastases of gastrointestinal stromal tumors (GIST) [22]. The study comprised 65 dynamic PET examinations in 34 patients with GIST and treatment with chemotherapy. Parametric images were calculated using the linear regression function technique. While the visual evaluation achieved only a sensitivity of about 70 %, the additional use of parametric images improved the sensitivity to 88 %. The increase in sensitivity is due to the improved visualization of the metabolically active fraction of FDG in tissue. The fitting of the non-compartment model based on a linear regression function is fast and user independent and should find routine use for dynamic PET studies.
Conclusions
Parametric imaging is helpful to extract essential information from dynamic PET studies. One fast algorithm is a non compartment model, the fitting of a linear regression function to the time-activity data. Usually it is assumed that the slope of the function is associated with the metabolism of FDG. We generated synthetic time-activity curves to assess which parameter of the 2-tissue compartment model has a major impact on the slope. For this purpose, one 2-tissue compartment parameter was varied and all other were kept constant. Thus, the impact of individual compartment parameters could be assessed. The results demonstrate a primary dependency of the slope values on k3, a compartment parameter associated with the intracellular phosphorylation of FDG.
Conflict of interest statement
There are no conflicts of interest for all authors.
References
- 1.Strauss LG, Dimitrakopoulou-Strauss A. Predicting therapy outcome with quantitative PET: what is needed and what can be done? Onkologie. 2009;32:706–707. doi: 10.1159/000258150. [DOI] [PubMed] [Google Scholar]
- 2.Doot RK, Muzi M, Peterson LM, Schubert EK, Gralow JR, Specht JM, Mankoff DA. Kinetic analysis of 18F-fluoride PET images of breast cancer bone metastases. J Nucl Med. 2010;51:521–527. doi: 10.2967/jnumed.109.070052. [DOI] [PMC free article] [PubMed] [Google Scholar]
- 3.Dimitrakopoulou-Strauss A, Pan L, Strauss LG. Parametric imaging: a promising approach for the evaluation of dynamic PET-18F-FDG studies-the DKFZ experience. Hell J Nucl Med. 2010;13:18–22. [PubMed] [Google Scholar]
- 4.Zhou Y, Ye W, Brasić JR, Wong DF. Multi-graphical analysis of dynamic PET. Neuroimage. 2010;49:2947–2957. doi: 10.1016/j.neuroimage.2009.11.028. [DOI] [PMC free article] [PubMed] [Google Scholar]
- 5.Dimitrakopoulou-Strauss A, Strauss LG, Gutzler F, Irngartinger Kontaxakis G, Kim DK, Oberdorfer F, van Kaick G. Pharmacokinetic imaging of 11C ethanol with PET in eight patients with hepatocellular carcinomas who were scheduled for treatment with percutaneous ethanol injection. Radiology. 1999;211:681–686. doi: 10.1148/radiology.211.3.r99jn12681. [DOI] [PubMed] [Google Scholar]
- 6.Strauss LG, Pan L, Cheng C, Haberkorn U, Dimitrakopoulou-Strauss A. Shortened acquisition protocols for the quantitative assessment of the 2-tissue-compartment model using dynamic PET/CT 18F-FDG studies. J Nucl Med. 2011;52:379–385. doi: 10.2967/jnumed.110.079798. [DOI] [PubMed] [Google Scholar]
- 7.Messa C, Choi Y, Hoh CK, Jacobs EL, Glaspy JA, Rege S, Nitzsche E, Huang SC, Phelps ME, Hawkins RA. Quantification of glucose utilization in liver metastases: parametric imaging of FDG uptake with PET. J Comput Assist Tomogr. 1992;16:684–689. doi: 10.1097/00004728-199209000-00003. [DOI] [PubMed] [Google Scholar]
- 8.Dimitrakopoulou-Strauss A, Strauss LG, Egerer G, Vasamiliette J, Schmitt T, Haberkorn U, Kasper B. Prediction of chemotherapy outcome in patients with metastatic soft tissue sarcomas based on dynamic FDG PET (dPET) and a multiparameter analysis. Eur J Nucl Med Mol Imaging. 2010;37:1481–1489. doi: 10.1007/s00259-010-1435-z. [DOI] [PubMed] [Google Scholar]
- 9.Dimitrakopoulou-Strauss A, Hoffmann M, Bergner R, Uppenkamp M, Eisenhut M, Pan L, Haberkorn U, Strauss LG. Prediction of short-term survival in patients with advanced nonsmall cell lung cancer following chemotherapy based on 2-deoxy-2-[18F] fluoro-D-glucose-positron emission tomography: a feasibility study. Mol Imaging Biol. 2007;9:308–317. doi: 10.1007/s11307-007-0103-6. [DOI] [PubMed] [Google Scholar]
- 10.Strauss LG, Conti PS. The applications of PET in clinical oncology. J Nucl Med. 1991;32:623–648. [PubMed] [Google Scholar]
- 11.Schiepers C, Chen W, Dahlbom M, Cloughesy T, Hoh CK, Huang SC. 18F-fluorothymidine kinetics of malignant brain tumors. Eur J Nucl Med Mol Imaging. 2007;34:1003–1011. doi: 10.1007/s00259-006-0354-5. [DOI] [PubMed] [Google Scholar]
- 12.Patlak CS, Blasberg RG, Fenstermacher JD. Graphical evaluation of blood-to-brain transfer constants from multiple-time uptake data. J Cereb Blood Flow Metab. 1983;3:1–7. doi: 10.1038/jcbfm.1983.1. [DOI] [PubMed] [Google Scholar]
- 13.Strauss LG, Koczan D, Klippel S, Pan L, Cheng C, Willis S, Haberkorn U, Dimitrakopoulou-Strauss A. Impact of angiogenesis-related gene expression on the tracer kinetics of 18F-FDG in colorectal tumors. J Nucl Med. 2008;49:1238–1244. doi: 10.2967/jnumed.108.051599. [DOI] [PubMed] [Google Scholar]
- 14.Gambhir SS, Schwaiger M, Huang SC, Krivokapich J, Schelbert HR, Nienaber CA, Phelps ME. Simple noninvasive quantification method for measuring myocardial glucose utilization in humans employing positron emission tomography and fluorine-18 deoxyglucose. J Nucl Med. 1989;30:359–366. [PubMed] [Google Scholar]
- 15.Zasadny KR, Wahl RL. Enhanced FDG-PET tumor imaging with correlation-coefficient filtered influx-constant images. J Nuci Med. 1996;37:371–374. [PubMed] [Google Scholar]
- 16.Ohtake T, Kosaka N, Watanabe T, Yokoyama I, Moritan T, Masuo M, Iizuka M, Kozeni K, Momose T, Oku S, Nishikawa J, Sasaki Y, Iio M. Noninvasive method to obtain input function for measuring tissue glucose utilization of thoracic and abdominal organs. J Nucl Med. 1991;32:1433–1438. [PubMed] [Google Scholar]
- 17.Strauss LG, Klippel S, Pan L, Schönleben K, Haberkorn U, Dimitrakopoulou-Strauss A. Assessment of quantitative FDG PET data in primary colorectal tumors: which parameters are important with respect to tumor detection? Eur J Nucl Med Mol Imaging. 2007;34:868–877. doi: 10.1007/s00259-006-0319-8. [DOI] [PubMed] [Google Scholar]
- 18.Herzog H, Meyer P, Stoffels G, Floeth F, Coenen H, Langen KJ. Simplified analysis of FET-kinetics in brain tumors by voxel-by-voxel linear regression. J Nucl Med. 2008;49:78. [Google Scholar]
- 19.Strauss LG, Pan L, Hinze C, Thieke C, Cheng C, Haberkorn U, Dimitrakopoulou-Strauss A. Improved delineation of lung tumors by parametric imaging techniques using dynamic PET studies with F-18-deoxyglucose (FDG) and fusion with MRI. J Nucl Med. 2009;50:219. [Google Scholar]
- 20.Strauss LG, Dimitrakopoulou-Strauss A. The role of PET in head and neck cancer. Hell J Nucl Med. 2008;11:6–11. [PubMed] [Google Scholar]
- 21.Strauss LG, Dimitrakopoulou-Strauss A. Positron emission tomography (PET) and macromolecular delivery in vivo. In: Belting M, editor. Methods in Molecular Biology, vol. 480, Macromolecular Drug Delivery. New York, USA: Humana Press; 2009. pp. 187–198. [DOI] [PubMed] [Google Scholar]
- 22.Apostolopoulos DJ, Dimitrakopoulou-Strausss A, Hohenberger P, Roumia S, Strauss LG. Parametric images via dynamic 18F-fluoro-deoxyglucose positron emission tomographic data acquisition in predicting mid-term outcome of liver metastases secondary to gastrointestinal stromal tumors. Eur J Nucl Med Mol Imaging. 2011;38:1212–1223. doi: 10.1007/s00259-011-1776-2. [DOI] [PubMed] [Google Scholar]