

Abstract
Over the past 20 years, multimodal imaging strategies have motivated the fusion of Positron Emission Tomography (PET) or Single Photon Emission Computed Tomography (SPECT) scans with an X-ray computed tomography (CT) image to provide anatomical information, as well as a framework with which molecular and functional images may be co-registered. Recently, pre-clinical nuclear imaging technology has evolved to capture multiple SPECT or multiple PET tracers to further enhance the information content gathered within an imaging experiment. However, the use of SPECT and PET probes together, in the same animal, has remained a challenge. Here we describe a straightforward method using an integrated trimodal imaging system and a sequential dosing/acquisition protocol to achieve dual tracer imaging with 99mTc and 18F isotopes, along with anatomical CT, on an individual specimen. Dosing and imaging is completed so that minimal animal manipulations are required, full trimodal fusion is conserved, and tracer crosstalk including down-scatter of the PET tracer in SPECT mode is avoided. This technique will enhance the ability of preclinical researchers to detect multiple disease targets and perform functional, molecular, and anatomical imaging on individual specimens to increase the information content gathered within longitudinal in vivo studies.
Keywords: Dual tracer imaging, trimodal imaging, Positron Emission Tomography (PET), Single Photon Emission Computed Tomography (SPECT), X-ray Computed Tomography (CT), nuclear imaging
Introduction
A growing number of preclinical imaging facilities are equipped with instrument suites that include some combination of ultrasound (US), magnetic resonance (MR), positron emission tomography (PET), single photon emission computed tomography (SPECT), X-ray computed tomography (CT), and optical imaging. This equipment enables noninvasive molecular, functional, and anatomical imaging of animals to serve several functions. They provide a broad range of tools to meet the diverse in vivo imaging applications of researchers across the gamut of biomedical and engineering sciences [1,2]. The imaging is noninvasive, enables researchers to test hypotheses using fewer animals, and typically yields improved statistical outcomes given that biological changes are measured within individual cohorts over time rather than between separate cohorts.
While individual modalities are certainly effective for hypothesis testing within a given research area, combined multimodal imaging has increased the information content and data fidelity gathered during in vivo studies [2,3]. Disease states may exhibit complex functional elements that include cell localization and/or changes in blood perfusion. Further, many disease states present unique molecular markers that may be detected with specially designed probes. A given disease may also change the physical character of the tissue or organ under study; in which case, anatomical imaging should be included. Researchers can better characterize these complex disease states by combining available probes and labels with corresponding imaging technology to interrogate multiple biological elements simultaneously or in quick succession. For example, both researchers and clinicians now routinely couple a PET or SPECT scan with a CT in order to have functional/molecular information along with anatomical information [4]. An additional benefit is that CT also provides a three-dimensional anatomical map with which to co-register radioactive signals from PET and SPECT probes. There are numerous examples in the literature where these types of dual reporter and dual tracer approaches have provided a better understanding of biological systems or improved diagnosis. Manuscripts that detail combinations of reporters and tracers have included dual imaging of optical reporters [5], dual imaging of an optical reporter and a nuclear tracer [6], dual imaging of PET tracers [7-9], and dual imaging of SPECT tracers [10].
To date, there has been little reported regarding dual SPECT/PET tracer imaging. Protocols for performing dual tracer SPECT imaging of 99mTc-Tetrofosmin and 18F-FDG tracers with high energy collimators and detectors have been detailed for measurement of myocardial perfusion and viability in human patients [11]. In this work, the authors described minor artifacts related to downscatter of the 18F isotope during single SPECT acquisitions that capture the simultaneous emission from both isotopes (versus two individual SPECT captures tuned for each energy). Efforts to develop preclinical hardware for simultaneous scanning of SPECT and PET isotopes have been described in the conference abstract literature in 2007 and 2009 [12-15], but peer-reviewed articles do not appear to have followed these reports.
The arrival of SPECT/PET/CT (sequential imaging) systems in the preclinical market is a recent development that may enable dual SPECT/PET tracer imaging combined with CT. Siemens (www.medical.siemens.com), GE/Gamma Medica (www.gm-ideas.com), Bioscan/Mediso (www.bioscan.com), and Carestream (www.carestream.com) have all released systems in the past three years in which individual hardware for each modality has been merged onto one platform. Meanwhile, other equipment vendors like MILabs (www.milas.com) have released SPECT systems with high energy collimators capable of collecting signal from PET isotopes. With the advent of this preclinical instrumentation, dual SPECT/PET tracer imaging protocols are now feasible provided that sufficient consideration is given to the radionuclide and detector properties of the system employed. Here we describe a method using an integrated trimodal imaging system and a sequential SPECT, CT, PET protocol to achieve dual SPECT/PET tracer imaging in conjunction with anatomical CT. Dosing and imaging is completed so that minimal animal manipulations are required, full trimodal fusion is conserved, and tracer crosstalk, including down-scatter of the PET tracer in SPECT mode, is avoided. This technique will enhance the ability of preclinical researchers to detect multiple disease targets and perform functional, molecular, and anatomical imaging on individual specimens to increase the information content gathered within longitudinal in vivo studies.
A number of factors must be considered in the design of a viable dual SPECT/PET (and optional combined CT) imaging protocol. The relative properties of SPECT and PET radionuclides, and their ability to contribute signal during a PET, SPECT or CT acquisition must be evaluated. Further, the specific configurations and properties of a given imaging system must be considered. X-ray CT is essentially an orthogonal imaging modality given that PET-CT and SPECT-CT are now routine in both clinical and pre-clinical settings. Thus, the key obstacle in these studies is the potential for crosstalk of SPECT and PET isotopes during image acquisition in the opposite corresponding modality. The specific variables, including detector and tracer properties used, that affect the integrity of dual SPECT/PET imaging are presented in some detail further below. Individual that wish to review the PET and SPECT modalities in detail are directed to the following quality articles: Khalil et al., Wong and Kim, and Cherry [16-18].
Materials and methods
Nuclear imaging equipment
The AtomLab 400 dose calibrator (Biodex Medical Systems, Shirley, NY, USA) was employed to calibrate tracer doses. PET, SPECT, and CT images were acquired with a trimodal Albira PET/SPECT/CT imaging system (Carestream Molecular Imaging, Woodbridge, CT, USA). The Albira system includes a sample platform that passes through the PET, SPECT, and CT mode imaging planes. The PET ring is positioned proximally to the loading bay. The gantry platform passes through the PET ring to reach the shared SPECT and CT imaging planes. An evaluation and description of the monolithic LYSO crystal based PET detector employed in the Albira system was recently reported by Sanchez et al. [19] using the National Electrical Manufacturers Association (NEMA) NU-4 protocol. A single tungsten collimator (1 mm pinhole and 2 mm thick) was employed for SPECT acquisitions. The system was calibrated to allow for automated fusion of PET and CT modalities, as well as SPECT and CT modalities.
Nuclear imaging reagents
99mTc-Pertechnetate, Technetium (99mTc) albumin aggregated (99mTc-MAA), and 99mTc-Pentatate were obtained from the Cardinal Health Nuclear Pharmacy branch in South Bend, IN, USA. 2-deoxy-2-(18F)Fluoro-D-glucose (18F-FDG) and 18F Sodium fluoride (Na18F) were obtained from Spectron MRC, LLC (South Bend, IN, USA).
In vitro dual SPECT/PET imaging
A serial dilution of 99mTc-Pertechnetate was prepared in which a starting activity of 48 μCi was dispensed in replicate into the first well of six rows of a 96-well plate. These six rows were subjected to a two-fold serial dilution so that each row had five total dilutions. The plate was affixed to a standard mouse bed platform supplied with the Albira PET/SPECT/CT imaging system. A 30-minute SPECT acquisition (120 mm field of view (FOV), single-pinhole collimator, 60 projections) was performed. The plate was subsequently imaged in PET mode with a five-minute integration time. After these initial acquisitions, serial dilutions of 18F-FDG, at a starting activity of 2.4 μCi, were prepared. The 96-well plate was retracted from the scanner and six replicates of the 18F-FDG dilutions were dispensed in an opposite gradient to the 99mTc-Pertechnetate dilution described above and without disturbing the spatial positioning of the plate. Three of six 18F-FDG dilution series overlapped with the SPECT solution, while the other three were not mixed. The plate was then imaged in PET mode with a five-minute integration time.
In vivo trimodal SPECT/CT/PET imaging
Animals
Male nude hairless mice (SKH1, Charles River, Wilmington, MA, USA), aged eight weeks, were employed for the in vivo imaging described here. Mice were anesthetized by Isofluorane (2.5% flow rate) and kept under via a nose-cone setup for imaging. Each tracer was administered via a lateral tail vein catheter to avoid movement of the animal between imaging acquisitions.
Trimodal SPECT/CT/PET acquisition
As part of the dosing and imaging protocol, mice first received a 1 mCi dose of SPECT tracer (99mTc-MAA or 99mTc-Pentetate) through a catheter and were kept under anesthesia for an additional 30 minutes to allow for desired biodistribution of the probe. A 10-minute SPECT scan (120 mm FOV, multi-pinhole collimator, 60 projections) was performed, followed by a CT scan (110 mm FOV, 45 kVp, 200 uA, at 400 projections). At completion of the SPECT/CT imaging, and without moving the specimen, a 100 μCi dose of Na18F was administered via the catheter. Each mouse was kept under anesthesia in the imaging bed for an additional 30 minutes, again, to allow for the desired biodistribution. A five-minute PET scan (110 mm FOV) was acquired, and the mouse was returned to its cage.
Calculation of Albira PET detection dead time losses
Albira PET mode dead time losses have been calculated by imaging 2 mCi of 18F-FDG (starting activity in excess of Albira PET detector maximum detection rate), in a cylinder phantom (15 mm in diameter and 30 mm in length) and placed in the center of the scanner FOV. PET scans (acquisition time = 60 sec) were acquired at 10 minute intervals through a total of 20 hours.
Image processing
The SPECT/CT scans were reconstructed using the default settings (OSEM and FBP algorithms, respectively), while the PET scan required manual reconstruction (using MLEM algorithm) to fuse the data with the CT. In the Albira Suite Reconstructor software (Carestream Molecular Imaging, Woodbridge, CT, USA), the SPECT/CT data set was selected, and the OSEM and FBP algorithmschosen for tomographic reconstruction. The reconstruction software automatically fused the SPECT and CT data sets. When completed, the PET data set was highlighted and added to the queue, and “Advanced Reconstruction” was selected in order to fuse the PET data to the previously acquired CT. The PET-CT data were reconstructed and saved in a corresponding folder.
Analysis, visualization, and rendering
Reconstructed in vitro data files were analyzed in PMOD software (PMOD Technologies LTD, Zurich, Switzerland). Reconstructed PET, SPECT, and CT data files were opened in PMOD and exported in the “Analyze” format for rendering and visualization in VolView 3.2 (Kitware, Clifton Park, NY, USA). Images for PET, SPECT, and CT from identical angles were captured from VolView and saved as tiff files. Montage displays for single and multimodalities were generated in ImageJ v1.44 (Research Services Branch, National Institute of Mental Health, Bethesda, MD, USA (available at http://rsbweb.nih.gov/ij/download.html) and saved as tiff files.
Results
In vitro dual SPECT/PET imaging
Crossing gradients of 99mTc-Pertechnetate and 18F-FDG were imaged to assess each of their putative signals captured in both SPECT and PET modes. This information was subsequently used to guide the development of a dual-probe in vivo protocol. First, a serial two-fold dilution of 99mTc-Pertechnetate, with starting activity of 48 μCi, was prepared in a 96-well plate in replicates of six. This dilution series was then imaged in SPECT mode, and the results are shown in Figure 1A in the “red hot” color intensity map. The sample plate was then imaged in PET mode before any addition of 18F-FDG. This resulted in a blank image identical to background (data not shown). A serial two-fold dilution of 18F-FDG, with starting activity of 2.4 μCi in replicates of six, was then added to the plate in an opposing gradient and in a manner to allow for subsequent imaging of both isolated and mixed SPECT/PET radionuclide. The sample was imaged again in PET mode. The PET results are displayed in Figure 1A in the “rainbow” intensity scale. Volume-of-interest (VOI) analysis was performed for this PET mode detection for the unmixed and mixed 18F-FDG dilution series. There was no appreciable difference in VOI analysis between the unmixed 18F-FDG dilutions and those that were mixed with 99mTc-Pertechnetate (Figure 1B). The 96-well plate with mixed SPECT/PET radionuclide was again imaged in SPECT mode. Significant noise was apparent in this data set (not shown), likely due to PET gamma rays that penetrate the collimator and are down-scattered into the SPECT camera, causing spurious detection events. Thus, SPECT acquisition in the presence of PET isotopes was omitted from subsequent strategies to achieve trimodal in vivo data. Fortunately, these in vitro results indicated that a dual-tracer imaging protocol that includes PET mode detection in the presence of SPECT tracer should be viable. Consequently, an in vivo method was conceived in which SPECT dosing, SPECT imaging, CT imaging, PET dosing, and PET imaging were performed in sequence and without moving the animal to preserve anatomical co-registration (Figure 2).
Figure 1.
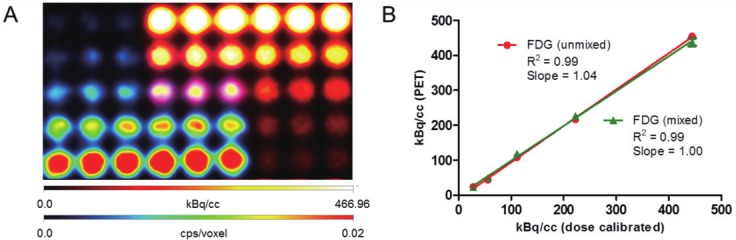
A. Crossing gradients of 99mTc-Pertechnetate (rainbow intensity scale) and 18F-FDG (hot intensity scale) in a 96-well plate imaged via sequential SPECT and PET mode acquisitions. B. kBq/cc unmixed and mixed 18F-FDG activity per well according to the PET mode detection plotted vs. dose calibrated activity.
Figure 2.
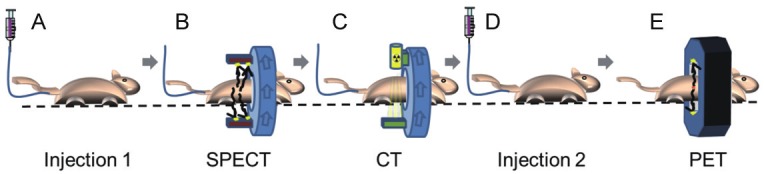
Trimodal in vivo imaging with PET and SPECT probes is achieved through the following workflow: A. Injection of SPECT probe through IV catheter; B. SPECT imaging; C. X-ray CT Imaging; D. Injection with PET probe through IV catheter; E. PET imaging.
In vivo trimodal SPECT/CT/PET imaging
In vivo imaging studies were subsequently conducted to assess the feasibility of the sequential protocol outlined in Figure 2 to achieve dual SPECT/PET tracer imaging in conjunction with CT. The first cohort of animals (n = 3) received 99mTc-MAA, a lung perfusion probe for SPECT, and the PET tracer Na18F, which accumulates in areas of bone regeneration. These two probes were chosen because they label orthogonal anatomical areas, thus facilitating an analysis of any potential crosstalk. A tail-vein catheter was used so that tracers could be administered to the mice while under anesthesia in the imaging bed. This eliminated the need to move the animals between acquisitions. 99mTc-MAA was administered first, and the animal was maintained under anesthesia for 30 minutes prior to imaging to allow for desired biodistribution of 99mTc-MAA. The animal was then imaged in SPECT mode, followed by a CT. Na18F was subsequently administered via the catheter, and the animals were maintained under anesthesia for another 30 minutes to allow for the desired biodistribution. Each animal was finally imaged in PET mode and returned to its cage. Because both the SPECT and PET positioning are calibrated for automatic fusion to the CT, and the animals did not move during acquisition, the fusion for the SPECT and PET images was ensured. Figure 3 presents a montage of a representative mouse imaged using the sequential protocol. 99mTc-MAA showed clear lung-perfusion tracer activity (third frame), while Na18F showed characteristic bone-labeling activity (second frame). VOI analysis of the lung region of the PET data of this cohort yielded values of 120 +/- 51 kBq/cc (standard error of the mean, SEM). Control animals that were not injected with 99mTc-MAA, but did receive a dose of Na18F had values of 89 +/- 31 in the lung region. These values were not statistically different.
Figure 3.
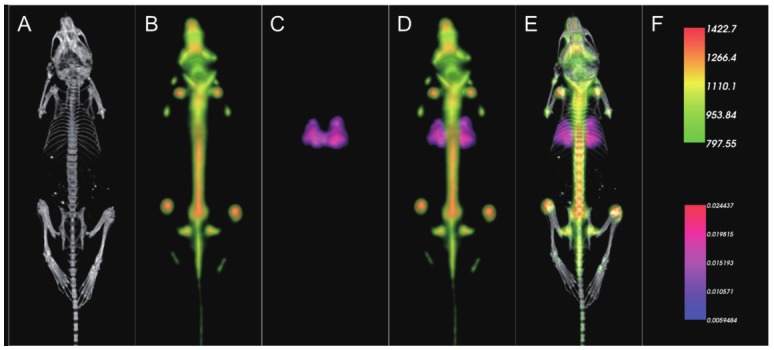
Representative results of dual in vivo 99mTc-MAA and Na18F tracer imaging showing individual modality displays A. CT, B. PET, C. SPECT, D. a merged dual modality PET/SPECT display, and E. a merged trimodal PET/SPECT/CT display. Unit scale bars for PET (kBq/cc) and SPECT (cps/voxel, voxel size = 250 μm isotropic) are presented in the top and bottom half of frame F, respectively.
Next, a second cohort of animals (n = 3) was imaged using the same dosing and imaging protocol outlined in Figure 2, but with an alternative SPECT tracer, 99mTc-Pentetate, that accumulates and clears through the kidneys. Figure 4 presents a montage of a representative mouse from this experiment in which 99mTc-Pentetate showed characteristic clearance in the kidneys and bladder, while Na18F showed characteristic bone labeling activity. VOI analysis of the kidney region of the PET data of these mice yielded values of 133 +/- 16 kBq/cc. Meanwhile, the kidney regions of mice injected with only Na18F had values of 115 +/- 13 kBq/cc. These values were not statistically different. These in vivo imaging results provided the first crucial evidence that PET mode imaging is not significantly perturbed by the presence of relatively high activities of PET isotope during experimental in vivo imaging conditions.
Figure 4.
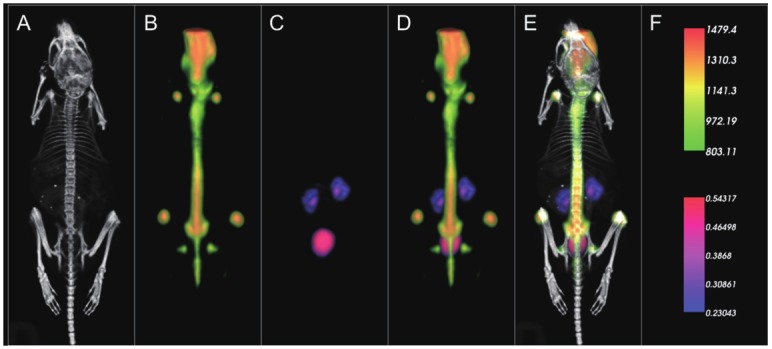
Representative results of dual in vivo 99mTc-Pentetate and Na18F tracer imaging showing individual modality displays A. CT, B. PET, C. SPECT, D. a merged dual modality SPECT/PET display, and E. a merged trimodal PET/SPECT/CT display. Unit scale bars for PET (kBq/cc) and SPECT (cps/voxel, voxel size = 250 μm isotropic) are presented in the top and bottom half of frame F, respectively.
Calculation of dead time and maximum count threshold
A critical component of the sequential protocol noted in Figure 2 required the acquisition of PET data when SPECT isotope was present at an almost 10-fold higher activity. Thus, it was important to further validate that the maximum count rate and dead times within PET are not violated by the presence of SPECT isotope. Figure 5 presents data in which a saturating activity of 2 mCi 18F was placed within the PET imaging field of view, and imaged at 10 minute intervals. The first data point at right indicates the maximum count rate that could be detected with an acceptable dead time tolerance. Additional acquisitions were gathered to define and model the dead time values over a range of activities. Using the initial measure of SPECT tracer activity, a 1 mCi dose of 99mTc will correspond to 37M events/sec. A 100 μCi PET tracer activity of 18F-FDG corresponds to 370k event/sec. The Albira PET system design has physical sensitivity values of 5% (250-750 keV) for the 16 total modules comprising the 2-ring PET system (8 modules per ring). So, 5/16% of the activity is recorded for each detector, which corresponds to 115,625 and 11,562.5 events/sec for the 99mTc SPECT and 18F-FDG PET tracers, respectively. Combined, a maximum of 127,187.5 events/sec will arrive to each detector in the system. Figure 5 shows a graph of the dead time losses of a typical Albira PET detector. It can be estimated that for maximum calculation of 127,187.5 event/sec, the dead time loss is approximately 12% which is an acceptable value and makes the sequential imaging protocol feasible. Further, the maximum rate achievable by the Albira system was 200k events/sec for a single detector module before saturation occurred, as noted in the dead time plot in Figure 5. This maximum rate significantly exceeds the events expected with the in vivo experimental tracer activities employed above.
Figure 5.
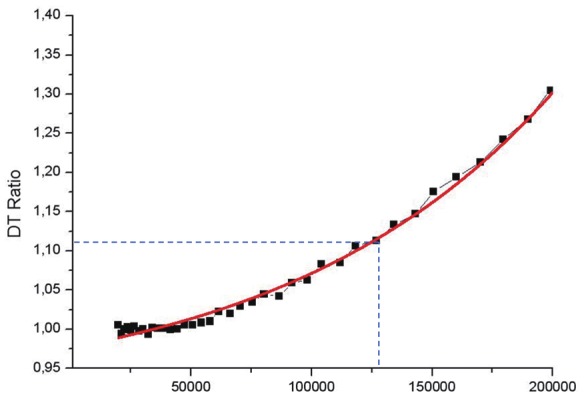
Dead time losses of a typical Albira PET detector at a range of events per second where the X-axis is events/seconds and the Y-axis is the dead time (DT) ratio. The dual tracer (1 mCi 99mTc SPECT and 100 μCi 18F-FDG PET starting activity) protocol used here would produce a maximum rate of 127,187.5 events/sec (denoted by blue hashed intercept line) at the detectors. It can be estimated that the dead time losses with this maximum rate would be approximately 12%.
Discussion
Initial studies were performed in vitro to assess the feasibility for trimodal PET/SPECT/CT instrumentation to achieve dual tracer imaging with PET and SPECT isotopes. The radionuclides, 99mTc and 18F, were utilized because they represent two of the most common isotopes employed for SPECT and PET imaging, and they are incorporated into numerous commercially available tracers. Overlapping serial dilutions of these SPECT and PET radionuclides were imaged in a 96-well plate to evaluate crosstalk within each detection platform (Figure 1). The SPECT module employed here was set to a 15% window for discrimination of gamma rays emitted at 140 keV by 99mTc. In theory, this should be sufficient to exclude the 511 keV emission stimulated by a PET tracer. However, the SPECT images of the 96-well plate showed significant artifacts in the presence of PET isotope 18F. This is most likely caused by down-scatter of the high energy PET gamma rays that penetrate the SPECT collimator and scatter into the detector, potentially to within its SPECT mode 15% discrimination window at 140 keV. Shao et al. and Bartoli et al. have reported previously on the complications of down-scatter on SPECT mode detections performed in the presence of the PET radionuclides [13,14]. Furthermore, SPECT mode detection in this system does not have a complementary variable with which to exclude spurious counts resulting from PET downscatter, in the way that PET mode excludes any signal lacking coincident detections. It is therefore not surprising that when 18F-FDG was imaged in SPECT mode, we noted significant artifacts upon reconstructions that negated this approach from further consideration. Meanwhile, when a PET acquisition of 18F-FDG was gathered in the presence of a 20-fold higher activity of 99mTc, no disruptions of the PET reconstruction or data linearity were noted in the resulting image. These in vitro results guided the implementation of an in vivo dosing and imaging method that would allow for SPECT mode acquisition in the absence of a PET tracer. By performing a sequential protocol of SPECT tracer dosing, SPECT imaging, CT imaging, PET tracer dosing, and PET imaging (Figure 2), we were able to construct a strategy that would potentially enable all three modalities to be utilized on a single living specimen.
Subsequent in vivo studies were performed in which combinations of SPECT and PET tracers were utilized in conjunction with the strategy outlined in Figure 2. Two different sets of SPECT and PET probes were utilized for in vivo imaging and protocol validation: 99mTc-MAA with Na18F (Figure 3), and 99mTc-Pentetate with Na18F (Figure 4). Each of these probes targets orthogonal anatomical structures, such that a straightforward analysis of the data would detect the existence of crosstalk. Since SPECT images were strategically acquired in the absence of PET isotope, they yielded straightforward perfusion images of the intended lung and kidney targets. When the opposite case was tested, no bleed through of SPECT signal in the lungs or kidneys was visually noted in the reconstructed PET images given in Figures 3 and 4. When VOI analysis was performed on the PET data from the experimental lung and kidney trimodal cohorts, the values obtained were statistically no different than corresponding control animals. The background signals from these tissues resulted from non-specific uptake of PET isotope, and excluded the SPECT signal despite the fact a 10-fold higher activity of 99mTc tracer was injected and concentrating in these anatomical regions. This provided critical evidence that the PET modality would reliably reject SPECT events from its reconstructed image, and serve as the cornerstone for sequential trimodal imaging.
While the in vitro and in vivo data were certainly compelling, the fidelity of PET was further evaluated in the context of the current experimental protocol. The four most important variables affecting the reliability of PET mode acquisition in the presence of SPECT tracer (99mTc) pertain to: 1) the energy resolution of the PET detector, 2) The ability to exclude spurious detections lacking a coincident event at 180 degrees, 3) The dead time of the PET detectors, and 4) The maximum achievable count rate of the PET detector. First, in the case of the Albira PET system, the average achievable energy resolution is about 15%, allowing the system to properly exclude 99mTc 140 keV gamma rays yet still provide adequate sensitivity to the 511 keV gamma rays resulting from positron annihilation. Indeed, the energy resolution of approximately 400 to 600 keV (20%) employed in this study provides sufficient resolution to exclude 99mTc 140 keV gamma rays. Further, commercial PET systems will be guarded from spurious detections due to a requirement for coincident detection within a narrow time window, in this case 5 ns. It is important to note that while certain energies may be excluded from use for reconstruction, they are still detected and recorded in the list mode data. Thus, the SPECT isotope may still have deleterious effects on the ability of the PET detectors to cope with the increase in dead time resulting from increased count rates. As noted in Figure 5, the total count rate and dead times calculated for the in vivo sequential experimental conditions are well within the tolerances of the PET/SPECT/CT image station used for this study. We expect that when similar analyses are performed on the trimodal platforms offered by other vendors, this sequential protocol will be readily applicable.
In addition to the efforts made to facilitate distinct detection of SPECT and PET tracers, there were other essential factors to this imaging method that pertained mostly to conserving animal position. First, the placement and use of a catheter for dosing was critical for ensuring that the spatial position was fixed between SPECT mode and PET mode imaging. Additionally, the bimodal SPECT/PET system, calibrated for registration to a shared modality (CT), was essential for subsequent automated PET/SPECT/CT fusions. Without automated modality fusions, manual manipulations may have been required here and for any future studies, significantly adding to the labor required to obtain useful data.
Many commercial and custom SPECT and PET tracers utilize the two specific radionuclides (99mTc and 18F) employed throughout this study. Using the imaging protocol described here, imaging of any combination of a 99mTc tracer with an 18F tracer should be possible and should allow for multifunctional SPECT/PET imaging. Table 1 provides a partial list of some of the potential 99mTc and 18F tracers that could be employed with this straightforward method. Additionally, with an aging reactor infrastructure and recent experience with shortages in 99mTc, this protocol may prove valuable if efforts to convert tracers to alternative isotopes become necessary. We have not evaluated other combinations of radionuclides other than 99mTc and 18F, but based on the results obtained here and the defined energy resolutions of our system and most commercial imaging equipment, we believe that additional permutations of SPECT and PET isotopes should be feasible.
Table 1.
Common radiotracers that incorporate 99mTc or 18F that may be used for dual tracer SPECT/PET imaging.
| 99mTc (SPECT) | 18F (PET) |
|---|---|
| Sestamibi: Cardiac Imaging | Fluorodeoxyglucose: Metabolic Imaging |
| Hexamethylpropyleneamine Oxime: Cerebral Imaging | Fluorothymidine: Proliferation Imaging |
| Pentetate: Renal Imaging | Fluoromisonidazole: Hypoxia Imaging |
| Macro-Aggregates of Albumin: Pulmonary Imaging | Fluoroethylspiperone: Dopamine Receptor Imaging |
| Pertechnetate: Thyroid Imaging | Palmitate: Cardiac Imaging |
| Methylene Diphosphonate: Bone Imaging | Sodium Fluoride: Bone Imaging |
| Tetrofosmin: Cardiac Imaging | |
| Sulfur Colloid: Spleen Imaging | |
| Tin Colloid: Blood Imaging | |
| RGD Peptide: Angiogenesis Imaging | |
| Annexin: Apoptosis Imaging |
Many valuable dual SPECT/PET tracer experiments may conceivably be conducted that would warrant the use of the dual SPECT/PET imaging protocol described here. Future improvements in dual SPECT/PET imaging could theoretically allow for improvements in throughput and a reduction in labor. Simultaneous SPECT/PET imaging would potentially provide improved efficiency and time savings, and there are reports of imagers that could potentially allow for simultaneous imaging [12,14]. These reports are promising, although there appears to be some compromise with simultaneous SPECT/PET systems developed to date, particularly with regard to complications associated with down-scatter and reported PET sensitivities in comparison to the existing leading single-modality PET imagers. (The Vector system from MILabs is a commercially available preclinical system capable of simultaneous dual-tracer scanning; however to our knowledge, complete performance characteristics of this system for simultaneous scanning have not been published). Until further improvements in simultaneous SPECT/PET imaging systems are made, the methods described here provide a straightforward approach for achieving sensitive dual tracer imaging. It should be possible to adapt the methods described here to most integrated PET/SPECT systems, including the Siemens Inveon or GE Triumph, given sufficient considerations to the detector properties of each instrument.
Dual SPECT/PET tracer imaging protocols may further extend the value of multimodality suites. However, it will be particularly important to factor the animal radiation exposures with dual SPECT/PET dosing, especially when combined with CT imaging. Some estimates indicate that animals could receive approximately 15% of the reported total lethal radiation dose for mice during the course of a typical longitudinal PET/CT study [20,21]. These estimates are for studies that utilize a single tracer only, and the addition of a second tracer would further increase the radiation dose. Continued increases in instrument sensitivity will enable lower injected-probe activities and help to mitigate the increased exposure from the use of multiple probes.
Conclusion
A preliminary in vitro study of unmixed and mixed crossing gradients of 99mTc and 18F was used to design a strategy for in vivo dual SPECT/PET imaging. In vitro imaging of 99mTc and 18F showed that PET mode detection sufficiently excluded 99mTc 140 keV energy, while SPECT mode detection was upset in the presence of 18F, likely due to down-scatter of high energy PET gamma radiation. Based on these results, a sequential SPECT dosing, SPECT imaging, CT imaging, PET dosing, and PET imaging protocol was tested in vivo to achieve dual SPECT/PET imaging coupled with CT. Subsequent analysis of the dead times and maximum detectable activity indicated that our particular protocol was in a safe range for our given commercial instrument. Indeed, these same calculations are recommended when considering trimodal methods using different combinations of SPECT and PET isotopes in concert with other trimodal instrumentation. In summary, the use of dual tracer SPECT and PET imaging with 99mTc and 18F tracers is feasible using a sequential protocol, and will enable researchers to enhance and increase the information content that may be gleaned during pre-clinical in vivo imaging studies.
Acknowledgments
WML warmly thanks funding from the Notre Dame Integrated Imaging Facility and from Carestream Health, Inc. for funding the purchase of radioactive probes used in this study.
Disclosures
Todd A. Sasser is an employee of Carestream Molecular Imaging. W. Matthew Leevy is a former full time employee for Carestream, and currently works for them in a consulting role. Carlos Correcher and Antonio J. González are employees of Oncovision.
References
- 1.James ML, Gambhir SS. A molecular imaging primer: modalities, imaging agents, and applications. Physiol Rev. 2012;92:897–965. doi: 10.1152/physrev.00049.2010. [DOI] [PubMed] [Google Scholar]
- 2.Ray P. Multimodality molecular imaging of disease progression in living subjects. J Biosci. 2011;36:499–504. doi: 10.1007/s12038-011-9079-0. [DOI] [PubMed] [Google Scholar]
- 3.Pool SE, ten Hagan TL, Koelewijn S, de Jong M, Koning GA. Multimodality imaging of somatostatin receptor-positive tumors with nuclear and bioluminescence imaging. Mol Imaging. 2012;11:27–32. [PubMed] [Google Scholar]
- 4.Maurer AH. Combined imaging modalities: PET/CT and SPECT/CT. Health Phys. 2008;95:571–576. doi: 10.1097/01.HP.0000334064.46217.20. [DOI] [PubMed] [Google Scholar]
- 5.Zhou L, El-Deiry WS. Multispectral fluorescence imaging. J Nucl Med. 2009;50:1563–1566. doi: 10.2967/jnumed.109.063925. [DOI] [PubMed] [Google Scholar]
- 6.Deroose CM, De A, Loening AM, Chow PL, Ray P, Chatziioannou AF, Gambhir SS. Multimodality imaging of tumor xenografts and metastases in mice with combined small-animal PET, small-animal CT, and bioluminescence imaging. J Nucl Med. 2007;48:295–303. [PMC free article] [PubMed] [Google Scholar]
- 7.Black NF, McJames S, Kadrmas DJ. Rapid multi-tracer PET tumor imaging with 18F-FDG and secondary shorter-lived tracers. IEEE Trans Nucl Sci. 2009;56:2750–2758. doi: 10.1109/TNS.2009.2026417. [DOI] [PMC free article] [PubMed] [Google Scholar]
- 8.Koeppe RA, Raffel DM, Snyder SE, Ficaro EP, Kilbourn MR, Kuhl DE. Dual-[11C] tracer single-acquisition positron emission tomography studies. J Cerebr Blood F Met. 2001;21:1480–1492. doi: 10.1097/00004647-200112000-00013. [DOI] [PubMed] [Google Scholar]
- 9.Xu B, Guan Z, Liu C, Wang R, Yin D, Zhang J, Chen Y, Yao S, Shao M, Wang H, Tian J. Can multimodality imaging using 18F-FDG/18F-FLT PET/CT benefit the diagnosis and management of patients with pulmonary lesions? Eur J Nucl Med Mol Imaging. 2011;38:285–292. doi: 10.1007/s00259-010-1625-8. [DOI] [PubMed] [Google Scholar]
- 10.Trott CM, El Fakhri G. Sequential and simultaneous dual-isotope brain SPECT: comparison with PET for estimation and discrimination tasks in early Parkinson disease. Med Phys. 2008;35:3343–3353. doi: 10.1118/1.2940605. [DOI] [PMC free article] [PubMed] [Google Scholar]
- 11.Pagnanelli RA, Hanson MW, Turkington T, Coleman E, Borges-Neto S. Gated 99mTc-Tetrofosmin and 18F-FDG studies: a comparison of a singleacquisition and separate-acquisition protocols. J Nucl Med Technol. 2002;30:175–178. [PubMed] [Google Scholar]
- 12.Shao Y, Yao R, Ma T, Manchiraju P. Initial studies of PET-SPECT dual-tracer imaging. IEEE Nucl Sci Symp Conf Rec. 2007;6:4198–4204. [Google Scholar]
- 13.Shao Y, Yao R, Ma T, Manchiraju P. PET and SPECT dual-tracer imaging: correction of 511keV photon’s down-scatter effect on SPECT. IEEE Nucl Sci Symp Conf Rec. 2007;5:3404–3407. [Google Scholar]
- 14.Bartoli A, Belcari N, Del Guerra A, Fabbri S. Simultaneous PET/SPECT imaging with the small animal scanner YAP-(S)PET. IEEE Nucl Sci Symp Conf Rec. 2007;5:3408–3413. [Google Scholar]
- 15.Tainter KH, Lokitz S, Vascoe C, Zhang J, Coco BJ, Iwata K, Wagenaar DJ, Mathis JM. PET, SPECT and CT Trimodality Imaging of a Mouse Injected with Mixed Modality Isotopes. World Molecular Imaging Conference, Imaging Methodology and Instrumentation. 2009 Presentation Number 1024. [Google Scholar]
- 16.Khalil MM, Tremoleda JL, Bayomy TB, Gsell W. Molecular SPECT imaging: an overview. Int J Mol Imaging. 2011;2011:796025. doi: 10.1155/2011/796025. [DOI] [PMC free article] [PubMed] [Google Scholar]
- 17.Wong FC, Kim EE. A review of molecular imaging studies reaching the clinical stage. Eur J Radiol. 2009;70:205–211. doi: 10.1016/j.ejrad.2009.01.049. [DOI] [PubMed] [Google Scholar]
- 18.Cherry SR. Fundamentals of positron emission tomography and applications in preclinical drug development. J Clin Pharmacol. 2001;41:482–491. doi: 10.1177/00912700122010357. [DOI] [PubMed] [Google Scholar]
- 19.Sánchez F, Moliner L, Correcher C, González A, Orero A, Carles M, Soriano A, Rodriguez-Alvarez MJ, Medina LA, Mora F, Benlloch JM. Small animal PET scanner based on monolithic LYSO crystals: performance evaluation. Med Phys. 2012;39:643–653. doi: 10.1118/1.3673771. [DOI] [PubMed] [Google Scholar]
- 20.Hildebrandt IJ, Su H, Weber WA. Anesthesia and other considerations for in vivo imaging of small animals. ILAR J. 2008;49:17–26. doi: 10.1093/ilar.49.1.17. [DOI] [PubMed] [Google Scholar]
- 21.Taschereau R, Chow PL, Chatziioannou AF. Monte Carlo simulations of dose from microCT imaging products in a realistic mouse phantom. Med Phys. 2006;33:216–224. doi: 10.1118/1.2148333. [DOI] [PMC free article] [PubMed] [Google Scholar]