Abstract
After more than 20 years of research, a fully integrated PET/MR scanner was launched in 2010 enabling simultaneous acquisition of PET and MR imaging. Currently, no clinical indication for combined PET/MR has been established, however the expectations are high. In this paper we will discuss some of the challenges inherent in this new technology, but focus on potential applications for simultaneous PET/MR in the field of oncology. Methods and tracers for use with the PET technology will be familiar to most readers of this journal; thus this paper aims to provide a short and basic introduction to a number of different MRI techniques, such as DWI-MR (diffusion weighted imaging MR), DCE-MR (dynamic contrast enhanced MR), MRS (MR spectroscopy) and MR for attenuation correction of PET. All MR techniques presented in this paper have shown promising results in the treatment of patients with solid tumors and could be applied together with PET increasing the amount of information about the tissues of interest. The potential clinical benefit of applying PET/MR in staging, radiotherapy planning and treatment evaluation in oncology, as well as the research perspectives for the use of PET/MR in the development of new tracers and drugs will be discussed.
Keywords: PET/MR, oncology, diagnosis, staging, therapy evaluation, radiotherapy planning, molecular imaging
Introduction
The first combined whole body PET/MR scanner was launched in Munich, Germany in the Autumn 2010. A scanner combining Positron Emission Tomography (PET) and Magnetic Resonance Imaging (MRI) has been an aim and the development an ongoing process for more than 20 years [1]. At present there are three PET/MR models on the market (Table 1): Ingenuity TF (Philips), Discovery PET/CT+MRI (GE Healthcare) and the Biograph mMR (Siemens, Figure 1); the two former performing sequential PET and MRI – well known from the PET/CT scanner, whereas Siemens mMR, or as we prefer to call it PET/MR, is a fully integrated hybrid scanner performing truly simultaneous acquisition of PET and MRI (Figure 1).
Table 1.
Current PET/MR systems
| PET/MR system | Biograph mMR (Siemens) | Ingenuity TF (Philips) | Discovery PET/CT 690 + MR 750 (GE) |
|---|---|---|---|
| PET-system | |||
| Crystal material | LSO | LYSO | LYSO |
| Crystal elements dimension | 4x4x20 mm3 | 4x4x22 mm3 | 4.7x6.3x25 mm3 |
| Photomultipliers | No, 4032 APDs | 420 | 1024 |
| Ring diameter | 65.6 cm | 90.3 cm | 88.6 cm |
| Transaxial FoV | 59.4 cm | 67.6 cm | 70 cm |
| Axial FoV | 25.8 cm | 18.0 cm | 15.7 cm |
| Energy window | 430-610 keV | 460-665 keV | 425-650 keV |
| Coincidence window | 5.9 ns | 6 ns | 4.9 ns |
| Time-of-flight | No | Yes | Yes |
| MR-system | |||
| Field strength | 3 Tesla | 3 Tesla | 3 Tesla |
| Bore diameter | 60 cm | 60 cm | 60 cm |
| Max FoV | 50x50x45 cm3 | 50x50x45 cm3 | 48x48x48 cm3 |
| Field homogeneity (40cm3) | 0.25 ppm | 0.5 ppm | 0.25 ppm |
| PET/MR | |||
| Acquisition | Simultaneous | Sequential (same room) | Sequential (2 separate rooms) |
| PET-attenuation corr. | MR-based | MR-based | CT-based |
Figure 1.
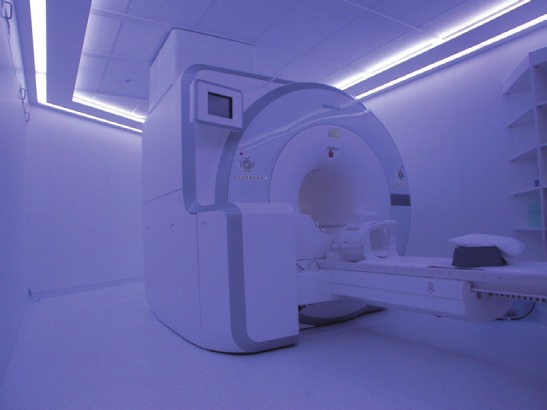
The Siemens mMR PET/MR scanner installed at Rigshospitalet in Copenhagen in December 2011.
The development of a combined PET/MR scanner enabling simultaneous acquisition of PET and MRI was a huge technical challenge as the PET detectors has to be placed inside the MR bore. Thus the PET detectors need to be able to function within a high static magnetic field as well as with quickly changing gradient fields and radio frequency signals from the MRI scanner. Similarly degrading of the MR image quality by inhomogeneities in the magnetic field and electromagnetic interference caused by the PET detector should be avoided. This challenge was addressed by replacing the traditional photomultiplier tubes in the PET detector with avalanche photo diodes (APD) [2], enabling PET detectors to be integrated between the MRI body coil and the gradient coils rendering truly simultaneous acquisition of PET and MRI possible. Recent studies have demonstrated that the performance of the APD based PET as in the Siemens mMR is fully comparable to, or perhaps even slightly more sensitive, than the PET/CT based on photomultiplier tubes [3].
Why do we need a PET/MR scanner?
For several decades PET has demonstrated its value in providing non-invasive information of tissue at the molecular level. Although the value of PET lies in its high sensitivity tracking of biomarkers in vivo, it lacks precise anatomical information. This problem was addressed with the introduction of the PET/CT scanners in 2001. The PET/CT scanner has since gained widespread use and has had an enormous impact on the staging and treatment of especially patients with cancer. However, introducing PET/MR, can, perhaps, approach some of the limitations applying to PET/CT as well as providing a new tool for molecular imaging.
1) During diagnostic work up and follow up schemes in patients with good prognosis, especially pediatric patients, the amount of ionizing radiation from repeated PET/CT scans is a matter of concern [4,5]. Due to the absence of ionizing radiation in MRI, PET/MR will reduce the dose associated with the examination substantially by eliminating the radiation dose from the CT, which generally accounts for approx. half of the dose associated with a PET/CT scan. This will be of especially importance in the handling of pediatric patients, but also adult cancer patients with a good prognosis, where the dose from repeated PET/CT scans can sum up to substantially amounts of ionizing radiation. Thus, in future scenarios the availability of PET/MR and an increased number of salvage therapies might render the clinicians more amenable to more frequent follow up with imaging.
2) CT provides excellent structural information, being a prerequisite for the widespread use of the PET technology. However, it has some limitations with regard to soft tissue and in areas with complex anatomy, i.e. the head and neck area and in the pelvis. MRI is widely used in the radiological imaging, as it provides excellent soft tissue differentiation, and in this aspect is considered superior to CT, allowing more precise radiographic measurements of tumor location, size and invasion. In addition to routine anatomical MR imaging a variety of MR acquisition sequences are available which can yield images of biophysical, pathophysiological or functional properties of tissues.
3) In PET/CT the duration of the CT scan is typically less than 1-2 minutes, whereas the PET scan lasts approx. 15-20 min from skull base to thighs. Thus, most of the time the CT scanner is not in use and PET acquisition governs the total scan time. With PET/MR both modalities acquire data simultaneously and total scanning time is normally governed by MR imaging, so that a longer PET acquisition time could be without time loss [6]. This could make it possible to reduce the dose from the PET tracer without hampering sensitivity.
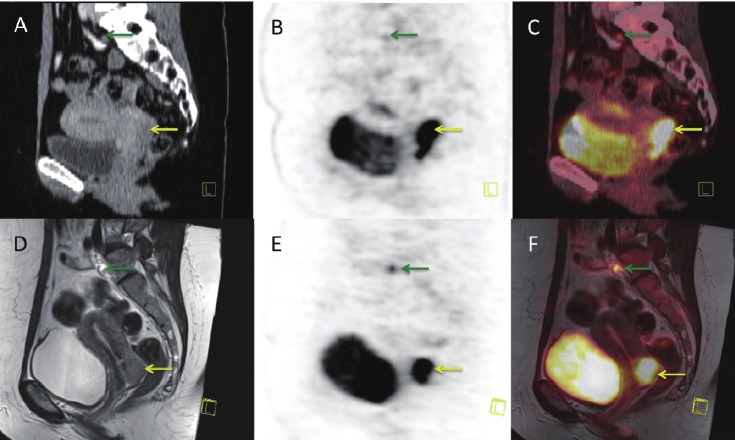
4) In the present PET/CT scanners CT and PET are acquired sequentially and not simultaneously. Sequential data acquisition and subsequent image fusion can hamper the possibility for accurate quantification and image interpretation due to misalignment. This is especially relevant in abdominal or thoracic studies, due to respiratory movements and bowel motion [7]. Furthermore simultaneous imaging will also make it possible to examine the patient in exactly identical metabolic state and condition (Figure 2). The sequential image acquisition also eliminates any temporal correlation between the two modalities, such as CT perfusion measurements and PET tracer kinetics.
Figure 2.
Sagittal PET/CT and PET/MR images of a patient with cervical cancer (yellow arrow) and one pathological pelvic lymph node (green arrow): A: CT-scan, B: FDG-PET scan performed on the PET/CT scanner, C: Fused PET/CT image –note the mismatch between the bladder on CT and PET due to the difference in uptake time, D: MR-scan, T2 weighted, E: PET scan acquired simultaneous with MR, F: fused PET/MR image –note the perfect fit with bladder on MR and PET.
5) Acquiring PET and MRI data simultaneously allows essentially perfect temporal correlation of acquired data sets from both modalities. Basically, MRI already provides a large variety of protocols which selectively enhance contrast and thus visual discrimination among different tissue in vivo, and which can be used for dynamic contrast enhanced imaging, diffusion weighted imaging, functional MRI (fMRI) etc. Therefore, the combination of PET with MRI provides many advantages, which go far beyond simply combining functional PET information with structural MRI information. Some of the challenges will be to adapt the MR protocols to the PET acquisition time for each bed position and choose the right combination of PET tracer and MR imaging protocols.
Currently, no clinical indication for PET/MR has been established. In this paper we will focus on potential applications for, primarily simultaneous, PET/MR in the field of research and in the treatment of patients with extra cerebral solid tumors. Methods and tracers for use with the PET technology will be familiar to most readers of this journal; thus we will in the following give a short introduction to a number of different, more functional MRI techniques, which have shown promising results in the treatment of patients with solid tumors and could be applied together with PET increasing the amount of information about the tissues of interest.
MRI–Different functional imaging techniques
Diffusion weighted MR Imaging (DW-MRI)
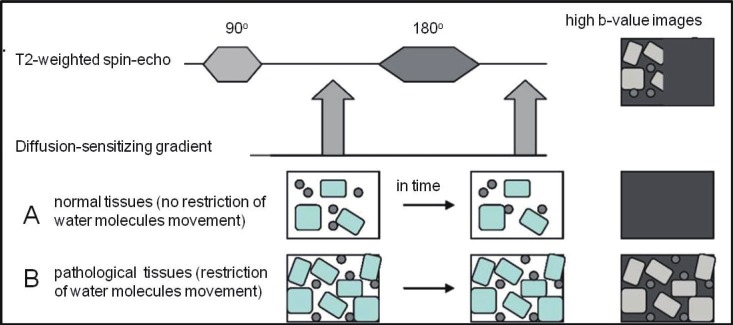
DW-MRI measures cell density and is based on diffusion of water molecules in tissues. Water movement would be completely random in a totally unrestricted environment, a phenomenon known as Brownian motion [8,9]. Within biologic tissues, water molecules are distributed among intravascular, intracellular and extracellular spaces, and their motion is impeded by interaction with tissue compartment, cell membranes and intracellular organelles. The more viable cells, the higher restriction of water diffusion. The Stejskal-Tanner approach of diffusion weighting imaging, which has become the basis of many DWI sequences in clinical use, apply two large symmetric diffusion sensitizing gradients around the 180° refocusing pulse in the standard T2 weighted Spin Echo sequence (Figure 3). The application of the first diffusion gradient will cause a temporary change in resonance frequencies, and will emerge as a dephasing of the transverse magnetization. Applying the same gradient for the same duration, but of opposite polarity, will result in rephasing of the transverse magnetization. For stationary water molecules there will be no significant change in the measured signal intensity. Moving water molecules, on the contrary, alter their spatial positions, so when they are affected by the second diffusion gradient, they perform an incomplete rephrasing of the transverse magnetization, which displays as a signal loss. With the development of stronger static magnetic fields, greater gradients, faster imaging sequences, multichannel coils, and recently introduced parallel imaging techniques, diffusion weighted MRI has been increasingly used in extra cerebral imaging.
Figure 3.
Illustration of the principle behind diffusion-weighted MRI: During diffusion-weighted MRI two symmetric diffusion-sensitizing gradients are applied (1, 2) around the 180° refocusing pulse in the standard T2-weighted spinecho sequence. After the first (1) diffusion gradient, resonance frequencies of effected tissues (in particular, water molecules) will be changed, so that dephasing of the transverse magnetization will happen. Re-applying the same gradient for the same duration but of opposite polarity (2), “rephasing” of the transverse magnetization will emerge for stationary water molecules and there will be no significant change in the measured signal intensity (B). This second (2) diffusion gradient will not influence moving water molecules (A) because they have altered their spatial positions, so that incomplete rephrasing of the transverse magnetization will happen, which is displayed as a signal loss.
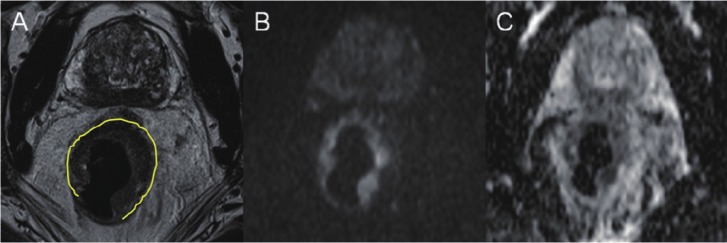
The sensitivity of the DWI sequence to water motion can be varied by changing the gradient amplitude, the duration of the applied gradient and the time interval between the diffusion gradients. The parameter proportional to these three factors is known as the b-value. The b-value is referred to as the strength of the diffusion sensitizing gradient [8,10]. At a b-value of 0 s/mm2 (no diffusion gradient) signal from the tissue mostly depends on T2 weighting, and therefore free water molecules have high signal intensity. B-values of 50-100 s/mm2 will result in signal loss of highly mobile water molecules. Water molecules with restricted movement (e.g. in highly cellular tissues) retain their signal even at high b-values (500-1000 s/mm2) [10,11]. Diffusion weighted imaging is performed with at least two b-values, including a b-value of 0-5 s/mm2 and a higher b-value of 500-1000 s/mm2 depending on the body region or organ being imaged [8-10]. By performing different b-values quantitative analysis is possible, which is calculated automatically and known as the ADC (Apparent Diffusion Coefficient). ADC can be displayed as a parametric map (Figure 4). Application of greater number of b-values improves the accuracy of ADC but increases the scanning time.
Figure 4.
MR including diffusion weighted imaging (DWI), performed in a patient with rectal adenocarcinoma: A: Axial T2 TSE image showing an almost circular tumor (marked with yellow) located in the mid-rectum with intermediate signal intensity, B: On a high b-value (1000 sec/mm2) DW image tumor is seen as a high-signal zone and on C: ADC-map the tumor displays as a low signal area consistent with high cellularity and impaired diffusion.
In extra cerebral imaging DWI has mainly been used for tumor assessment; in particular for tumor detection and characterization, monitoring and prediction of tumor treatment response. ADC seems to be a reliable predictor of tumor response to neoadjuvant therapy; and DW-MRI could be useful in the differentiation of residual viable tumor from diffuse fibrotic tissue [12,13].
As in all other existing modalities, false positive and false negative results do occur on DWI; with the most commonly occurring pitfalls being “T2 shine through” effect (delusions from slow flowing blood). Whereas DW-MRI measures cell density, FDG PET/CT measures cell metabolism – thus both modalities are prone to some of the same pitfalls hampering specificity, i.e. inflammation. Data comparing DW-MRI and FDG PET/CT are scarce. In a recent study comparing the performance of STIR (Short T1 Inversion Recovery) Turbo Spin Echo imaging, DW-MRI and FDG PET/CT in mediastinal staging of patients with lung cancer the specificity of both DW-MRI and FDG PET was hampered by the occurrence of inflammatory lymph nodes. However, only FDG PET was false positive in the presence of anthracosiliocis, whereas DW-MRI was false positive in the presence of lymphatic edemas and coagulation necrosis [14]. Exciting data derived from a rat glioma model examining the treatment associated inflammatory response by DW-MRI, and FDG PET suggests less profound effect of chemotherapy associated immunologic response on tumor diffusion compared to tumor FDG uptake after therapy [15]. PET/MR would be the method of choice for a more thorough assessment of the correlation and implications for response evaluation by DW-MRI and FDG PET before, during and after therapy.
Dynamic Contrast Enhanced MR Imaging (DCE-MRI)
Angiogenesis is the physiological process of new blood vessel growth and a major mechanism of tissue development and reparation. However, it is also a fundamental step in the transition of normal tissue to malignancy. Angiogenesis is usually assessed in terms of micro vessel density (MVD) [16], but can also be evaluated by contrast enhancement imaging, for example by DCE-MRI.
Essentially DCE-MRI provides tracking of intravenously injected low molecular weight contrast agents (CA), such as gadolinium-DTPA. DCE-MRI follows the CA through the vascular system to the tumor tissue, where it starts to leak from the tumor vasculature into the extra vascular space. Eventually, the CA will re-diffuse back into the vascular system and be eliminated through the urinary system [17]. The intensity and rate of enhancement is related to the vascular density within the region, whereas the rate of contrast wash-out correlates to the leakiness of the vasculature. Though some benign lesions and inflammatory changes could show intensive contrast enhancement, the leakage pattern is often different from that seen in malignant lesions. This enables differentiation between benign and malignant tumors by analyzing the pharmacokinetics of the contrast agent, albeit with some overlap [17,18].
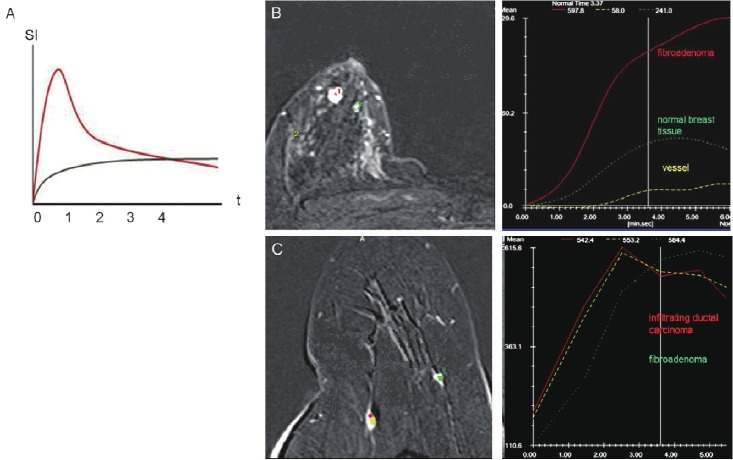
Analysis of DCE-MRI data is carried out in a series of distinct steps: Prior to an intravenous injection, a standard native T1 weighting imaging is performed, followed by post contrast serial imaging of the chosen region. After subtraction of native images from post contrast images and automatical assessment of temporal changes in contrast enhancement, the time intensity curves of ROIs (Regions Of Interest) or parametrical maps can be constructed (Figure 5) [18-21].
Figure 5.
A: Time-dependent contrast distribution is displayed as TICs (Time Intensity Curves). The graph shows a rapid accumulation and a rapid wash out of contrast agent in a vessel (red curve) and slow accumulation of contrast in the extracellular space (grey curve). The signal intensity on MR (SI) is illustrated on the y-axis and time in seconds (t) on the x-axis. Benign and malignant tissue can be differentiated by means of their TICs: DCE-MRI illustrating respectively (B) fibro adenoma of the breast – with medium fast contrast uptake and long accumulation time (no wash out) whereas infiltrating ductal carcinoma (C) of the breast shows a fast contrast uptake and rapid wash out. Pictures are presented with kind permission from Dr. M.S. Karpova.
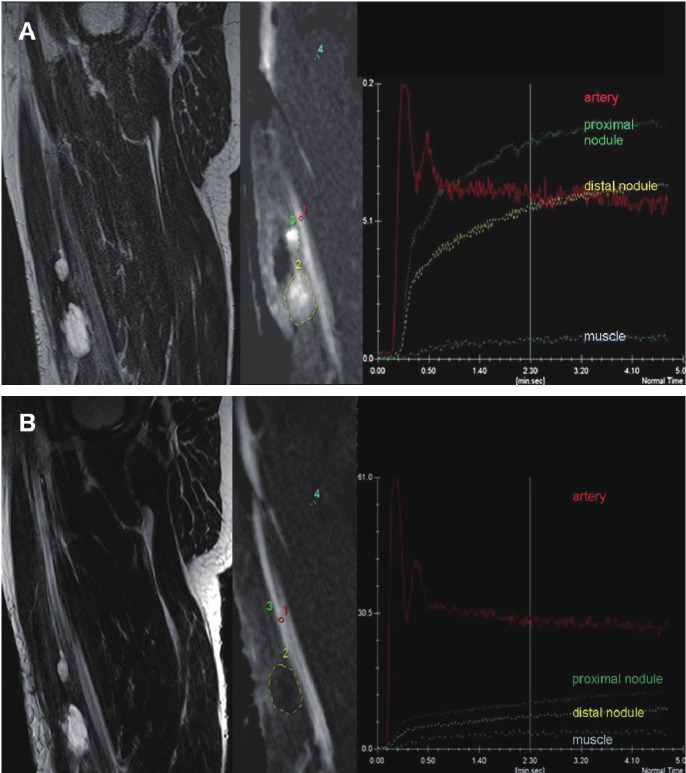
Usually chemo- and radiotherapy damage all blood vessels causing increased micro vascular permeability, due to endothelial cell damage and local inflammation. Thus DCE-MRI in the early post treatment period cannot always differentiate between treatment induced (benign) changes and recurrent disease. Nonetheless, DCE-MRI for early assessment of response to cancer drugs that inhibits new blood vessel formation (anti-angiogenic therapies) or disrupts existing blood vessels (vascular disrupting agents) seems promising (Figure 6) [20].
Figure 6.
Chemotherapy monitoring with dynamic contrast-enhanced (DCE) MRI: A patient with recurrent myxoid liposarcoma of the soft tissues in the right thigh before (A) and after (B) chemotherapy. A: Sagittal T2-weighted TSE image before treatment showing two nodules (marked with green and yellow) with predominantly high signal intensity. DCE with selected regions of interest (ROI) acquired 3 sec. after arrival of the bolus of contrast medium in the artery shows early diffuse enhancement of the tumor nodules, as further quantified in the Time Intensity Curves (TIC). After therapy (B) sagittal T2-weighted TSE image shows stable disease (less than 30% decrease size). DCE image and TICs show delayed onset of enhancement in both tumors relative to the artery and to the pre-therapy examination and an overall decrease in tumor contrast-enhancement, indicating decreased vascularization, perfusion and capillary permeability. Later histological analysis confirmed the result of DCE-MRI; good response with <15% residual viable tumor cells.
Blood Oxygenation Level Dependent MR Imaging (BOLD-MRI)
The BOLD-MRI technique was originally developed for functional brain studies, where the altered deoxy/oxyhemoglobin ratio during brain activity leads to a signal [22]. The use of BOLD-MRI for extra cerebral tumor imaging is still experimental, but BOLD-MRI may provide information of red blood cell delivery to the tumor, as well as on oxygenation of blood and surrounding tissues. These factors are important in tumor aggressiveness and viability determination and could be used in therapy planning and evaluation.
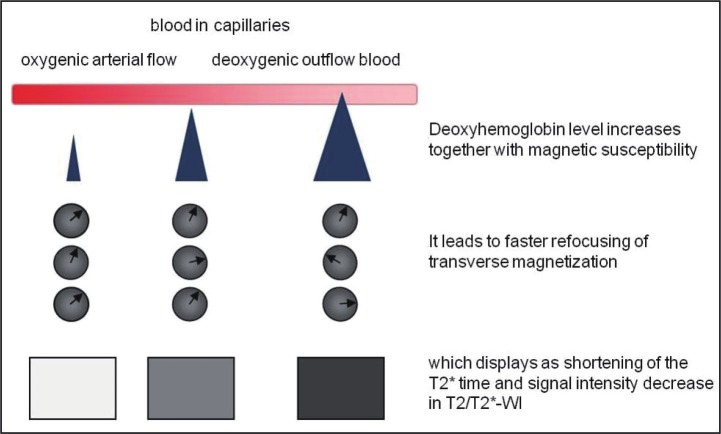
Tumor hypoxia has been shown to correlate with tumor invasiveness. Recent studies have demonstrated the feasibility of BOLD-MRI for assessing tumor hypoxia [23-25]. By means of BOLD-MRI hypoxia can be assessed without the use of intravenous contrast agents. BOLD-MRI can assess hypoxia by revealing differences between the diamagnetic oxyhemoglobin (O2Hb) and the paramagnetic deoxyhemoglobin (dHb). Deoxyhemoglobin increases the transverse relaxation time (R*), so that refocusing of transverse magnetization is accelerated. This accelerated refocusing displays as a decrease in signal intensity on T2–weighted images. The presence of deoxyhemoglobin in capillaries causes an increased magnetic susceptibility in the blood compared to surrounding tissue, and shortens the T2* of the blood, and its surroundings. Increasing oxygenation will result in decreased deoxyhemoglobin in the blood, increasing the T2* of the blood and reducing the difference in between tissue and blood, and vice versa (Figure 7) [22].
Figure 7.
Illustration of the principle behind blood oxygenation level dependent MR-imaging (BOLD-MRI). The increase of the magnetic susceptibility difference between vessels and surrounding tissues leads to faster refocusing of the transverse magnetization in these regions and emerges as signal intensity loss on T2/T2*- weighted images.
Using BOLD-MRI for measurement of hypoxia in extra cerebral tumors has been challenged by the relatively small differences observed in the deoxy/oxyhemoglobin ratio. In order to induce larger differences, inhalation of 100% oxygen or carbogen (95% oxygen, 5% CO2) has been attempted. But especially the latter is technically demanding and often associated with patient discomfort [22,25]. Another potential drawback of the technique is the occurrence of susceptibility artifacts, especially in the chest and abdomen [22].
MR Spectroscopy (MRS)
MRS can be used to monitor metabolic processes and products. It is possible by means of MRS to detect organ specific abnormalities and pathologies by quantifying concentrations or ratios of specific metabolites. In clinical practice spectroscopy means proton spectroscopy, measuring the resonance of protons in metabolites and water. In principle other atoms, e.g. Phosphor or Fluor, could be used for spectroscopy, but since the resonance frequency is very different from that of the protons, expensive broadband RF amplifiers, or a special RF amplifier for each atom, is required, which typically is not available in the clinic.
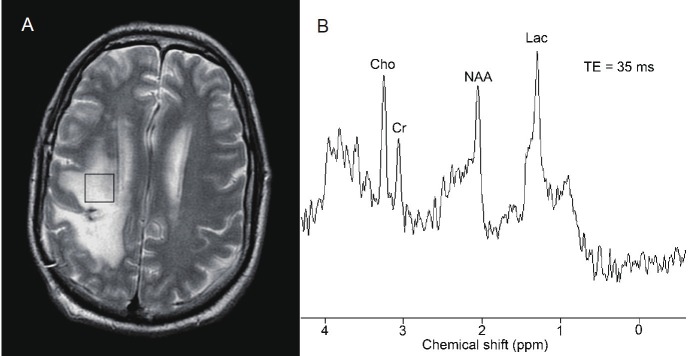
MRS exploits the chemical shifts observed in the signals. These chemical shifts results from slightly different internal magnetic fields of different molecules, caused by differences in the electron density shielding the molecule. The chemical shift is small and therefore measured in the unit parts per million (ppm) or sometimes in Hz. The resonance frequency itself is measured in MHz. In proton MRS the resonance frequency is typically 125 MHz for a 3 T scanner. Because of the high content of water (the water concentration is approx. 10,000 times higher than that of the metabolites), the water needs to be suppressed during acquisition. This is typically done by a narrow banded excitation pulse followed by dephasing with gradients. Because the changes in frequency are so small it is very important to obtain a homogeneous magnetic field. This can be a problem for large and heterogeneous volumes of interest. With proton MRS the following metabolites can be measured [26]: N-acetyl-aspartate (NAA, main peak at 2.02 ppm), sum of creatine and phosphocreatine (main peak at 3.04 and 3.92 ppm), choline (main peak at 3.24 ppm), lactate (main peak at 1.33 ppm), myoinositol, glutamate and glutamine and lipids (broad peaks at 1.3 and 0.9 ppm) and other substances such as citrate (main peak at 2.63 ppm) [26-28]. In Figure 8 an example of a brain spectrum of a healthy subject is shown [29]. Two different spectroscopy sequences, respectively STEAM (Stimulated Echo Acquisition Mode) and PRESS (Point Resolved Spectroscopy) are applied [30], The important difference, however, is the difference in echo time. In Figure 9 the short echo time spectrum of a treated patient with a history of anaplastic astrocytoma is shown. With MRS it is possible to distinguish radiation necrosis from recurrent tumor [29].
Figure 8.
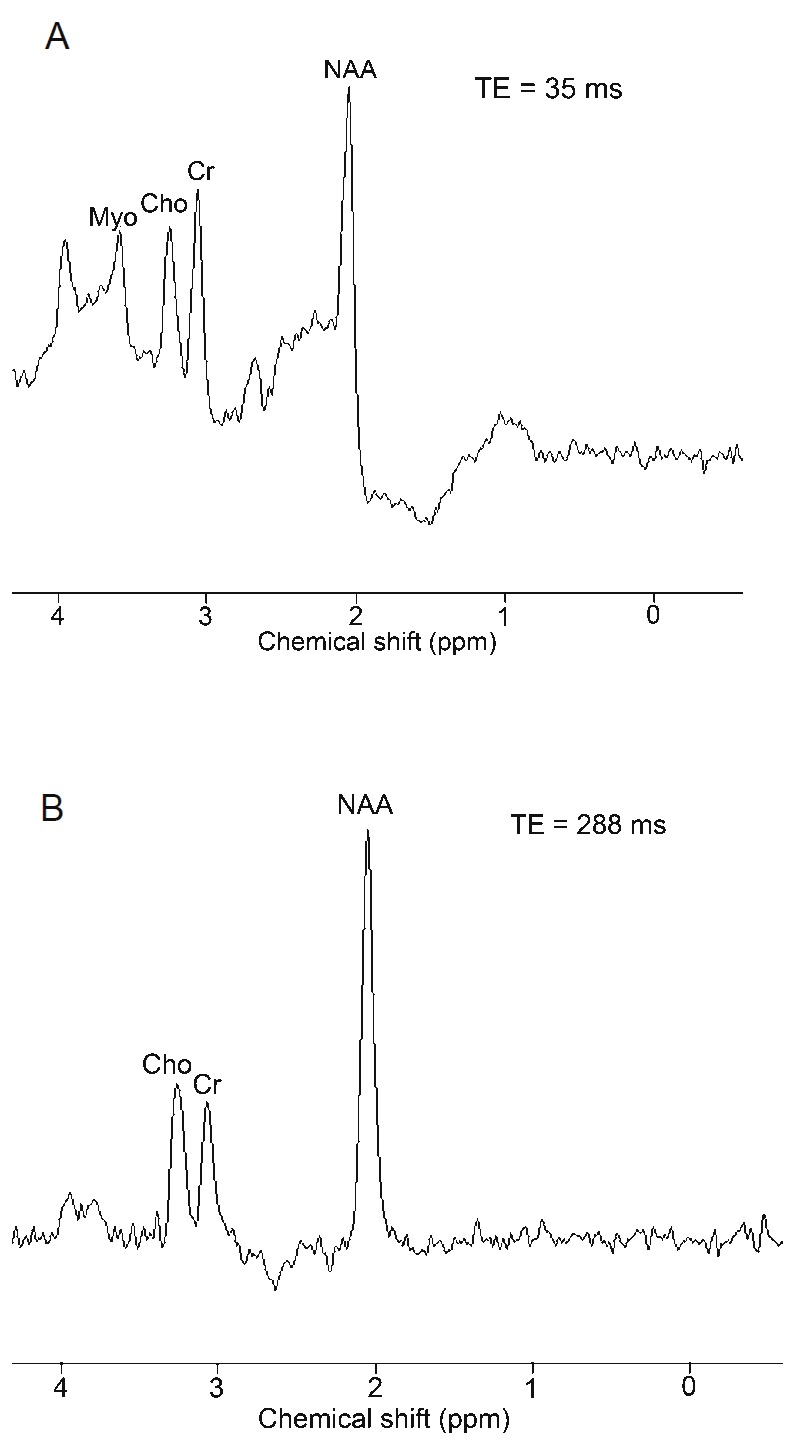
Proton magnetic resonance spectroscopy in a normal patient A: Stimulated echo acquisition mode technique with short echo delay (35 ms) demonstrates normal choline (Cho), creatine (Cr), N-acetyl aspartate (NAA), and myoinositol (Myo) peaks. B: Point resolved spectroscopy (PRESS) technique with a long echo delay (288 ms) in the same location demonstrates only choline, creatine, and NAA peaks. Due to the long echo time, the myoinositol peak is not seen with PRESS.
Figure 9.
Proton magnetic resonance spectroscopy used to distinguish radiation necrosis from recurrent tumor. A: Localization of a voxel in a patient with a history of anaplastic astrocytoma treated with surgery and radiation. Most of the area within the voxel demonstrated contrast enhancement on postgadolinium T1-weighted magnetic resonance imaging. B: An elevation of the choline (Cho) peak relative to the creatine (Cr) and N-acetyl aspartate (NAA) peaks and the presence of lactate (Lac) are consistent with recurrent tumor.In an area of radiation necrosis, the peaks of Cho, Cr, and NAA would be markedly reduced. Used with kind permission from the Barrow Neurological Institute.
Since the signal-to-noise ratio is low, the spatial resolution of MRS is lower than the resolution of anatomical MR. There are principally two ways of obtaining spatial information in MRS. The first is called localized or single voxel spectroscopy (SVS), in which the spectrum of one or more predefined volumes, typically of a few mL, can be acquired. The volume can be placed in the area of interest, but cannot be changed after acquisition. The other way is MR spectroscopic imaging (MRSI), where imaging and spectroscopy is combined, resulting in a spectrum in each acquired voxel (typical size 1-1.5 cm3). The advantage of MRSI is, that it allows better coverage of one large lesion or multiple lesions and a higher spatial resolution than SVS. This is needed for the investigation of regional variations within a VOI. Finally, MRSI enables obtaining of volume specific spectra after acquisition by combining voxels.
Being a fairly complicated technique proton MRS has no clinical indication at present in extra cerebral solid tumors. However, both high levels of citrate and choline, as measured by MRS, has shown promise as markers of malignancy in prostate cancer [27,31] and breast cancer [28] as well as in intra cerebral tumors [32,33]. How these MRS markers compare to PET tracers as 11C-Choline and 18F-FDG, or how lactate MRS compares to PET hypoxia tracers, is unknown and could be areas for future PET/MR studies.
Motion compensation and correction techniques
Patient motion produces artifacts, due to tissue displacement during and between excitation and data acquisition, leading to blurred images on both PET and MRI. It is crucially important to minimize the negative effects from motion in order to get more precise information, especially when acquiring simultaneous dual modality imaging. In PET imaging, as well as in MRI, the acquisition time is relatively long, and the patient respiratory movements will inevitable cause blurring of lesions in the lung and upper abdomen. In PET imaging this blurring may result in an overestimation of the size of the lesion, as well as an underestimation of the lesion SUV (standardized uptake value) [34]. In PET/CT the difference in acquisition time between PET and CT can result in misalignment and mislocalization. Several methods have been explored in order to minimize these problems by respiratory gating of PET (and CT). These methods mostly depends on external markers or sensors, and longer acquisition time, making it difficult to implement in daily clinical routine [35,36]. Recently a marker less structured light 3D surface tracking system has been developed for motion correction in brain studies [37]. The system is independent of external markers on the patient, and designed to fit into narrow spaces, making it highly promising for PET/MR imaging.
With regard to MRI, there are several variants to reduce motion artifacts, some of them independent of external markers. The navigator technique is most frequently used. By means of the navigator technique it is possible to monitor and compensate motion. The navigator technique measures with an additional quick MR prepulse the position, of e.g. the diaphragm before data collecting. Similar, the respiratory phase of the patient can be identified and used to synchronize image data acquisition, so that respiration induced image blurring is minimized by either respiratory ordered phase encoding or respiratory gating. After initial data acquisition, the position of the interface is automatically recorded, and imaging data are only accepted when the position of the interface falls within a range of pre-specified values.
Simultaneous PET/MR with motion correction has the potential to improve PET quantification in especially tumors of the lung and liver [38], which again will impact both diagnosing, radiotherapy planning and evaluation.
Potential applications in oncology
Staging
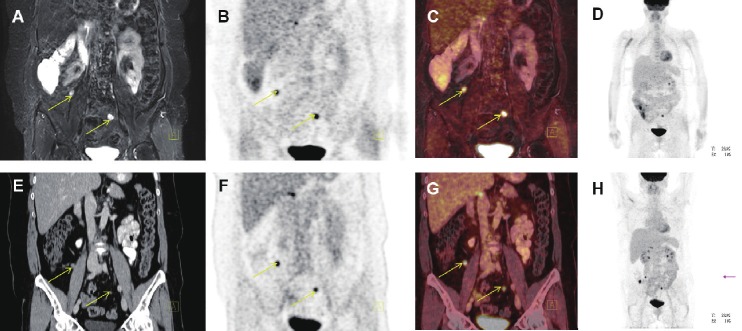
Staging assessing the anatomical spread and invasion of a malignant tumor is pivotal in guiding the choice of treatment and estimating patient prognosis (Figure 10). By combining anatomical MRI, DW-MRI and PET imaging, to obtain concerted information about cellularity and biological activity of the tumor (i.e. by use of FDG, FLT or Choline), we hypothesize that the sensitivity and specificity in oncology staging, can be improved. For example: 1) The assessment of tumor invasion into adjacent structures can probably be improved by the combination of MRI anatomy, DW-MRI (diffusion anisotropy) and PET, for example in rectal, bladder, prostate and gynecological cancers [39,40]. 2) Improved accuracy in the assessment of spread to regional lymph nodes, especially in the pelvic region [39,40], but also in the mediastinum and head-and-neck region [14,41,42]. Whether these potential improvements in “traditional” staging will be of clinical significance compared to state of the art PET/CT, is uncertain, but despite the increasing use of PET/CT in the field of oncology, validated methods to reliably discriminate between different subtypes of cancer and even between malignant and inflammatory findings, are still lacking. It is thus hypothesized that combined PET/MR will enable a more thorough biological characterization of primary tumor and eventually metastases.
Figure 10.
Coronal PET/MR and PET/CT images showing peritoneal carcinomatosis of a patient with relapse after surgery and chemotherapy for ovarian cancer (yellow arrows). A: T2-weighted STIR MR image, B: FDG-PET from the PET/MR scanner app. 120 min post-injection, C: Fused PET and MR from the PET/MR scanner, D: MIP PET from the PET/MR scanner, E: coronal CT image, F: FDG-PET from the PET/CT scanner (app. 60 min post-injection), G: Fused PET and CT from the PET/CT scanner and H: MIP PET form the PET/CT scanner.
As the number of targeted therapy options is increasing, traditional staging cannot standalone and the search for more specific and predictive biomarkers has been intensified. These biomarkers should not only predict prognosis, but more important enable the clinician to predict a patient’s response to a specific drug. In order to reach the full potential of “personalized medicine” such specific predictive markers, whether in blood, tissue or as an imaging method, are a prerequisite. An increasing number of predictive tissue markers has been identified and are used routinely in the treatment of for instance colorectal cancer (KRAS), nonsmall cell lung cancer (EGFR, EML4-ALK) and breast cancer (estrogen receptor status).
Investigations for these markers are often costly, time consuming, potentially delaying initiation of treatment, and requires a suitable tissue biopsy [43,44]. Especially the latter may prove to be the Achilles’ heel of “personalized medicine”: A single tumor biopsy is commonly used to portray the tumor’s mutational and receptor profile, but, recent studies have demonstrated substantially heterogeneity both within tumor and between primary tumor and metastases [45]. Thus hopes for molecular imaging, enabling fast whole body assessment of tumor and metastases without invasive procedures, are high.
Radiotherapy
A fundamental challenge in modern radiotherapy is to balance the prescribed radiation dose between the wish for tumor control and the fear of tissue toxicity. A possible way to increase tumor control, without increasing toxicity, is the dose painting principle [46]. Dose painting relies, in short, on three assumptions: 1) Local recurrences after radiotherapy arise from small areas of the tumor, which are relatively resistant to radiotherapy. 2) This inhomogeneous distribution of radio sensitivity can be mapped by molecular imaging. 3) It is possible to plan and deliver a dose distribution to the tumor, which results in higher doses to the more resistant areas.
The problem of decreased sensitivity to radiotherapy has been addressed in several studies, i.e. on head-and-neck cancer, increasing the applied dose to areas of the tumor with hypoxia demonstrated by 18F-MISO-PET. Thorwarth et al demonstrated that it was feasible to increase tumor control by means of dose painting by numbers according to a dose escalation map calculated from a dynamic 18F-MISO-PET scan [47]. However, subsequent studies have questioned the reproducibility of 18F-MISO-PET [48]. Tumor hypoxia is a key mechanism leading to radiotherapy resistance and a technique for hypoxia mapping to be integrated with radiotherapy planning systems is warranted [46]. Tumor hypoxia can be categorized into three causative types [49]: 1) Acute or perfusion related hypoxia resulting from inadequate tumor blood flow. 2) Chronic or diffusion related hypoxia caused by increased oxygen diffusion distance as a consequence of tumor expansion. 3) Anemic hypoxia caused by reduced oxygen carrying capacity of the blood. The distribution of hypoxia, even within the same tumor, is heterogeneous, and it has been demonstrated that hypoxia (pO2<10 mmHg) is associated with poor local tumor control and survival [49].
PET based techniques using 64Cu-ATSM, 18F-MISO or 18F-FAZA can image hypoxia by binding to intracellular macromolecules when pO2<10 mmHg. Accumulation of 18F-MISO is less flow-dependent, and local oxygen tension is the major determinant of its accumulation [49], enabling imaging of perfusion, diffusion and anemic hypoxia. In contrast BOLD-MRI is thought to be most sensitive to perfusion related hypoxia and thus often correlated with DCE-MRI in order to assess vascularity and perfusion.
By simultaneous PET/MR it will be possible to describe tissue hypoxia by PET hypoxia tracer together with BOLD and/or DCE-MRI to distinguish between perfusion and diffusion as the most dominant cause of tumor hypoxia. This again might be correlated to prognosis and influence treatment planning; Poor perfusion to the tumor area will hamper reoxygenation and thus the effect of radiotherapy. Simultaneous imaging of hypoxia by PET and MRI might also help to address one of the serious drawbacks of hypoxia imaging, namely the only moderate reproducibility of intra tumoral distribution of PET hypoxia tracer between two time points [48]. Alternatively, simultaneous FDG or FLT-PET and BOLD or DCE-MRI may result in new knowledge on the relationship between hypoxia, metabolism, proliferation and radiotherapy resistance [48,50], paving the way for molecular imaging based dose painting.
Response evaluation
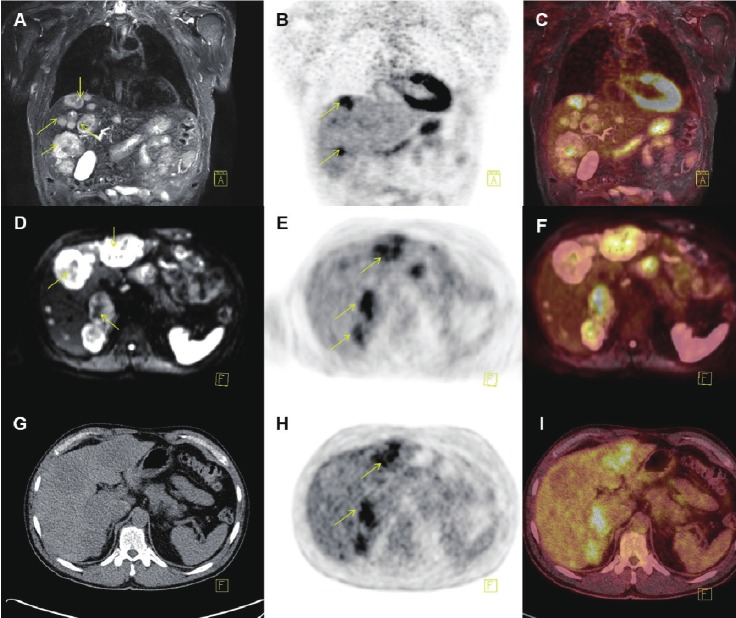
Accurate assessment of tumor response is essential in clinical patient management as well as in drug development. Currently response is mainly evaluated by anatomical measures based on a single linear summation of selected target lesions, known as the RECIST criteria (Response Evaluation Criteria In Solid Tumors) [51]. The standardized RECIST criteria take into account differences in slice thickness, minimum tumor sizes, and frequency of evaluations. However, there is a growing concern that response measurements may not be adequately addressed by RECIST, neither when the patient is treated with conventional cytoxic therapy [52], nor when treated with more recently developed molecularly targeted agents, which can provide therapeutically benefice without significantly reducing the tumor volume [53]. The use of PET/CT, combining metabolic and anatomical information for therapy evaluation, has a huge potential impact on the quality of patient treatment as well as on the evaluation of new therapy regimes [54]. Standardized criteria for response evaluation in solid tumors by PET/CT – PERCIST – was suggested in 2009 [55], and the impact of PET in response evaluation in e.g. lymphoma, is well established [56]. In parallel with the increasing amount of evidence on FDG-PET as a surrogate marker for response, similar results have emerged for DW-MRI from a broad range of cancer types [10,57,58], suggesting that early changes in tumor diffusion values correlate with response to therapy (Figure 11). However, both FDG-PET and DW-MRI suffers the very same drawbacks, i.e. lack of specificity in separating malignancy from inflammation. Some of the few comparative studies suggest that the cause for false positive findings might differ slightly between the two methods, opening a window of opportunity for simultaneous PET/MR to explore more specific changes in the tissue [2,15,59-61], making early therapy evaluation a safer endeavor.
Figure 11.
PET/MR (A-F) and PET/CT (G-I) images of a patient with multiple liver metastases (yellow arrows) from a neuroendocrine tumor located in the rectum: A: Coronal T2 weighted STIR MR, B+E: FDG-PET and C: fused PET/MR illustrating several metastases to the liver, but only some of them PET positive. D-F: Transaxial DWI MRI and FDG-PET illustrating some but not complete overlap between metastases with high signal intensity on DWI MRI and FDG-PET. Finally G-I: illustrates transaxial CT and PET from the PET/CT scanner, with hardly any metastases being visible on the liver on CT-images (not contrast enhanced).
Conclusion and perspectives
PET/MR is a new technology with great potential and several inherent challenges. Accurate attenuation and scatter correction is needed as a prerequisite for realizing the quantitative potential of the PET technology. Currently attenuation correction of the PET signal in the PET/MR scanner is performed, using an attenuation map based on a 2 point Dixon MRI sequence. The Dixon sequence allows differentiation of four different kinds of tissues: soft tissue (including water), fat, lung and background (air), but not bone. Especially the latter causes some problems and improving MRI based attenuation correction is “work in progress” [62,63]. With regard to the potential benefit of PET/MR for radiotherapy planning a number of practical issues needs to be solved: specific MR coils need to be developed as well as a flat table top for the PET/MR scanner, and the fixation equipment needs to be MR compatible, preferably without hampering the PET attenuation correction.
PET/MR will demand interdisciplinary training and a truly multidisciplinary set up involving physicians, physicists and technologists from both the field of nuclear medicine and PET as well as MR imaging and radiation therapy. A successful implementation of this expensive but promising technique also needs acceleration by close cooperation between centers working with PET/MR. To that end standardization and joint protocols should be encouraged, but proper phantoms for cross validation (PET/MR vs. PET/CT) are lacking.
Meeting these challenges, PET/MR will, like PET/CT, improve diagnostic power in several clinical scenarios, but the main indication for PET/MR in oncology remains to be defined. PET/CT still is an excellent application, and on a long term basis it will probably outperform PET/MR in many situations, for example in whole body staging of the majority of adult cancers [64,65]. Thus, with PET/MR improved diagnostic confidence should not be our primary aim. Instead, we need to follow the path of oncology towards personalized medicine, using tailor-made, multimodality, imaging leading to more individualized treatment and a better understanding of tumor biology.
PET/MR has the potential to substantially increase our knowledge in vivo of cancer pathophysiology. In preclinical research PET/MR can become the translational methodology enabling cross validation of new tracers against MRI sequences and vice versa.
With PET/MR it might also finally be possible, in the future, to gather the information necessary to perform radiotherapy with dose painting and to establish truly predictive imaging markers.
The clinical experience with PET/MR so far is scarce, but many smaller series are likely to be published in the near future [66]. However, the final clinical use of PET/MR in oncology will depend on the outcome of future prospective clinical studies, including robust cost-effectiveness calculations, leading the way to evidence based recommendations and reimbursement.
Acknowledgements
The authors gratefully appreciate the contribution from Dr. M. S. Karpova who provided the pictures for figure 5 and Medical Secretary Vibeke Rønn who kindly helped with proofreading of the manuscript.
Conflict of interest statement
The authors declare no conflict of interest.
References
- 1.Wehrl HF, Sauter AW, Judenhofer MS, Pichler B. Combined PET/MR imaging--technology and applications. Tech Canc Res Treat. 2010;9:5–20. doi: 10.1177/153303461000900102. [DOI] [PubMed] [Google Scholar]
- 2.Schiepers C, Dahlbom M. Molecular imaging in oncology: the acceptance of PET/CT and the emergence of MR/PET imaging. Eur Radiol. 2011;21:548–554. doi: 10.1007/s00330-010-2033-y. [DOI] [PMC free article] [PubMed] [Google Scholar]
- 3.Delso G, Fürst S, Jakoby B, Ladebeck R, Ganter C, Nekolla SG, Schwaiger M, Ziegler SI. Performance measurements of the Siemens mMR integrated whole-body PET/MR scanner. J Nucl Med. 2011;52:1914–1922. doi: 10.2967/jnumed.111.092726. [DOI] [PubMed] [Google Scholar]
- 4.Pearce MS, Salotti JA, Little MP, McHugh K, Lee C, Kim KP, Howe NL, Ronckers CM, Rajaraman P, Craft AW, Parker L, Berrington de González A. Radiation exposure from CT scans in childhood and subsequent risk of leukaemia and brain tumours: a retrospective cohort study. Lancet. 2012;380:499–505. doi: 10.1016/S0140-6736(12)60815-0. [DOI] [PMC free article] [PubMed] [Google Scholar]
- 5.Zhang D, Chawla S, Nagata K. Estimated cumulative effective dose from PET/CT in pediatric patients with malignancies. Med Phys. 2008;35:2958. [Google Scholar]
- 6.Boss A, Stegger L, Bisdas S, Kolb A, Schwenzer N, Pfister M, Claussen C, Pichler BJ, Pfannenberg C. Feasibility of simultaneous PET/MR imaging in the head and upper neck area. Eur Radiol. 2011;21:1439–1446. doi: 10.1007/s00330-011-2072-z. [DOI] [PubMed] [Google Scholar]
- 7.Mawlawi O, Townsend DW. Multimodality imaging: an update on PET/CT technology. Eur J Nucl Med Mol Imaging. 2009;36:S15–S19. doi: 10.1007/s00259-008-1016-6. [DOI] [PubMed] [Google Scholar]
- 8.Kwee TC, Takahara T, Ochiai R, Nievelstein RA, Luijten PR. Diffusion-weighted whole-body imaging with background body signal suppression (DWIBS): Features and potential application. Eur Radiol. 2008;18:1937–1952. doi: 10.1007/s00330-008-0968-z. [DOI] [PMC free article] [PubMed] [Google Scholar]
- 9.Oayyum A. Diffusion-weighted imaging in the abdomen and pelvis: concepts and applications. RadioGraphics. 2009;29:1797–1810. doi: 10.1148/rg.296095521. [DOI] [PMC free article] [PubMed] [Google Scholar]
- 10.Koh DM, Collins DJ. Diffusion-weighted MRI in the body: applications and challenges in oncology. Am J Roentgenol. 2007;188:1622–1635. doi: 10.2214/AJR.06.1403. [DOI] [PubMed] [Google Scholar]
- 11.Galbán CJ, Galbán S, van Dort ME, Luker GD, Bhojani MS, Rehemtulla A. Applications of molecular imaging. Prog Mol Biol Transl Sci. 2010;95:238–298. doi: 10.1016/B978-0-12-385071-3.00009-5. [DOI] [PMC free article] [PubMed] [Google Scholar]
- 12.Kim SH, Lee JM, Hong SH, Kim GH, Lee JY, Han JK, Choi BI. Locally advanced rectal cancer: added value of diffusion-weighted MR imaging in the evaluation of tumor response to neoadjuvant chemo- and radiation therapy. Radiology. 2009;253:116–125. doi: 10.1148/radiol.2532090027. [DOI] [PubMed] [Google Scholar]
- 13.Maretto I, Pomerri F, Pucciarelli S, Mescoli C, Belluco E, Burzi S, Rugge M, Muzzio PC, Nitti D. The potential of restaging in the prediction of pathologic response after preoperative chemoradiotherapy for rectal cancer. Ann Surg Oncol. 2007;14:455–461. doi: 10.1245/s10434-006-9269-4. [DOI] [PubMed] [Google Scholar]
- 14.Ohno Y, Koyama H, Yoshikawa T, Nishio M, Aoyama N, Orav EJ. N stage disease in patients with non-small cell lung cancer: Efficacy of quantitative and qualitative assessment with STIR Turbo Spin-Echo Imaging, diffusionweighted MR imaging and fluorodeoxyglucose PET/CT. Radiology. 2012;261:605–615. doi: 10.1148/radiol.11110281. [DOI] [PubMed] [Google Scholar]
- 15.Galbán CJ, Bhojani MS, Lee KC, Meyer CR, van Dort ME, Kuszpit KK, Koeppe RA, Ranga R, Moffat BA, Johnson TD, Chenevert TL, Rehemtulla A, Ross BD. Evaluation of Treatment-Associated Inflammatory Response on Diffusion-Weighted Magnetic Resonance Imaging and 2-[18F] -Fluoro-2-Deoxy-d-Glucose-Positron Emission Tomography Imaging Biomarkers. Clin Cancer Res. 2010;16:1542–1552. doi: 10.1158/1078-0432.CCR-08-1812. [DOI] [PMC free article] [PubMed] [Google Scholar]
- 16.Brasch RC, Li KC, Husband JE, Keogan MT, Neeman M, Padhani AR, Shames D, Turetschek K. In vivo monitoring of tumor angiogenesis with MR imaging. Acad Radiol. 2000;7:812–823. doi: 10.1016/s1076-6332(00)80630-3. [DOI] [PubMed] [Google Scholar]
- 17.Knopp MV, Giesel FL, Marcos H, Tengg-Kobligk H, Choyke P. Dynamic contrast-enhanced magnetic resonance imaging in oncology. Top Magn Reson Imag. 2001;4:301–308. doi: 10.1097/00002142-200108000-00006. [DOI] [PubMed] [Google Scholar]
- 18.Tuncbilek N, Kaplan M, Altaner S, Atakan IH, Süt N, Inci O, Demir MK. Value of dynamic contrast-enhanced MRI and correlation with tumor angiogenesis in bladder cancer. Am J Roentgenol. 2009;192:949–955. doi: 10.2214/AJR.08.1332. [DOI] [PubMed] [Google Scholar]
- 19.Yankeelov TE, Gore JC. Dynamic contrast enhanced magnetic resonance imaging in oncology: Theory, data acquisition, analysis and examples. Curr Med Imaging Rev. 2009;3:91–107. doi: 10.2174/157340507780619179. [DOI] [PMC free article] [PubMed] [Google Scholar]
- 20.Mross K, Fasol U, Frost A, Benkelmann R, Kuhlmann J, Büchert M, Unger C, Blum H, Hennig J, Milenkova TP, Tessier J, Krebs AD, Ryan AJ, Fischer R. DCE-MRI assessment of the effect of vandetanib on tumor vasculature in patients with advanced colorectal cancer and liver metastases: a randomized phase I study. J Angiogenesis Res. 2009;1:5. doi: 10.1186/2040-2384-1-5. [DOI] [PMC free article] [PubMed] [Google Scholar]
- 21.Jaovisidha S, Traiporndeeprasert P, Chitrapazt N, Thakkinstian A, Nartthanarung A, Subhadrabandhu T, Siriwongpairat P. Dynamic contrasted MR imaging in differentiation of recurrent malignant soft tissue tumor from posttreatment changes. J Med Assoc Thai. 2011;94:1127–1133. [PubMed] [Google Scholar]
- 22.Barrett T, Brechbiel M, Bernardo M, Choyke PL. MRI of tumor angiogenesis. J Magn Reson Imaging. 2007;26:235–249. doi: 10.1002/jmri.20991. [DOI] [PubMed] [Google Scholar]
- 23.Naik M, Mannelli L, Chandarana H, Lee V, Taouli B. Hepatocellular carcinoma: assessment of tumor oxygenation with BOLD MRI. Proc Intl Soc Mag Reson Med. 2008;16:3741. [Google Scholar]
- 24.Chopra S, Foltz WD, Milosevic MF, Toi A, Bristow RG, Ménard C, Haider MA. Comparing oxygen-sensitive MRI (BOLD R2*) with oxygen electrode measurements: A pilot study in men with prostate cancer. Int J Radiat Biol. 2009;85:805–813. doi: 10.1080/09553000903043059. [DOI] [PubMed] [Google Scholar]
- 25.Rijpkema M, Kaanders JHAM, Joosten FBM, van der Kogel AJ, Heerschap A. Effects of breathing a hyperoxic hypercapnic gas mixture on blood oxygenation and vascularity of headand-neck tumors as measured by magnetic resonance imaging. Int J Radiat Oncol Biol Phys. 2002;53:1185–1191. doi: 10.1016/s0360-3016(02)02825-0. [DOI] [PubMed] [Google Scholar]
- 26.Danielsen ER, Ross B. Magnetic Resonance Spectroscopy Diagnosis of Neurological Diseases. 1999. [Google Scholar]
- 27.Heerschap A, Jager GJ, van der Graff M, Barentsz JO, de la Rosette JJ, Oosterhof GO, Ruijter ET, Ruijs SH. In vivo proton MR spectroscopy reveals altered metabolite content in malignant prostate tissue. Anticancer Res. 1997;17:1455–1460. [PubMed] [Google Scholar]
- 28.Sardanelli F, Fausto A, Di Leonardo G, de Nijs R, Vorbuchner M, Podo F. In vivo proton MR spectroscopy of the breast using the total choline peak integral as a marker of malignancy. Am J Roentgenol. 2009;192:1608–1617. doi: 10.2214/AJR.07.3521. [DOI] [PubMed] [Google Scholar]
- 29.Bohnert BJ, Karis JP. Current clinical applications of MR spectroscopy of the brain. Barrow Quarterly. 2000;16 [Google Scholar]
- 30.Kwock L. Localized MR spectroscopy: Basic principles. Neuroimaging Clin N Am. 1998;8:713–731. [PubMed] [Google Scholar]
- 31.Mueller-Lisse UG, Scherr MK. Proton MR spectroscopy of the prostate. Eur J Radiol. 2007;63:351–360. doi: 10.1016/j.ejrad.2007.06.024. [DOI] [PubMed] [Google Scholar]
- 32.Shah T, Jayasundar R, Singh VP, Sarkar C. In vivo MRS study of intraventricular tumors. J Magn Reson Imaging. 2011;34:1053–1059. doi: 10.1002/jmri.22711. [DOI] [PubMed] [Google Scholar]
- 33.Steffen-Smith EA, Venzon DJ, Bent RS, Hipp SJ, Warren KE. Single- and multivoxel proton spectroscopy in pediatric patients with diffuse intrinsic pontine glioma. Int J Radiat Oncol Biol Phys. 2012;84:774–9. doi: 10.1016/j.ijrobp.2012.01.032. [DOI] [PMC free article] [PubMed] [Google Scholar]
- 34.Werner MK, Parker JA, Kolodny GM, English JR, Palmer MR. Respiratory Gating Enhances Imaging of Pulmonary Nodules and Measurement of Tracer Uptake in FDG PET/CT. Am J Roentgenol. 2009;193:1640–1645. doi: 10.2214/AJR.09.2516. [DOI] [PubMed] [Google Scholar]
- 35.Nehmeh S, Erdi YE. Respiratory motion in positron emission tomography/computed tomography: A review. Semin Nucl Med. 2008;38:167–176. doi: 10.1053/j.semnuclmed.2008.01.002. [DOI] [PubMed] [Google Scholar]
- 36.Aznar M, Andersen F, Berthelsen AK, Josipovic M, Klausen TL, Loft A, Olsen M, Petersen PM, Specht L. Feasibility of breathing-adapted PET/CT imaging for radiation therapy of Hodgkin lymphoma. Cancer Imaging. 2011;Spec No A:S117. [Google Scholar]
- 37.Olesen OV, Paulsen RR, Højgaard L, Roed B, Larsen R. Motion tracking for medical imaging: A non-visible structured light tracking approach. IEEE T Med Imaging. 2012;31:79–87. doi: 10.1109/TMI.2011.2165157. [DOI] [PubMed] [Google Scholar]
- 38.Dikaios N, Izquierdo-Garcia D, Graves MJ, Mani V, Fayad ZA, Fryer TD. MRI-based motion correction of thoracic PET: initial comparison of acquisition protocols and correction strategies suitable for simultaneous PET/MRI systems. Eur Radiol. 2011 doi: 10.1007/s00330-011-2274-4. DOI 10.1007/s00330-011-2274-4. [DOI] [PMC free article] [PubMed] [Google Scholar]
- 39.Punwani S. Diffusion weighted imaging of female pelvis cancers: Concepts and clinical applications. Eur J Radiol. 2011;78:21–29. doi: 10.1016/j.ejrad.2010.07.028. [DOI] [PubMed] [Google Scholar]
- 40.Giannarini G, Petralia G, Thoeney HC. Potential and limitations of diffusion-weighted magnetic resonance imaging in kidney, prostate, and bladder cancer including pelvic lymph node staging: A critical analysis of the literature. Eur Urol. 2012;61:326–340. doi: 10.1016/j.eururo.2011.09.019. [DOI] [PubMed] [Google Scholar]
- 41.Hochhegger B, Marchiori E, Sedlaczek O, Irion K, Heussel CP, Ley S, Ley-Zaporozhan J, Soares Souza A Jr, Kauczor HU. MRI in lung cancer: a pictoral essay. Br J Radiol. 2011;84:661–668. doi: 10.1259/bjr/24661484. [DOI] [PMC free article] [PubMed] [Google Scholar]
- 42.Jansen JFA, Schöder H, Lee NY, Stambuk HE, Wang Y, Fury MG, Patel SG, Pfister DG, Shah JP, Koutcher JA, Shukla-Dave A. Tumor metabolism and perfusion in head and neck squamous cell carcinoma: pretreatment multimodality imaging with 1H magnetic resonance spectroscopy, dynamic contrast-enhanced MRI and [18F] FDG-PET. Int J Radiat Oncol Biol Phys. 2012;82:299–307. doi: 10.1016/j.ijrobp.2010.11.022. [DOI] [PMC free article] [PubMed] [Google Scholar]
- 43.Sequist LV, Heist RS, Shaw AT, Fidias P, Rosovsky R, Temel JS, Lennes IT, Digumarthy S, Waltman BA, Bast E, Tammireddy S, Morissey L, Muzikansky A, Goldberg SB, Gainor J, Channick CL, Wain JC, Gaissert H, Donahue DM, Muniappan A, Wright C, Willers H, Mathisen DJ, Choi NC, Baselga J, Lynch TJ, Ellisen LW, Mino-Kenudson M, Lanuti M, Borger DR, Iafrate AJ, Engelman JA, Dias-Santagata D. Implementing multiplexed genotyping of non-smallcell lung cancers into routine clinical practice. Ann Oncol. 2011;22:2616–2624. doi: 10.1093/annonc/mdr489. [DOI] [PMC free article] [PubMed] [Google Scholar]
- 44.Atherly AJ, Camidge DR. The cost-effectiveness of screening lung cancer patients for targeted drug sensitivity markers. Br J Cancer. 2012;60:1–7. doi: 10.1038/bjc.2012.60. doi:10. 1038/bjc. [DOI] [PMC free article] [PubMed] [Google Scholar]
- 45.Gerlinger M, Rowan AJ, Horswell S, Math M, Larkin J, Endesfelder D, Gronroos E, Martinez P, Matthews N, Stewart A, Tarpey P, Varela I, Phillimore B, Begum S, McDonald NQ, Butler A, Jones D, Raine K, Latimer C, Santos CR, Nohadani M, Eklund AC, Spencer-Dene B, Clark G, Pickering L, Stamp G, Gore M, Szallasi Z, Downward J, Futreal PA, Swanton C. Intratumor heterogeneity and branched evolution revealed by multiregion sequencing. N Engl J Med. 2012;366:883–892. doi: 10.1056/NEJMoa1113205. [DOI] [PMC free article] [PubMed] [Google Scholar]
- 46.Bentzen SM, Gregoire V. Molecular imaging-based dose-painting: a novel paradigm for radiation therapy prescription. Semin Radiat Oncol. 2011;21:101–110. doi: 10.1016/j.semradonc.2010.10.001. [DOI] [PMC free article] [PubMed] [Google Scholar]
- 47.Thorwarth D, Eschmann SM, Paulsen F, Alber M. Hypoxia dose painting by numbers: a planning study. Int J Radiat Oncol Biol Phys. 2007;68:291–300. doi: 10.1016/j.ijrobp.2006.11.061. [DOI] [PubMed] [Google Scholar]
- 48.Nehmeh SA, Lee NY, Schröder H, Squire OD, Zanzonizo PB, Erdi YE, Greco C, Mageras G, Pham HS, Larson SM, Ling CC, Humm JL. Reproducibility of intratumor distribution of 18F-fluoromisonidazole in head and neck cancer. Int J Radiat Oncol Biol Phys. 2008;70:235–242. doi: 10.1016/j.ijrobp.2007.08.036. [DOI] [PMC free article] [PubMed] [Google Scholar]
- 49.Padhani AR, Krohn KA, Lewis JS, Alber M. Imaging oxygenation of human tumours. Eur Radiol. 2007;17:861–872. doi: 10.1007/s00330-006-0431-y. [DOI] [PMC free article] [PubMed] [Google Scholar]
- 50.Dirix P, Vandecaveye V, De Keyzer F, Stroobants S, Hermans R, Nuyts S. Dose painting in radiotherapy for head and neck squamous cell carcinoma: value of repeated functional imaging with 18F-FDG PET, 18F-Fluoromisonidazole PET, diffusion-weighted MRI, and dynam contrast-enhance d MRI. J Nucl Med. 2009;50:1020–1027. doi: 10.2967/jnumed.109.062638. [DOI] [PubMed] [Google Scholar]
- 51.Therasse P, Arbuck SG, Eisenhauer EA, Wanders J, Kaplan RS, Rubinstein L, Verweij J, Van Glabbeke M, van Oosterom AT, Christian MC, Gwyther SG. New guidelines to evaluate the response to treatment in solid tumors. J Natl Cancer Inst. 2000;92:205–216. doi: 10.1093/jnci/92.3.205. [DOI] [PubMed] [Google Scholar]
- 52.Jaffe CC. Measurements of Response: RECIST, WHO, and new alternatives. J. Clin. Oncol. 2006;24:3245–3251. doi: 10.1200/JCO.2006.06.5599. [DOI] [PubMed] [Google Scholar]
- 53.Strumberg D. Preclinical and clinical development of the oral multikinase inhibitor sorafenib in cancer treatment. Drugs Today. 2005;41:773. doi: 10.1358/dot.2005.41.12.937959. [DOI] [PubMed] [Google Scholar]
- 54.Weber WA. Use of PET for monitoring cancer therapy and for predicting outcome. J Nucl Med. 2005;46:983–995. [PubMed] [Google Scholar]
- 55.Wahl RL, Jacene H, Kasamon Y, Lodge MA. From RECIST to PERCIST: Evolving Considerations for PET Response Criteria in Solid Tumors. J Nucl Med. 2009 Jan 5;50:122S–150. doi: 10.2967/jnumed.108.057307. [DOI] [PMC free article] [PubMed] [Google Scholar]
- 56.Hutchings M, Loft A, Hansen M, Pedersen LM, Buhl T, Jurlander J, Buus S, Keiding S, D’Amore F, Boesen AM, Berthelsen AK, Specht L. FDG-PET after two cycles of chemotherapy predicts treatment failure and progression-free survival in Hodgkin Lymphoma. Blood. 2006;107:52–59. doi: 10.1182/blood-2005-06-2252. [DOI] [PubMed] [Google Scholar]
- 57.Galbán S, Brisset JC, Rehemtulla A, Chenevert TL, Ross BD, Galbán CJ. Diffusion-weighted MRI for assessment of early cancer treatment response. Curr Pharm Biotechnol. 2010;11:701–708. doi: 10.2174/138920110792246627. [DOI] [PMC free article] [PubMed] [Google Scholar]
- 58.Heijmen L, Verstappen MC, Ter Voert EE, Punt CJ, Oyen WJ, de Geus-Oei LF, Hermans JJ, Heerschap A, van Laarhoven HW. Tumour response prediction by diffusion-weighted MRimaging: Ready for clinical use? Crit Rev Oncol Hematol. 2012 doi: 10.1016/j.critrevonc.2011.12.008. doi:10.1016/j.critrevonc.2011.12.008. [DOI] [PubMed] [Google Scholar]
- 59.Sauter AW, Wehrl HF, Kolb A, Judenhofer MS, Pichler B. Combined PET/MRI: one step further in multimodality imaging. T Mol Med. 2010;16:508–515. doi: 10.1016/j.molmed.2010.08.003. [DOI] [PubMed] [Google Scholar]
- 60.Boss A, Bisdas S, Kolb A, Hofmann M, Ernemann U, Claussen C, Pfannenberg C, Pichler B, Reimold M, Stegger L. Hybrid PET/MRI of Intracranial Masses: Initial Experiences and Comparison to PET/CT. J Nucl Med. 2010;51:1198–1205. doi: 10.2967/jnumed.110.074773. [DOI] [PubMed] [Google Scholar]
- 61.Sauter AW, Kolb A, Soekler M, Reimold M, Schwenzer N, Pfannenberg C, Claussen C, Pichler B, Horger M. Letter to the editor re: molecular imaging in oncology: the acceptance of PET/CT and the emergence of MR/PET imaging. Eur Radiol. 2011;5:1–4. doi: 10.1007/s00330-011-2096-4. [DOI] [PubMed] [Google Scholar]
- 62.Hofmann M, Bezrukov I, Mantlik F, Aschoff P, Steinke F, Beyer T, Pichler BJ, Schölkopf B. MRI-based attenuation correction for wholebody PET/MRI: quantitative evaluation of segmention- and atlas-based methods. J Nucl Med. 2011;52:1392–1399. doi: 10.2967/jnumed.110.078949. [DOI] [PubMed] [Google Scholar]
- 63.Eiber M, Martinez-Moeller A, Souvatzoglou M, Holzapfel K, Pickhard A, Löffelbein D, Santi I, Rummeny EJ, Ziegler S, Schwaiger M, Nekolla SG, Beer AJ. Value of Dixon-based MR/PET attenuation correction sequence for the localization and evaluation of PET-positive lesions. Eur J Nucl Med Mol Imaging. 2011;38:1691–1701. doi: 10.1007/s00259-011-1842-9. [DOI] [PubMed] [Google Scholar]
- 64.Fischer BM, Lassen U, Mortensen J, Larsen S, Loft A, Berthelsen AK, Ravn J, Clementsen P, Hogholm A, Larsen K, Rasmussen T, Keiding S, Dirksen A, Gerke O, Skov BG, Steffensen I, Hansen H, Vilmann P, Jacobsen G, Backer V, Maltbaek N, Pedersen J, Madsen H, Nielsen H, Hojgaard L. Preoperative Staging of Lung Cancer with Combined PET-CT. N Engl J Med. 2009;361:32–39. doi: 10.1056/NEJMoa0900043. [DOI] [PubMed] [Google Scholar]
- 65.Loft A, Berthelsen AK, Roed H, Ottosen C, Lundvall L, Knudsen J, Nedergaard L, Højgaard L, Engelholm SA. The diagnostic value of PET/CT scanning in patients with cervical cancer: a prospective study. Gynecol Oncol. 2007;106:29–34. doi: 10.1016/j.ygyno.2007.03.027. [DOI] [PubMed] [Google Scholar]
- 66.Drzezga A, Souvatzoglou M, Eiber M, Beer AJ, Fürst S, Martinez-Moeller A, Nekolla SG, Ziegler S, Ganter C, Rummeny EJ, Schwaiger M. First clinical experience with integrated wholebody PET/MR: Comparison to PET/CT in patients with oncologic diagnoses. J Nucl Med. 2012;53:845–855. doi: 10.2967/jnumed.111.098608. [DOI] [PubMed] [Google Scholar]


