Abstract
Prostate adenocarcinoma (CaP) patients are classified into low-, intermediate-, and high-risk groups that reflect relative survival categories. While there are accepted treatment regimens for low- and high-risk patients, intermediate-risk patients pose a clinical dilemma, as treatment outcomes are highly variable for these individuals. A better understanding of the factors that regulate the progression of CaP is required to delineate risk. For example, aberrant activation of the Hedgehog (Hh) pathway is implicated in CaP progression. Here, we identify the serine protease inhibitor protease nexin 1 (PN1) as a negative regulator of Hh signaling in prostate. Using human CaP cell lines and a mouse xenograft model of CaP, we demonstrate that PN1 regulates Hh signaling by decreasing protein levels of the Hh ligand Sonic (SHH) and its downstream effectors. Furthermore, we show that SHH expression enhanced tumor growth while overexpression of PN1 inhibited tumor growth and angiogenesis in mice. Finally, using comparative genome hybridization, we found that genetic alterations in Hh pathway genes correlated with worse clinical outcomes in intermediate-risk CaP patients, indicating the importance of this pathway in CaP.
Introduction
Prostate adenocarcinoma (CaP) is the second leading cause of male cancer death in the Western world (1). Various risk groups (low, intermediate, high, and metastatic) that reflect relative survival are categorized using histologic grade (Gleason score), clinical tumor nodal metastasis (TNM) stage (local extent and/or nodal/distant metastases), and the level of serum prostatic-specific antigen (PSA) (2). Low-risk CaP is usually indolent, and the majority of these patients are candidates for active surveillance protocols without therapy (3). High-risk CaP, although localized, has a higher probability of occult metastases and is therefore treated locally and systemically to improve chances for cure (2, 4). Patients with intermediate-risk CaPs pose a clinical dilemma, as their natural history, genetics, and treatment outcomes are highly variable (5, 6). Taken together, these features of CaP drive the need for greater understanding of the factors regulating its growth and progression and for better delineation of risk.
Activation of various factors during epithelial-mesenchymal transition (EMT), including EGFR, Hedgehog (Hh), Wnt/β-catenin, and Notch, may correlate with CaP progression, aggression, and treatment resistance (7). In particular, the Hh pathway is essential for the proliferation of numerous cell types and aids in the precise developmental patterning of many vertebrate systems, including the prostate (8). However, misregulation of the pathway has been implicated in the growth and metastasis of numerous tumorigenic cell types, including CaP (9–12). As a result, the mechanisms that control Hh signaling have been under intense scrutiny since its discovery in the early 1990s.
Hh pathway signaling is triggered by the binding of 1 of 3 ligands (Sonic [SHH], Indian [IHH], or Desert Hedgehog [DHH]) to the transmembrane protein PTCH1 (13). Interaction of the ligands with PTCH1 relieves downstream inhibition of Smoothened (SMO). triggering a cascade by which transcription factors GLI1 or GLI2 translocate to the nucleus. The transcriptional targets of GLI1 include proliferation factor cyclin D1, prosurvival protein BCL-2, prometastasis factor SNAIL, PTCH1, and its own transcription (14–16). Blockade of Hh and its downstream targets would thus be a logical therapeutic target in cancer cells. In murine models, the SMO blocker cyclopamine has been used to combat prostate cancer cell growth (9, 17). Additionally, compounds that block SMO have been shown to possess efficacy in treatment of basal cell carcinomas and Gorlin syndrome (18–20). In phase I and II trials, however, Hh inhibitors have failed to live up to their promise for use in other solid tumors (21). Thus, further research is essential to exploring the action of Hh pathway inhibitors in cancer.
Our research examines a potential inhibitory relationship between the serine protease inhibitor protease nexin 1 (PN1) and the Hh pathway. PN1, also known as SerpinE2 or glial-derived nexin, is an ECM protein known to tightly bind and counter the activity of thrombin, urokinase plasminogen activator (UPA), TPA, and trypsin (22, 23). PN1 is expressed by various cell types, including endothelial cells, platelets, and fibroblasts, and is highly expressed in some tissues, including brain and prostate (24, 25). Much of the knowledge of the protein’s functional activity is based on its ability to inhibit the above-listed proteases, especially thrombin, a critical component of coagulation (26). In the brain, PN1 assists in control of astrocyte proliferation and neurite outgrowth (27). However, its range of known functions has expanded to include a potential regulatory role in cancer (28–30). Its location in the ECM, ready binding to collagen IV, and inherent antiprotease ability place the protein in a position to affect both tumor growth and metastatic potential.
An association exists between PN1 and MMP9, the latter of which functions in the cleavage and clearance of ECM basement membrane to facilitate migration and extravasation of cancer cells (31). PN1 is an MMP9 substrate (32). The balance of the 2 proteins is important in determining the activity of UPA, whose overexpression is strongly correlated with tumor aggressiveness and poor outcome in both breast and prostate cancer (33). Recent evidence points to a decrease in UPA-dependent prostate cancer cell invasion if PN1 is overexpressed or if PN1 levels increase due to downregulation of MMP9 (34). Hh signaling was shown to be inversely related to PN1 expression during cerebellar development (35), leading to reduced cerebellar granular neuron precursor proliferation and reduction in cyclin D1 and GLI1. These results raised the possibility that PN1 activity might act as a regulatory brake to Hh signaling in other settings.
Given the results of our previous studies with PN1 and cellular migration, we wanted to determine whether its regulation of Hh was a factor in the progression of CaP. In this study, we demonstrated the ability of PN1 to reduce levels of Hh ligands, their downstream effectors, and proliferation in prostate and other cancer cell lines. Additionally, evidence for downregulation of Hh signaling by PN1 also extended to normal murine tissues, prostate tumors, and human prostate cancer specimens.
Results
PN1 expression inhibits Hh signaling in prostate cancer cell lines.
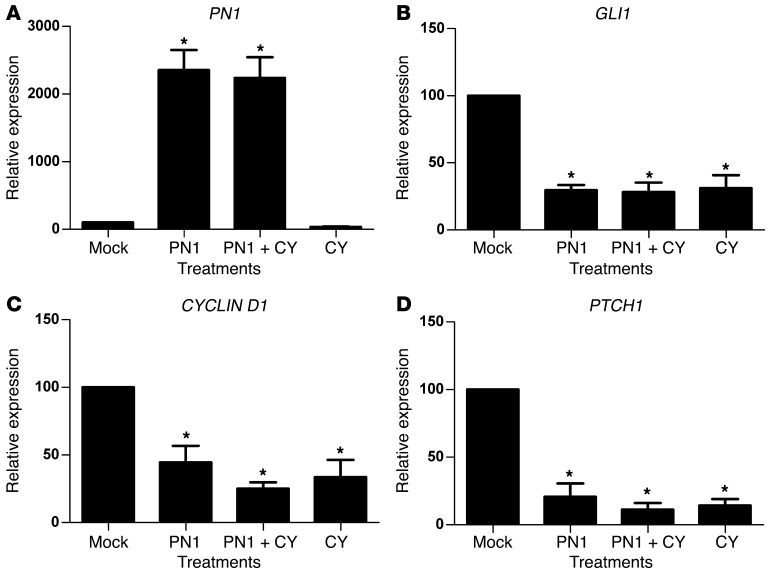
PN1 is expressed in a panel of human metastatic prostate and pancreatic cell lines and can be transiently overexpressed (Supplemental Figure 1, A and B; supplemental material available online with this article; doi: 10.1172/JCI59348DS1). Higher levels of PN1 protein induced by transfection of an expression vector in the PC3 human prostate carcinoma cell line led to repression of RNA transcripts for the Hh downstream targets GLI1, PTCH1, and CYCLIN D1 (Figure 1). Cyclopamine is a plant alkaloid that irreversibly binds SMO downstream of PTCH1, inhibiting Hh signaling, and was used as a control for inhibition (36, 37). Cyclopamine reduced GLI1, PTCH1, and CYCLIN D1 to levels similar to those resulting from high levels of PN1. Comparable reduction of GLI1 was obtained after PN1 expression (Supplemental Figure 1C) or treatment with cyclopamine in the panel of human metastatic prostate and pancreas cell lines (Supplemental Figure 1D). Androgen sensitivity may play a role, as GLI1 levels in androgen-unresponsive lines such as PC3 and PC3ML were significantly more reduced by PN1 than in the LNCaP cell line. However, in general, expression of PN1 inhibited Hh signaling in all lines tested.
Figure 1. PN1 reduces Hh signaling in metastatic prostate cancer cells.
RNA expression of (A) PN1, (B) GLI1, (C) CYCLIN D, and (D) PTCH1 after transfection of a PN1 expression plasmid or empty vector (2 μM) and treatment with cyclopamine (10 μM) in PC3 cells. One-way ANOVA (n = 4). *P ≤ 0.05.
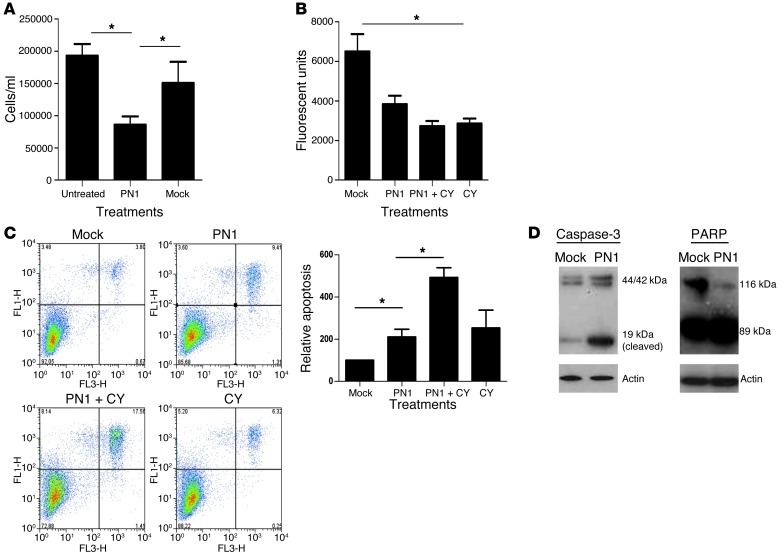
Inhibition of Hh signaling has been linked to decreased proliferation in some prostate cancer cell lines (9, 17). Overexpression of PN1 in PC3 (Figure 2 and Supplemental Figure 2) and the mouse prostate carcinoma line TrampC2 (Supplemental Figure 2, D and E) diminished proliferation in tissue culture, although to a greater extent in PC3 cells. PC3 cells (Figure 2B) also showed greater levels of apoptosis (Figure 2, C and D), and the combination of cyclopamine with PN1 overexpression amplified this effect.
Figure 2. PN1 reduces proliferation and increases apoptosis in metastatic prostate cancer cells.
PC3 cells were transfected with a PN1 expression plasmid or empty vector (2 μM) and treated with cyclopamine (10 μM) as indicated. PN1 expression affects (A) cell numbers (Student’s t test, n = 3), (B) proliferation (alamarBlue assay, 1-way ANOVA, n = 3), (C) apoptosis (annexin-PI assay, 1-way ANOVA, n = 3), and (D) cleavage of caspase-3 (19-kDa active band) and PARP (89-kDa active band). *P ≤ 0.05.
PN1 reduces SHH expression.
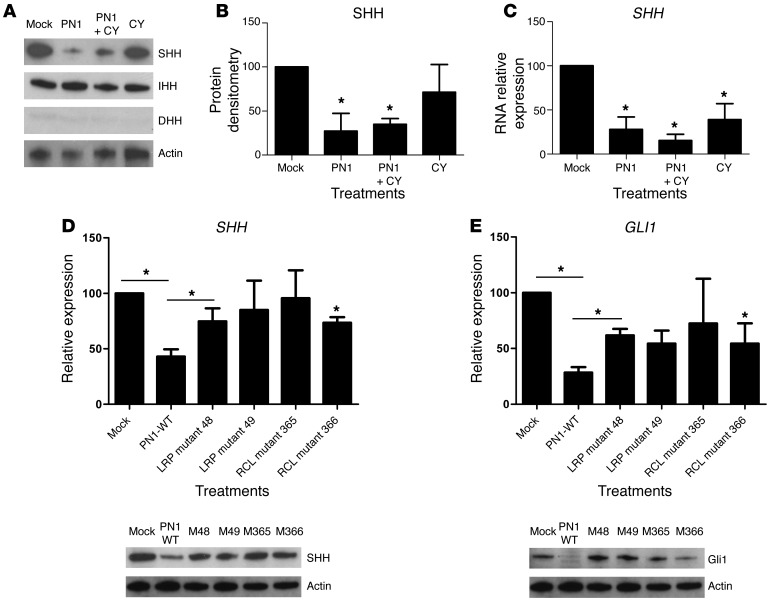
The Hh pathway is driven by the interaction of 1 of 3 ligands, SHH, IHH, or DHH, with PTCH1 (13). We asked whether these ligands were affected by PN1 expression (Figure 3A). Protein levels of DHH were not reliably detected, whereas IHH and SHH were both present in PC3 cells. However, SHH protein levels were repressed by PN1 expression and by cyclopamine. Densitometry of immunoblots confirmed these changes in SHH protein expression (Figure 3B), and a similar pattern was observed at the transcript level (Figure 3C). To determine whether this effect was general or particular to PC3, the cell line panel in Supplemental Figure 1 was again utilized. SHH RNA transcript levels were reduced in the majority of the lines tested (Supplemental Figure 3A), suggesting that PN1 reduces SHH expression in cancer cells.
Figure 3. PN1-dependent reduction of Hh signaling requires RCL activity and the LRP receptor.
(A) Treatments as in Figure 2. Hh ligand, SHH, IHH, and DHH expression. Corresponding densitometry (B) confirms changes in SHH protein levels, and RT-PCR (C) shows SHH transcripts. One-way ANOVA (n = 3). RT-PCR and immunoblotting show effect on (D) SHH and (E) Gli of transfection with PN1 bearing the indicated mutations in LRP or RCL. One-way ANOVA (n = 3). *P ≤ 0.05.
PN1 requires RCL activity and the LRP receptor to modulate Hh downstream targets.
Our next step was to determine which functional regions of PN1 were essential for Hh suppression. Direct interaction between PN1 and SHH did not appear to account for this effect, as interaction between the 2 proteins has not been reported and we did not find any evidence of physical interface between SHH and PN1 in mass spectroscopy analysis using a PN1-binding assay (our unpublished observations).
The activity of PN1 is controlled by 3 principle regions of interest: heparin interaction, the reactive center loop (RCL), and the LDL receptor–related protein binding site (LRP) (38, 39). The RCL, located in the C terminus of PN1, is required for the inhibitory activity of PN1 and is homologous to the RCL of other serpins (40). The RCL is cleaved by its bound serine protease target. Consequently, PN1 undergoes a conformational change to a more energetically stable state that forms a covalent bond with the protease, resulting in its inhibition (40).
We had previously engineered point mutations (Supplemental Figure 3B) into the RCL of PN1 (arginine or serine replacing proline) that decreased its ability to inhibit UPA by approximately 50% (34). PN1 with these RCL mutations was less effective than WT in the inhibition of SHH and GLI1 expression (Figure 3, D and E). These data point to a requirement of protease inhibitory activity for PN1 to reduce SHH levels.
PN1 is internalized more efficiently as part of an inhibitory complex with a target protease than as a free protein (41). The LRP-binding region interacts with the cellular receptor LRP-1 to mediate the internalization of PN1, and heparin increases PN1-substrate complex binding and the catabolism of the complex within the cell (42). A mutant form of PN1 in the LRP-binding site (amino acid 48 histine into alanine) was less effective in reducing SHH and GLI1 levels (Figure 3, D and E) than PN1 itself. The PN1-LRP mutant at amino acid 49 (histine into aspartic acid) was less statistically robust but also prevented decreases in SHH. Changes in RNA levels were mirrored by protein levels and support the hypothesis that PN1 must be internalized through the LRP to inhibit SHH expression.
To further substantiate this conclusion, we inhibited LRP with blocking antibodies in PC3 cells, resulting in significantly elevated PN1 levels (Supplemental Figure 3C), consistent with its clearance through the receptor. In addition to the LRP, the UPA receptor UPAR has been proposed as a possible receptor for PN1 complexes, perhaps acting synergistically with the LRP (43). To assess this possibility, cells were treated with a UPAR-blocking antibody. PN1 elevations were detected in PC3 conditioned medium after application of this antibody, suggesting that UPAR may also be involved in PN1 cellular translocation. Anti-UPAR antibody resulted in modestly increased SHH (Supplemental Figure 3C). In both cases, 50 nM concentrations of the antibodies were more effective than 20 nM. VEGF (Supplemental Figure 3C) was used as a loading control, as it is expressed by PC3 cells and its levels did not change in response to PN1 in proteomic experiments (32). Thus, both the LRP and the UPAR receptors may be involved in PN1 uptake.
MMP9 levels control PN1 expression and indirectly regulate SHH levels.
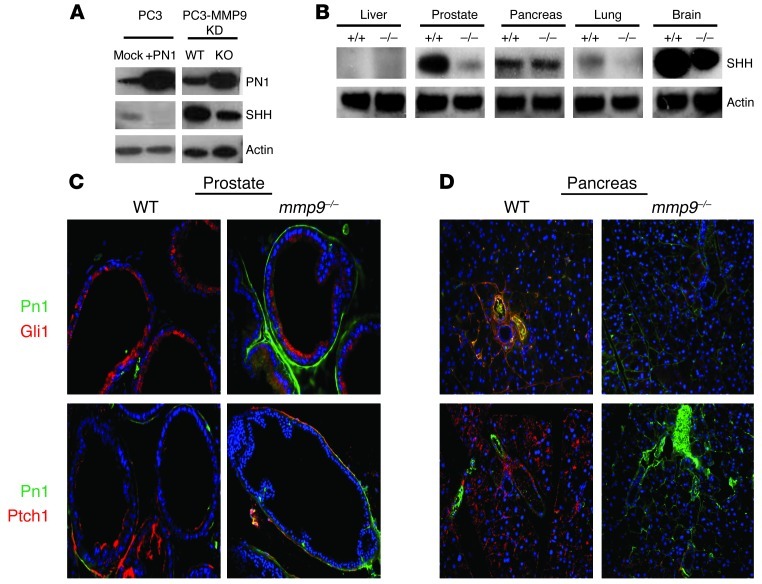
Since PN1 is a proteolytic target of MMP9 (32), we asked whether the Hh pathway is affected by MMP9-mediated PN1 degradation. PN1 levels were increased in a PC3-derived cell line (KD-31) when MMP9 expression was decreased (Figure 4A). SHH levels decreased as well, consistent with the suggestion that MMP9 regulates SHH through degradation of PN1. We then examined SHH protein levels in tissues of WT and mmp9–/– mice. SHH was reduced in the organs in which MMP9 deficiency induced intermediate to high levels of PN1 expression: the prostate and the brain (Figure 4B). The intensity and extent of PN1 immunofluorescent staining was increased in mmp9–/– animals in both the prostate and pancreas (Figure 4, C and D). PN1 staining was clearly confined to the stroma between prostate glands or within the pancreatic stroma in the periductal region. Consistent with our in vitro findings, Hh downstream proteins GLI1 and PTCH1 were reduced in tissues coincident with the increase of PN1. PTCH1 was expressed on the cell surface, as expected. Interestingly, both PTCH1 and GLI1 were detected on both the luminal and basement membrane sides of the prostate gland. The lumen has been identified as a site for SHH, PTCH1, and GLI1 in tumors (9, 17).
Figure 4. MMP9 levels control PN1 expression and indirectly regulate SHH levels.
(A) In PC3 cells, overexpression of PN1 reduces SHH levels. Furthermore, in a PC3-derived line lacking MMP9, PN1 was increased while SHH levels were lowered. (B) WT or mmp9–/– mouse tissues were immunoblotted for changes in SHH expression. Immunofluorescence of prostate tissue (C) and pancreas tissue (D) from WT and mmp9–/– mice of downstream Hh pathway proteins Gli1 and Ptch1. PN1 staining (green) and GLI1/PTCH1 (red) as indicated. Original magnification, ×20.
Finally, there was evidence in the brain of a link between MMP9 and downregulation of PN1. Cerebella in PN1-knockout mice are larger than those in WT mice due to increased Hh signaling (35). mmp9–/– mice have decreased cerebellar size compared with WT based on MRI measurements (Supplemental Figure 4 and Supplemental Table 1). Thus, a link can be made between MMP9 reduction (decreases or total ablation) and reduced Hh signaling in PN1-containing tissues.
PN1 inhibits tumor growth and influences angiogenesis in vivo.
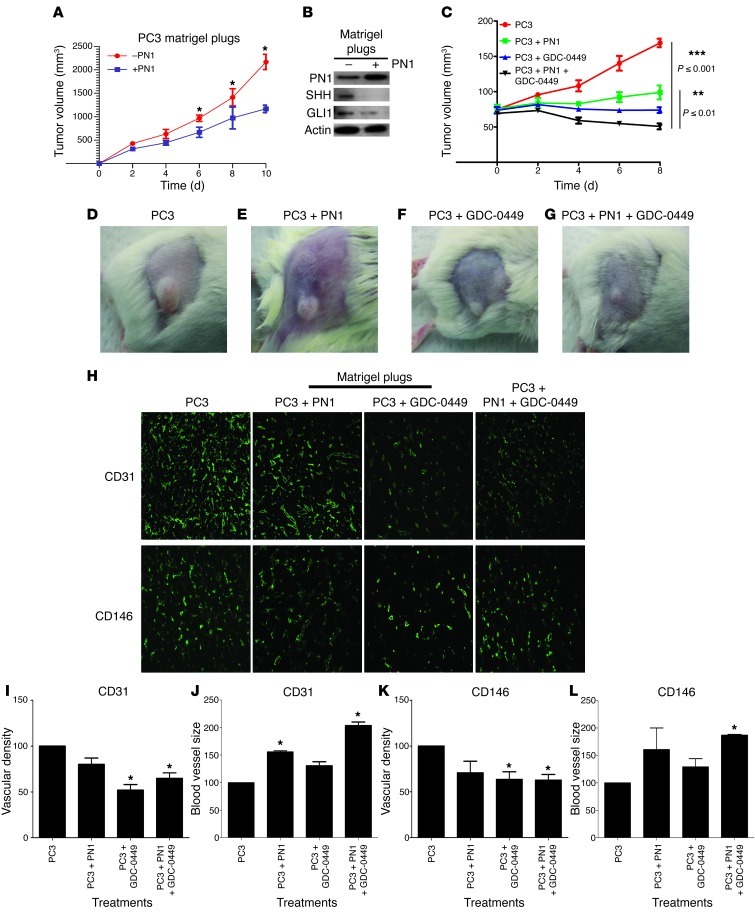
Because subcutaneous tissues do not appear to contain endogenous PN1, we asked whether PN1 added to Matrigel would affect tumor growth and Hh signaling. SCID mice were injected with cells subcutaneously in Matrigel or with the addition of exogenous recombinant PN1 (10 μM) mixed into the Matrigel. The PN1 led to decreased tumor growth (Figure 5A).
Figure 5. PN1 inhibits tumor growth and influences angiogenesis in vivo.
(A) Subcutaneous tumor volumes from SCID mice implanted with PC3 plus Matrigel or PC3 plus Matrigel plus PN1 (10 μM) (n = 3). (B) Relative change in tumor volume (C) from SCID mice with PC3 cells plus Matrigel or PC3 cells plus Matrigel plus PN1 (10 μM) recombinant protein alone (D and E). Mice treated with oral gavage of Hh signaling inhibitor GDC-0449 (25 mg/kg) alone (F) or in combination with PN1 recombinant protein (G). Immunofluorescence of Matrigel plugs (H), vascular density (I, K), and blood vessel diameter (J, L) in tumors implanted with PN1 or implantation with PN1 and treatment with GDC-0449. Staining with endothelial markers CD31 and CD146. *P ≤ 0.05. Original magnification, ×20.
Immunoblotting showed that SHH and GLI1 were reduced in tumors grown in the presence of PN1 (Figure 5B), supporting the in vitro data (Figure 1 and Supplemental Figures 1 and 2). We then treated mice with subcutaneous PC3 xenografts with Hh inhibitor, GDC-0449 (Figure 5, C and F). Preclinical studies with this drug have shown efficacy in treating subcutaneous tumors (44). This treatment resulted in decreased growth equivalent to the decrease at 0–6 days of the cells embedded in Matrigel with PN1. However, after 8 days, the tumors exposed to PN1 grew more rapidly. Whether this was due to decreased exposure to PN1 or a difference in biological behavior compared with the mice treated with GDC-0449 would be difficult to ascertain. Finally, mice with tumors implanted with PN1 were also treated with GDC-0449 (Figure 5, C and G). Meaningfully, this combined treatment resulted in tumor regression.
Untreated tumors had a higher vascular density than those treated with PN1 or GDC-0449 or the combination of the two based on immunostaining for CD31 and CD146 (Figure 5H). Tumors grown in the presence of recombinant PN1 had fewer blood vessels, although with larger diameters compared with controls (Figure 5, I–L). The combination of GDC-0449 and PN1 treatments resulted in even greater vessel size. Thus, pharmaceutical inhibition of Hh signaling led to approximately the same tumor growth delay as impregnating the plug with PN1. However, both treatments together led to tumor regression, suggesting that the mechanisms of these 2 effects, while overlapping, are probably not identical. In addition, the morphological effects on blood vessels of either treatment were distinct, further suggesting that the mechanisms may be distinguishable.
mmp9–/– mice are less effective as hosts for orthotopic prostate tumors.
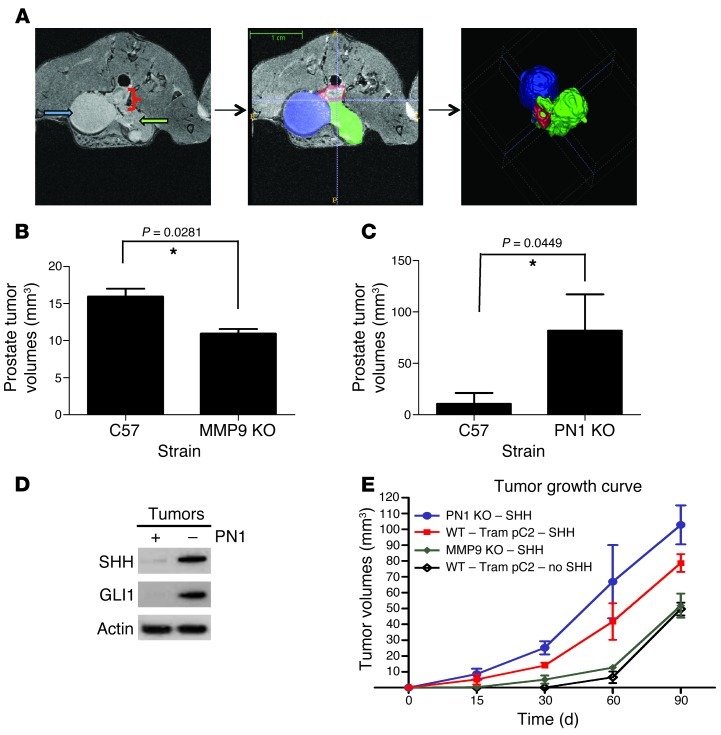
Since MMP9 deficiency increased the amount of PN1, we used mmp9–/– mice to test the effect of increased prostatic PN1 in an orthotopic model with syngeneic mouse TrampC2 cells (Figure 6 and ref. 45). Twelve weeks after injection, most WT (C57BL/6) mice had developed intraprostatic tumors (78%), with fewer in mmp9–/– animals (40%) (Figure 6, A and B). On average, WT animals produced larger tumors (162 mm3) than mmp9–/– (109 mm3). MRI images and computer modelling showed that the tumors at the injection site began in the prostate and invaded outward along the urethra and bladder. Despite some variability (summarized in Supplemental Table 2), in the WT mice, significantly larger tumors resulted.
Figure 6. Effect of MMP9 and PN1 on orthotopic prostate tumor growth.
(A) MRI image (left panel) of a prostate tumor in a WT mouse following intraprostate injection with the metastatic mouse carcinoma line TrampC2 at 12 weeks. Contouring (middle panel): bladder (blue); tumor (green); prostate (red). 3D model representation (right panel). (B) Tumor volume from MRI in indicated mice. Mann-Whitney U test. (n = 5). (C) Tumor volume in WT and pn1–/– mouse tumors using MRI. Mann-Whitney U test (n = 5). (D) Immunoblot detection of PN1, SHH, and GLI1 tumors grown in WT or pn1–/– mice. (E) Volumes from intraprostate TrampC2 tumors stably expressing SHH in pn1–/–, mmp9–/–, and WT mice (n = 6). *P ≤ 0.05.
pn1–/– mice are more susceptible to orthotopic tumors.
Establishment of orthotopic tumors was more effective in the pn1–/– mice (4/5 mice, average 100 mm3), and the tumors were generally larger than in the WT (1/5, 53 mm3) (Figure 6C and Supplemental Table 3). In general, tumors invaded from the distal prostate and alongside the urethra similar to the mmp9–/– mice. Tumors developed more rapidly in pn1–/– than in age-matched WT mice (approximately 8 to 9 weeks versus 12). SHH and GLI1 levels were reduced in tumors grown in the WT tissue compared with pn1–/– mice (Figure 6D), supporting the data concerning the effects of PN1 on the Hh pathway.
SHH accelerates orthotopic tumor growth.
To further examine the importance of SHH on tumor growth in this model, a TrampC2 cell line stably expressing SHH was generated (Supplemental Figure 5A). In these cells, induction of PN1 decreased SHH and GLI1 expression, but their overall levels remained high and comparable to those of the parental cells (Supplemental Figure 5B). Intraprostate tumors derived from SHH-overexpressing cells occurred more frequently and grew significantly faster than those from parental TrampC2 cells (Figure 6E). PN1 absence in the host led to increased tumor growth by both cell lines to approximately the same extent. Of note, mmp9–/– mice supported less growth than the WT mice by the parental cells. However, SHH-overexpressing cells formed equivalent tumor volumes in both the WT and the mmp9–/– mice (Supplemental Table 4). These results provide support for the hypothesis that SHH positively affects tumor growth and that PN1 levels contribute to inhibition of this pathway in this model.
Expression of PN1 in human prostate tumor tissue.
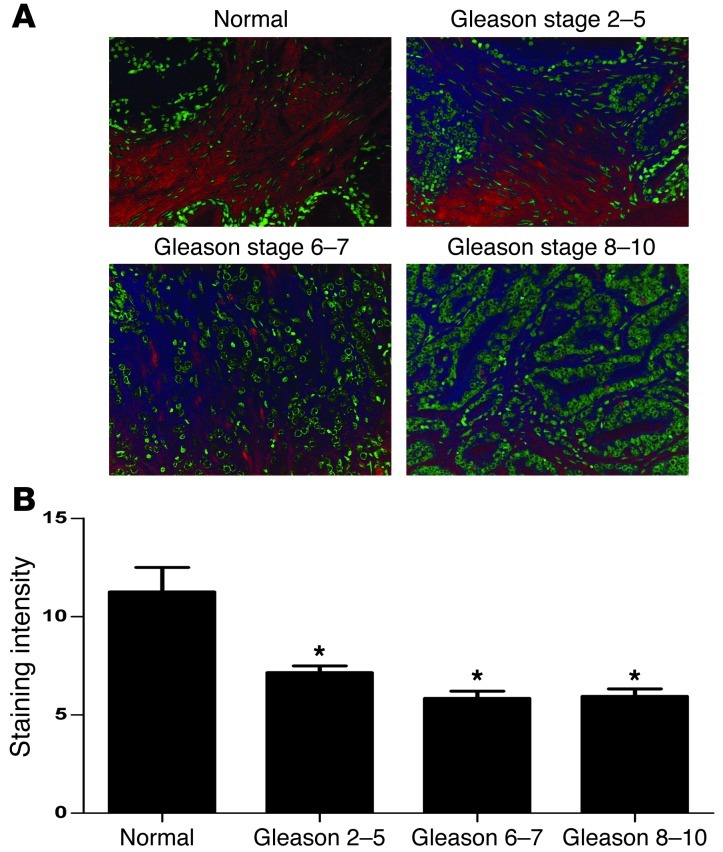
Adult prostate expresses PN1 and Hh proteins (Supplemental Figure 6A). In tumors, PN1 is detectable in the fibrous stroma between the glands and hyperplasia, but not in the epithelium, while in carcinomas, little staining was seen within the fibrous bands inside the body of the tumor (Supplemental Figure 6B). Occasionally, PN1 staining was seen in the fibrous pseudocapsule surrounding the tumor. Also, in some cases, PN1 staining appeared within the tumor cells but rarely compared with normal prostate tissue. Occasionally, PN1 was detected on blood vessels or the cytoplasm of stromal cells (IHC; Supplemental Figure 6, C and D). Further staining was completed using tissue microarrays (TMA) to quantify the frequency of PN1 in different types of prostate tissues. As expected, normal prostate tissue expressed PN1 primarily in the stromal compartments (Figure 7A). In general, staining was reduced in tumors of increasing Gleason score, with moderate PN1 in Gleason 2–5 tumors but much less in Gleason 6–7 or Gleason 8–10 tumors (Figure 7B).
Figure 7. Expression of PN1 in human prostate cancer.
(A) Immunohistochemistry for PN1. PN1 is reduced in the stroma of Gleason scores 2–5, 6–7, and 8–10 prostate tumor compared with normal tissue. Red stain represents PN1, and green represents nuclei. Original magnification, ×20. (B) Quantitation of PN1 stain in normal prostatic tissue versus Gleason tumors. One-way ANOVA (n = 10).
Genetic alterations in Hh pathway genes are associated with poor prognosis in patients with nonindolent prostate cancer.
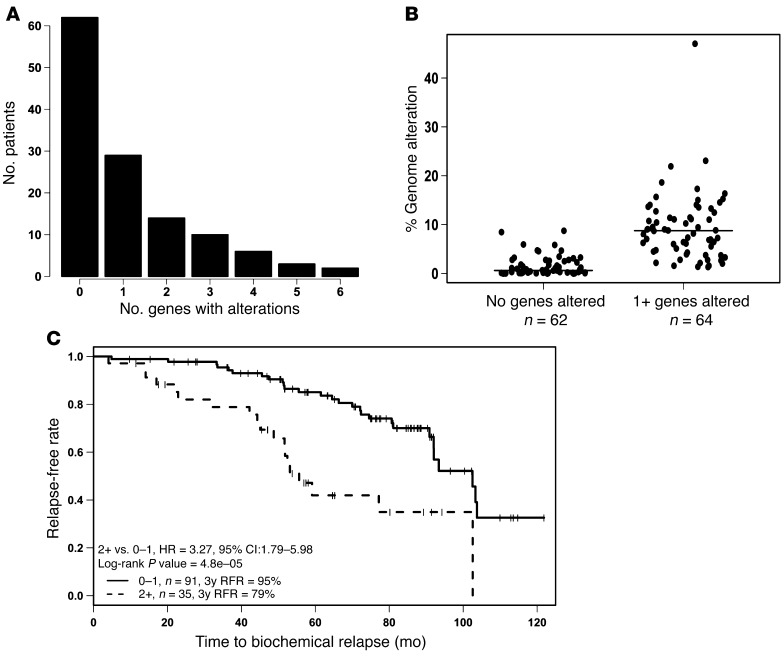
Progression of localized to metastatic CaP is associated with genetic copy number alterations (CNAs) (e.g., allelic losses and gains) and mutations (5). To determine whether genetic alterations of the Hh pathway are associated with poor patient outcome, we used array comparative genomic hybridization (aCGH) data from 126 patients with intermediate-risk CaPs (e.g., Gleason grade 6 to 7, T1 or T2, PSA less than 20 ng/ml) who had been treated with modern, image-guided radiotherapy (median dose; 76 Gy) and followed for a median of 6.6 years for biochemical failure. The details of this cohort and aCGH analyses validated by FISH have been previously published (5, 46). Using CGH, CNAs, as defined by allelic gain (amplifications) or loss (deletions), were determined for specific genes of interest, including 9 Hh-related genes (GLI1, GLI2, GLI3, PTCH1, SHH, IHH, DHH, SMO, CYCLIN D1), 3 downstream EMT genes (SNAI1, SNAI2, SNAI3), the transcription factor SMAD9, and the effectors determined here, MMP9 and PN1 (Figure 8 and Supplemental Figure 7, A and B). Particularly striking were the allelic gains observed for the SHH and MMP9 genes and allelic deletions of GLI2.
Figure 8. Genetic alteration of Hh proteins in human prostate cancer.
(A) Proportion of patients with no genetic alteration or 1 or more CNAs in Hh genes. (B) Genetic analysis of cohort (n = 126) shows that n = 35 patients presented with 2 or more Hh gene CNAs; the latter tumors had increased percentages of genome alteration (PGA; P < 0.0001). Horizontal bars show median values of the 2 groups of patients. (C) Kaplan-Meier plot and univariate analysis showing increased biochemical relapse in patients with 2 or more CNAs in Hh gene set (HR = 3.27; P < 0.00048).
Of the 126 patients, 62 were genotypically normal in regard to the Hh genes profiled, whereas 64 harbored at least 1 CNA in an Hh-related gene; the latter group of tumors had increased levels of genome alteration across the array (Figure 8, A and B). Patients with 2 or more CNAs in the tested gene panel had a significantly shorter time to PSA relapse on both univariate (hazard ratio [HR] = 3.27; P = 0.00048) and multivariate (HR = 3.06; P = 0.0067) analyses (Figure 8C and Supplemental Table 5). Pretreatment PSA was also prognostic in this treatment cohort. This multivariate analysis is consistent with Hh gene alterations being an important and novel prognostic factor for aggressive behavior and treatment failure independent of a measure of percentage of genetic instability (PGA) (Supplemental Table 5). PGA itself does not predict relapse. Analysis was also extended to investigate the impact of Hh genetic changes on PSA in Gleason 6–7 tumors, though stratification of these patients was inconclusive (Supplemental Figure 7C). Positive associations were noted between PTEN gene deletion and the presence of a TMPRSS2:ERG fusion (see strong trends in Supplemental Tables 6 and 7). One-quarter to one-third of patients whose tumors harbored 2 or more Hh gene alterations had a PTEN gene deletion or TMPRSS2:ERG fusion, respectively.
Discussion
In this study, we show that PN1, an endogenous constituent of ECM in the prostate, is a negative regulator of Hh signaling. Furthermore, enhanced expression of PN1 leads to impaired prostate cancer cell proliferation in culture and the reduced ability of prostate tumors to undergo neoangiogenesis. Elevated levels of PN1 led to decreased SHH mRNA and downregulation of Hh target mRNAs and proteins. These data further implicate the Hh signaling pathway in prostate cancer progression. Reduced SHH is of interest because many clinical and scientific studies have reported that elevated SHH levels correlate with poor survival in patients or animals in various tumor types, including prostate cancer (17, 47–50).
Monard et al. provided insight into the relationship of PN1 and Hh signaling by linking the absence of PN1 with the expansion of cerebellar granular progenitor cell populations in brain and upregulation of Hh-dependent proteins cyclin D1 and cyclin D2 (35). Our studies suggest that PN1 blocks growth of prostate tumor cells through downregulation of SHH itself and its downstream effectors. These data give rise to a number of observations, including the revelation that higher PN1 expression induces apoptosis in prostate tumor cells (Figure 2) and can influence the vasculature of prostate tumors (Figure 5).
PN1 is susceptible to MMP9 degradation (32). Therefore, we hypothesized that MMP9 would elevate Hh signaling by counteracting the inhibitory effect of PN1. This proved to be the case in tissues with high levels of PN1, such as prostate, pancreas, and brain (Figure 4B and refs. 32, 34). Finally, in mmp9–/– mice, PN1 was increased in the ECM of prostate and pancreas contemporaneous with reductions in Hh signaling targets GLI1 and PTCH1 (Figure 4C). All of the evidence points to PN1 being a degradative target of MMP9. If MMP9 expression is ablated, then PN1 is able to inhibit Hh signaling via downregulation of the SHH ligand.
Thus, a balance of PN1 and SHH levels may be an important factor in regulation of prostatic tumor growth. For example, subcutaneous PC3 growth was impeded by exposure to PN1 or the Hh pathway inhibitor GDC-0449 (Figure 5). Additionally, in an orthotopic tumor model, alterations of PN1 or SHH levels had contrasting effects on intraprostate tumor growth (Figure 6). Syngeneic murine prostatic carcinoma cells (TrampC2) had a substantially higher tumor take on the pn1–/– background and grew faster than in WT mice. These effects were augmented when SHH was stably expressed in TrampC2 cells (Figure 6E). In mmp9–/– mice, which have increased levels of PN1, the same cells had a lower tumor take and grew more slowly. However, when SHH is stably overexpressed in these cells, the reductions in tumor size are blunted (Figure 6E). These observations are consistent with PN1 in the prostate having a substantial inhibitory effect on tumor growth that can be counteracted by supplementation of SHH. They also point to the importance of Hh signaling in this prostate carcinoma model.
Processed and secreted SHH can associate with cell membranes and the ECM (51) and is thought to be mainly synthesized by cancer cells rather than the stroma. However, its contribution to cancer is currently the topic of heated debate. One question stems from an uncertainty as to whether SHH signaling is requisitely autocrine (11, 52) or paracrine (53, 54) in both prostate and pancreatic cancers. Although not expressly the intent of the research, our data seem to point to and are compatible with both scenarios. All prostate and pancreatic cancer cell lines tested produced SHH protein while also responding to cyclopamine (Supplemental Figure 1D and Supplemental Figure 3A). Several reports have found SHH expression to be restricted to tumor epithelial cells, while the effectors GLI1 and PTCH1 are localized to the tumor stromal cells (54). Thus, SHH can act in a paracrine way to affect cancer cell proliferation through the stromal compartment. PN1 in the ECM would be in a position to block Hh signaling in both compartments. Also, while the mutations observed in regions encoding SHH or MMP9 (Figure 8) could affect Hh signaling in either compartment, a few mutations were in intracellular components that would only affect the cancer cell.
There was some evidence of a stromal effect in these experiments, as increased amounts of PN1 led to changes in angiogenesis. PC3 tumors implanted subcutaneously in Matrigel contained a system of small, tortuous vessels that have the typical morphology of tumor vasculature. However, tumors grown with PN1 exhibited less vascular density, while the remaining vessels had larger diameters (Figure 5, H–J). These results are in line with previous reports that the Hh pathway is associated with the formation of new blood vessels that aid in tumor growth and metastasis (55, 56). One line of research indicates that Hh blocker IPI-926 significantly increases the efficacy of gemcitabine in treating prostate cancer due to increased perfusion (57, 58). The research proposes that the ability of IPI-926 to block Hh results in better vasculature to deliver gemcitabine to the target tumor. Such data underscore the necessity of further investigation into means of regulating Hh in vivo.
Due to its variable natural history, determining therapy for each individual patient with intermediate-risk CaP is challenging. Although some of this heterogeneity may relate to variability in the therapy, individual variation in the natural history of the disease is also evident (46). Thus, this risk category of patients has an urgent need for markers to select the best local and adjuvant therapies depending on individual prognosis (46, 59). Our study suggests that Hh signaling is implicated in CaP. CGH analyses revealed that patients with alterations in our panel of Hh-related genes were 3 times as likely to have a biochemical recurrence when compared with patients whose tumors lacked any changes in these genes. Other series of genetic changes have been identified in CaP. These include deletions or mutations in the PTEN, NCOA2, ATBF1, p53, RB1, NKX3-1, E-cadherin, p16INK4A, p27KIP, and SMAD4 genes and amplification of c-MYC and the androgen receptor genes (46, 60). CaPs also contain TMPRSS2:ERG/ETVs gene fusions in approximately 50% of all prostate cancers (61, 62). The fact that not all of the aggressive Hh-abnormal tumors had PTEN deletions suggests that Hh gene alteration is a unique determinant of tumor aggression.
The Kaplan-Meier curves in Figure 8C suggest that Hh gene–abnormal patients fail more rapidly after the completion of radiotherapy. Whether the same is true after surgery will require further studies. However, the highly prognostic level of CNAs in the Hh profile may provide a means to further segregate patients within the intermediate-risk group. Furthermore, they suggest that Hh signaling may be a determinant in biological aggressiveness. One must point out that despite strong preclinical data showing involvement of the Hh in many tumor types, inhibitors of the pathway thus far have been of limited scope clinically, with single-agent, anti-tumor activity only demonstrated for the treatment of basal cell carcinoma and medulloblastomas (21).
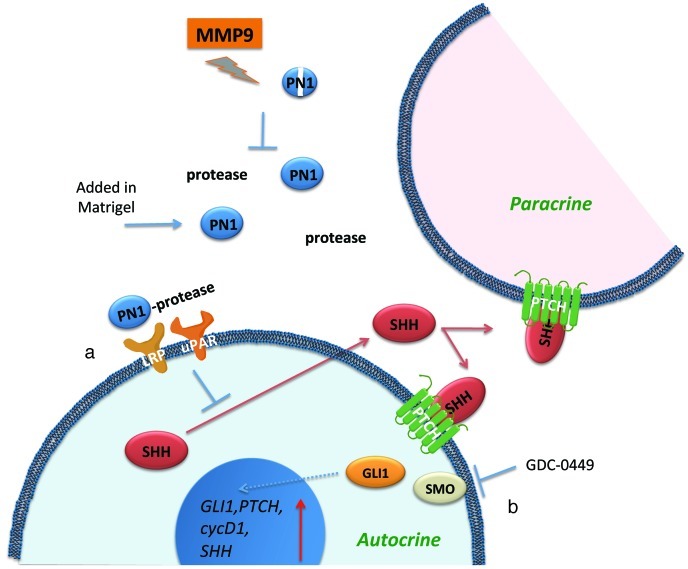
In summary, our data suggest that signaling in the Hh pathway augments the development of CaP (Figure 9). Genetic changes in the cancer cell may influence this pathway. This study demonstrates that PN1 is a potentially important new component of the regulation of Hh signaling. The mechanism of how PN1 may regulate SHH levels is still under investigation, although Fulda et al. have provided evidence that SHH may be under the regulatory control of the NF-κB pathway (63). Our data show that endogenous PN1 in the prostate stroma counters Hh signaling. The tumor has several means to overcome this block, including tumor or stromal production of MMP9 that reduces PN1 levels. In cancers with minimal reliance on Hh signaling, expression of PN1 may not be deleterious to tumor development. However, our data imply that by reduction of the contribution of the Hh pathway via PN1 expression, CaP can be affected directly with growth lag. Additionally, PN1-mediated inhibition of Hh signaling in the tumor stroma may lead to reduced angiogenesis. Thus, PN1 levels may be critical in the blockade of prostate cancer progression.
Figure 9. Summary diagram shows how recombinant PN1 added in Matrigel (a) can influence Hh proteins in both autocrine and paracrine scenarios.
PN1 disrupts reduces SHH expression, leading to reduction of downstream Hh effectors and tumor growth. Treatment with Hh inhibitor (b) GDC-0449 blocks another avenue of Hh signaling leading to inhibition of SMO. The combined effect slows the growth of prostate metastatic cells, potentially through changes in angiogenesis. The PN1 arm of the pathway can be inhibited by MMP9 activity.
Methods
Animals.
Male WT C57BL/6 and mmp9–/– mice were provided by Ghislain Opdenakker (University of Leuven, Leuven, Belgium). The pn1–/– animals were a gift from M.C. Bouton (Inserm, Université Paris, Paris, France). All KO animals were compared against littermate controls.
Plasmids and mutagenesis.
pcDNA3-PN1 plasmid was a gift from Peter Andreasen’s lab (Aarhus University, Aarhus, Denmark). Point mutations are described in Xu et al. (32).
Cell culture and treatment.
PC3, PC-3ML, TrampC2, LnCAP, Miapaca-2, and Panc1 cells were maintained in DMEM or RPMI supplemented with 10% fetal bovine serum at 37°C with 5% CO2. For the MMP9 KD cell line derived from PC-3ML, 400 μg/ml G418 selection was used to maintain the KD (17). PN1 plasmids were transfected into cells using FuGENE 6 transfection reagent (Roche). Indicated inhibitors were added to serum-free medium: cyclopamine (EMD Bioscience), UPAR-blocking antibody (R&D Systems), GDC-0449 (Biovision), and LRP-blocking antibody (Progen).
Flow cytometry.
For annexin–propidium iodide (annexin-PI) labeling, approximately 1.0 × 10⁵ cells were labeled with either annexin, PI, or a combination and evaluated on an Excalibur 4 color cytometer within 1 hour. Analysis was performed using FlowJo.
Immunoblotting and immunohistochemistry.
Whole-cell lysates were extracted through lysing cell pellets as previously described. Proteins were probed with the indicated antibodies: anti-PN1, GLI1, DR5 (R&D Systems), β-actin (Santa Cruz Biotechnology Inc.), SHH, Parp, caspase-3 (Cell Signaling), DHH, and IHH (Abnova). Apoptotic protein arrays (R&D Systems) were also used. All tissues harvested for immunohistochemistry were fixed in 4% paraformaldehyde (<24 hours) and sliced at 10-μM thickness for staining. Alexa Fluor fluorescent-linked secondary antibodies and Hoechst nuclear stain were used at 1:500 and 1:10,000 dilutions respectively.
RNA isolation and quantitative RT-PCR.
Whole-cell RNA was extracted by Trizol, and RNA concentration was measured by Nano-Drop. All RT-PCR reaction mixtures were prepared using Superscript Platinum III 1-step kits with incorporated SYBR Green (Invitrogen). cDNA production and DNA amplification were performed on a Stratagene MX 3005P Thermocycler. All amplified products were normalized against GAPDH. Amplified products were confirmed by electrophoresis using 1.5% high-resolution agarose gels. Primer sequences are listed in the Supplemental Primer Table.
Tumor growth and angiogenesis.
Adult SCID mice were injected subcutaneously with 2.0 × 10⁶ PC3 cells in 50 μl of Matrigel with 10 μM of 100 μl PN1 recombinant protein (R&D Systems). Anti-Hh compound GDC-0449 (diluted 3:1 in EtOH/PEG) was administered at 25 mg/kg daily or every other day. as indicated by oral gavage Tumor volumes were determined by calliper measurement. Tumor sizes are reported in mm3 using the W2 × L/2 equation, where W indicates width and L indicates length.
Intraprostate injection.
Adult male WT, mmp9–/–, or pn1–/– mice were injected with 2.0 × 10⁶ of TrampC2 or TrampC2-SHH cells via intraprostate injection (50 μl) in the dorsal prostatic lobe during laparotomy. TrampC2 cells were derived from C57BL/6 mice. MRI was used to measure tumor size and position.
MRI.
MRI was performed at 4.7 T (VNMRS console; Varian Inc.). Multi-echo, T2-weighted images (echo time [TE] = 10, 20; repetition time [TR] >5000 ms) of cerebellum and prostate were acquired with a resolution of 150 × 150 × 300 microns. The prostate images were respiration gated to reduce respiratory motion artifact. Volume measurements were made using the sum of the 2 echo images using ITK-SNAP (Source Forge).
Human prostate TMAs.
Human TMAs were purchased from Biomax and analyzed using immunohistochemical techniques as described above. These tissue samples were identified according to pathology, tumor grade, and Gleason score, with normal tissue controls in duplicate or triplicate. PN1 staining was quantitated using the TRI2 software provided by Paul Barber (University of Oxford).
aCGH.
DNA labeling and hybridization were performed with slight modifications to that described previously (5). Array data have been submitted to the GEO database (GSE41120). More details can be found in the Supplemental Methods.
Statistics.
All statistical measures for the preclinical experiments were determined using Prism 5 GraphPad software. Data represent the mean ± SEM. P ≤ 0.05 was considered significant. More details can be found in the Supplemental Methods.
Study approval.
All animal experiments and protocols were reviewed and performed in accordance with UK Home Office and Oxford University regulations.
Supplementary Material
Acknowledgments
The authors wish to thank Spela Ferjancic, Thomas Tapmeier, Manos Fokas, and Esther Lim for technical assistance and support. This work was supported by Cancer Research UK and NIH grants. R.G. Bristow and W. Lam received funding from the Canadian Institutes for Health Research (CIHR); Genome Canada/British Columbia; Ontario Institute for Cancer Research; the PMH-Campbell Family Cancer Research Institute Prostate Cancer Program; and the Ontario Ministry of Health and Long Term Care.
Footnotes
Conflict of interest: The authors have declared that no conflict of interest exists.
Citation for this article: J Clin Invest. 2012;122(11):4025–4036. doi:10.1172/JCI59348.
References
- 1.Jemal A, et al. Cancer statistics, 2008. CA Cancer J Clin. 2008;58(2):71–96. doi: 10.3322/CA.2007.0010. [DOI] [PubMed] [Google Scholar]
- 2.Nichol AM, Warde P, Bristow RG. Optimal treatment of intermediate-risk prostate carcinoma with radiotherapy: clinical and translational issues. Cancer. 2005;104(5):891–905. doi: 10.1002/cncr.21257. [DOI] [PubMed] [Google Scholar]
- 3.Lawrentschuk N, Klotz L. Active surveillance for low-risk prostate cancer: an update. Nat Rev Urol. 2011;8(6):312–320. doi: 10.1038/nrurol.2011.50. [DOI] [PubMed] [Google Scholar]
- 4.Mottet N, et al. EAU guidelines on prostate cancer. Part II: Treatment of advanced, relapsing, and castration-resistant prostate cancer. Eur Urol. 2011;59(4):572–583. doi: 10.1016/j.eururo.2011.01.025. [DOI] [PubMed] [Google Scholar]
- 5.Ishkanian AS, et al. High-resolution array CGH identifies novel regions of genomic alteration in intermediate-risk prostate cancer. Prostate. 2009;69(10):1091–1100. doi: 10.1002/pros.20959. [DOI] [PubMed] [Google Scholar]
- 6.Taylor BS, et al. Integrative genomic profiling of human prostate cancer. Cancer Cell. 2010;18(1):11–22. doi: 10.1016/j.ccr.2010.05.026. [DOI] [PMC free article] [PubMed] [Google Scholar]
- 7.Mimeault M, Batra SK. Frequent gene products and molecular pathways altered in prostate cancer- and metastasis-initiating cells and their progenies and novel promising multitargeted therapies. Mol Med. 2011;17(9–10):949–964. doi: 10.2119/molmed.2011.00115. [DOI] [PMC free article] [PubMed] [Google Scholar]
- 8.Ingham PW, McMahon AP. Hedgehog signaling in animal development: paradigms and principles. Genes Dev. 2001;15(23):3059–3087. doi: 10.1101/gad.938601. [DOI] [PubMed] [Google Scholar]
- 9.Karhadkar SS, et al. Hedgehog signalling in prostate regeneration, neoplasia and metastasis. Nature. 2004;431(7009):707–712. doi: 10.1038/nature02962. [DOI] [PubMed] [Google Scholar]
- 10.Fan L, et al. Hedgehog signaling promotes prostate xenograft tumor growth. Endocrinology. 2004;145(8):3961–3970. doi: 10.1210/en.2004-0079. [DOI] [PubMed] [Google Scholar]
- 11.Thayer SP, et al. Hedgehog is an early and late mediator of pancreatic cancer tumorigenesis. Nature. 2003;425(6960):851–856. doi: 10.1038/nature02009. [DOI] [PMC free article] [PubMed] [Google Scholar]
- 12.Berman DM, et al. Widespread requirement for Hedgehog ligand stimulation in growth of digestive tract tumours. Nature. 2003;425(6960):846–851. doi: 10.1038/nature01972. [DOI] [PubMed] [Google Scholar]
- 13.Azoulay S, et al. Comparative expression of Hedgehog ligands at different stages of prostate carcinoma progression. J Pathol. 2008;216(4):460–470. doi: 10.1002/path.2427. [DOI] [PubMed] [Google Scholar]
- 14.Bigelow RL, et al. Transcriptional regulation of bcl-2 mediated by the sonic hedgehog signaling pathway through gli-1. J Biol Chem. 2004;279(2):1197–1205. doi: 10.1074/jbc.M310589200. [DOI] [PubMed] [Google Scholar]
- 15.Li X, et al. Snail induction is an early response to Gli1 that determines the efficiency of epithelial transformation. Oncogene. 2006;25(4):609–621. doi: 10.1038/sj.onc.1209077. [DOI] [PMC free article] [PubMed] [Google Scholar]
- 16.Kasper M, Regl G, Frischauf AM, Aberger F. GLI transcription factors: mediators of oncogenic Hedgehog signalling. Eur J Cancer. 2006;42(4):437–445. doi: 10.1016/j.ejca.2005.08.039. [DOI] [PubMed] [Google Scholar]
- 17.Sanchez P, et al. Inhibition of prostate cancer proliferation by interference with SONIC HEDGEHOG-GLI1 signaling. Proc Natl Acad Sci U S A. 2004;101(34):12561–12566. doi: 10.1073/pnas.0404956101. [DOI] [PMC free article] [PubMed] [Google Scholar]
- 18.Caro I, Low JA. The role of the hedgehog signaling pathway in the development of basal cell carcinoma and opportunities for treatment. Clin Cancer Res. 2010;16(13):3335–3339. doi: 10.1158/1078-0432.CCR-09-2570. [DOI] [PubMed] [Google Scholar]
- 19.Tang JY, et al. Inhibiting the hedgehog pathway in patients with the basal-cell nevus syndrome. N Engl J Med. 2012;366(23):2180–2188. doi: 10.1056/NEJMoa1113538. [DOI] [PMC free article] [PubMed] [Google Scholar]
- 20.Sekulic A, et al. Efficacy and safety of vismodegib in advanced basal-cell carcinoma. N Engl J Med. 2012;366(23):2171–2179. doi: 10.1056/NEJMoa1113713. [DOI] [PMC free article] [PubMed] [Google Scholar]
- 21.McMillan R, Matsui W. Molecular pathways: The Hedgehog signaling pathway in cancer. Clin Cancer Res. 2012;18(18):4883–4888. doi: 10.1158/1078-0432.CCR-11-2509. [DOI] [PMC free article] [PubMed] [Google Scholar]
- 22.Baker JB, Low DA, Simmer RL, Cunningham DD. Protease-nexin: a cellular component that links thrombin and plasminogen activator and mediates their binding to cells. Cell. 1980;21(1):37–45. doi: 10.1016/0092-8674(80)90112-9. [DOI] [PubMed] [Google Scholar]
- 23.Stone SR, Nick H, Hofsteenge J, Monard D. Glial-derived neurite-promoting factor is a slow-binding inhibitor of trypsin, thrombin, and urokinase. Arch Biochem Biophys. 1987;252(1):237–244. doi: 10.1016/0003-9861(87)90028-2. [DOI] [PubMed] [Google Scholar]
- 24.Donovan FM, Vaughan PJ, Cunningham DD. Regulation of protease nexin-1 target protease specificity by collagen type IV. J Biol Chem. 1994;269(25):17199–17205. [PubMed] [Google Scholar]
- 25.Cunningham DD, Van Nostrand WE, Farrell DH, Campbell CH. Interactions of serine proteases with cultured fibroblasts. J Cell Biochem. 1986;32(4):281–291. doi: 10.1002/jcb.240320405. [DOI] [PubMed] [Google Scholar]
- 26.Bouton MC, Venisse L, Richard B, Pouzet C, Arocas V, Jandrot-Perrus M. Protease nexin-1 interacts with thrombomodulin and modulates its anticoagulant effect. Circ Res. 2007;100(8):1174–1181. doi: 10.1161/01.RES.0000265066.92923.ee. [DOI] [PubMed] [Google Scholar]
- 27.Wagner SL, et al. Protease nexin-1, an antithrombin with neurite outgrowth activity, is reduced in Alzheimer disease. Proc Natl Acad Sci U S A. 1989;86(21):8284–8288. doi: 10.1073/pnas.86.21.8284. [DOI] [PMC free article] [PubMed] [Google Scholar]
- 28.Buchholz M, et al. SERPINE2 (protease nexin I) promotes extracellular matrix production and local invasion of pancreatic tumors in vivo. Cancer Res. 2003;63(16):4945–4951. [PubMed] [Google Scholar]
- 29.Fayard B, et al. The serine protease inhibitor protease nexin-1 controls mammary cancer metastasis through LRP-1-mediated MMP-9 expression. Cancer Res. 2009;69(14):5690–5698. doi: 10.1158/0008-5472.CAN-08-4573. [DOI] [PubMed] [Google Scholar]
- 30.Nagahara A, et al. SERPINE2 is a possible candidate promotor for lymph node metastasis in testicular cancer. Biochem Biophys Res Commun. 2010;391(4):1641–1646. doi: 10.1016/j.bbrc.2009.12.105. [DOI] [PubMed] [Google Scholar]
- 31.Egeblad M, Werb Z. New functions for the matrix metalloproteinases in cancer progression. Nat Rev Cancer. 2002;2(3):161–174. doi: 10.1038/nrc745. [DOI] [PubMed] [Google Scholar]
- 32.Xu D, Suenaga N, Edelmann MJ, Fridman R, Muschel RJ, Kessler BM. Novel MMP-9 substrates in cancer cells revealed by a label-free quantitative proteomics approach. Mol Cell Proteomics. 2008;7(11):2215–2228. doi: 10.1074/mcp.M800095-MCP200. [DOI] [PMC free article] [PubMed] [Google Scholar]
- 33.Shariat SF, et al. Association of the circulating levels of the urokinase system of plasminogen activation with the presence of prostate cancer and invasion, progression, and metastasis. J Clin Oncol. 2007;25(4):349–355. doi: 10.1200/JCO.2006.05.6853. [DOI] [PubMed] [Google Scholar]
- 34.Xu D, McKee CM, Cao Y, Ding Y, Kessler BM, Muschel RJ. Matrix metalloproteinase-9 regulates tumor cell invasion through cleavage of protease nexin-1. Cancer Res. 2010;70(17):6988–6998. doi: 10.1158/0008-5472.CAN-10-0242. [DOI] [PMC free article] [PubMed] [Google Scholar]
- 35.Vaillant C, et al. Protease nexin 1 and its receptor LRP modulate SHH signalling during cerebellar development. Development. 2007;134(9):1745–1754. doi: 10.1242/dev.02840. [DOI] [PubMed] [Google Scholar]
- 36.Cooper MK, Porter JA, Young KE, Beachy PA. Teratogen-mediated inhibition of target tissue response to Shh signaling. Science. 1998;280(5369):1603–1607. doi: 10.1126/science.280.5369.1603. [DOI] [PubMed] [Google Scholar]
- 37.Taipale J, et al. Effects of oncogenic mutations in Smoothened and Patched can be reversed by cyclopamine. Nature. 2000;406(6799):1005–1009. doi: 10.1038/35023008. [DOI] [PubMed] [Google Scholar]
- 38.Knauer MF, Kridel SJ, Hawley SB, Knauer DJ. The efficient catabolism of thrombin-protease nexin 1 complexes is a synergistic mechanism that requires both the LDL receptor-related protein and cell surface heparins. J Biol Chem. 1997;272(46):29039–29045. doi: 10.1074/jbc.272.46.29039. [DOI] [PubMed] [Google Scholar]
- 39.Knauer MF, Hawley SB, Knauer DJ. Identification of a binding site in protease nexin I (PN1) required for the receptor mediated internalization of PN1-thrombin complexes. J Biol Chem. 1997;272(19):12261–12264. doi: 10.1074/jbc.272.19.12261. [DOI] [PubMed] [Google Scholar]
- 40.Silverman GA, et al. The serpins are an expanding superfamily of structurally similar but functionally diverse proteins. Evolution, mechanism of inhibition, novel functions, and a revised nomenclature. J Biol Chem. 2001;276(36):33293–33296. doi: 10.1074/jbc.R100016200. [DOI] [PubMed] [Google Scholar]
- 41.Gettins PG. Serpin structure, mechanism, and function. Chem Rev. 2002;102(12):4751–4804. doi: 10.1021/cr010170+. [DOI] [PubMed] [Google Scholar]
- 42.Crisp RJ, Knauer DJ, Knauer MF. Roles of the heparin and low density lipid receptor-related protein-binding sites of protease nexin 1 (PN1) in urokinase-PN1 complex catabolism. J Biol Chem. 2000;275(26):19628–19637. doi: 10.1074/jbc.M909172199. [DOI] [PubMed] [Google Scholar]
- 43.Czekay RP, Loskutoff DJ. Plasminogen activator inhibitors regulate cell adhesion through a uPAR-dependent mechanism. J Cell Physiol. 2009;220(3):655–663. doi: 10.1002/jcp.21806. [DOI] [PMC free article] [PubMed] [Google Scholar]
- 44.Wong H, et al. Pharmacokinetic-pharmacodynamic analysis of vismodegib in preclinical models of mutational and ligand-dependent Hedgehog pathway activation. Clin Cancer Res. 2011;17(14):4682–4692. doi: 10.1158/1078-0432.CCR-11-0975. [DOI] [PubMed] [Google Scholar]
- 45.Foster BA, Gingrich JR, Kwon ED, Madias C, Greenberg NM. Characterization of prostatic epithelial cell lines derived from transgenic adenocarcinoma of the mouse prostate (TRAMP) model. Cancer Res. 1997;57(16):3325–3330. [PubMed] [Google Scholar]
- 46.Ishkanian AS, Zafarana G, Thoms J, Bristow RG. Array CGH as a potential predictor of radiocurability in intermediate risk prostate cancer. Acta Oncol. 2010;49(7):888–894. doi: 10.3109/0284186X.2010.499371. [DOI] [PubMed] [Google Scholar]
- 47.Kim TJ, Lee JY, Hwang TK, Kang CS, Choi YJ. Hedgehog signaling protein expression and its association with prognostic parameters in prostate cancer: a retrospective study from the view point of new 2010 anatomic stage/prognostic groups. J Surg Oncol. 2011;104(5):472–479. doi: 10.1002/jso.21988. [DOI] [PubMed] [Google Scholar]
- 48.Yoshizaki A, Nakayama T, Naito S, Wen CY, Sekine I. Expressions of sonic hedgehog, patched, smoothened and Gli-1 in human intestinal stromal tumors and their correlation with prognosis. World J Gastroenterol. 2006;12(35):5687–5691. doi: 10.3748/wjg.v12.i35.5687. [DOI] [PMC free article] [PubMed] [Google Scholar]
- 49.Kubo M, et al. Hedgehog signaling pathway is a new therapeutic target for patients with breast cancer. Cancer Res. 2004;64(17):6071–6074. doi: 10.1158/0008-5472.CAN-04-0416. [DOI] [PubMed] [Google Scholar]
- 50.Von Hoff DD, et al. Inhibition of the hedgehog pathway in advanced basal-cell carcinoma. N Engl J Med. 2009;361(12):1164–1172. doi: 10.1056/NEJMoa0905360. [DOI] [PubMed] [Google Scholar]
- 51.Bumcrot DA, Takada R, McMahon AP. Proteolytic processing yields two secreted forms of sonic hedgehog. Mol Cell Biol. 1995;15(4):2294–2303. doi: 10.1128/mcb.15.4.2294. [DOI] [PMC free article] [PubMed] [Google Scholar]
- 52.Stecca B, et al. Melanomas require HEDGEHOG-GLI signaling regulated by interactions between GLI1 and the RAS-MEK/AKT pathways. Proc Natl Acad Sci U S A. 2007;104(14):5895–5900. doi: 10.1073/pnas.0700776104. [DOI] [PMC free article] [PubMed] [Google Scholar]
- 53.Tian H, et al. Hedgehog signaling is restricted to the stromal compartment during pancreatic carcinogenesis. Proc Natl Acad Sci U S A. 2009;106(11):4254–4259. doi: 10.1073/pnas.0813203106. [DOI] [PMC free article] [PubMed] [Google Scholar]
- 54.Yauch RL, et al. A paracrine requirement for hedgehog signalling in cancer. Nature. 2008;455(7211):406–410. doi: 10.1038/nature07275. [DOI] [PubMed] [Google Scholar]
- 55.Pola R, et al. The morphogen Sonic hedgehog is an indirect angiogenic agent upregulating two families of angiogenic growth factors. Nat Med. 2001;7(6):706–711. doi: 10.1038/89083. [DOI] [PubMed] [Google Scholar]
- 56.Nakamura K, et al. Hedgehog promotes neovascularization in pancreatic cancers by regulating Ang-1 and IGF-1 expression in bone-marrow derived pro-angiogenic cells. PLoS One. 2010;5(1):e8824. doi: 10.1371/journal.pone.0008824. [DOI] [PMC free article] [PubMed] [Google Scholar]
- 57.Olive KP, et al. Inhibition of Hedgehog signaling enhances delivery of chemotherapy in a mouse model of pancreatic cancer. Science. 2009;324(5933):1457–1461. doi: 10.1126/science.1171362. [DOI] [PMC free article] [PubMed] [Google Scholar]
- 58.Lee MJ, et al. Hedgehog pathway inhibitor saridegib (IPI-926) increases lifespan in a mouse medulloblastoma model. Proc Natl Acad Sci U S A. 2012;109(20):7859–7864. doi: 10.1073/pnas.1114718109. [DOI] [PMC free article] [PubMed] [Google Scholar]
- 59.Van Baelen A, Mottet N, Spahn M, Briganti A, Gontero P, Joniau S. Sense and nonsense of an extended pelvic lymph node dissection in prostate cancer. Adv Urol. 2012;2012:983058. doi: 10.1155/2012/983058. [DOI] [PMC free article] [PubMed] [Google Scholar]
- 60.Li J, et al. PTEN, a putative protein tyrosine phosphatase gene mutated in human brain, breast, and prostate cancer. Science. 1997;275(5308):1943–1947. doi: 10.1126/science.275.5308.1943. [DOI] [PubMed] [Google Scholar]
- 61.Tomlins SA, et al. Recurrent fusion of TMPRSS2 and ETS transcription factor genes in prostate cancer. Science. 2005;310(5748):644–648. doi: 10.1126/science.1117679. [DOI] [PubMed] [Google Scholar]
- 62.Clark J, et al. Diversity of TMPRSS2-ERG fusion transcripts in the human prostate. Oncogene. 2007;26(18):2667–2673. doi: 10.1038/sj.onc.1210070. [DOI] [PubMed] [Google Scholar]
- 63.Kasperczyk H, Baumann B, Debatin KM, Fulda S. Characterization of sonic hedgehog as a novel NF-kappaB target gene that promotes NF-kappaB-mediated apoptosis resistance and tumor growth in vivo. FASEB J. 2009;23(1):21–33. doi: 10.1096/fj.08-111096. [DOI] [PubMed] [Google Scholar]
Associated Data
This section collects any data citations, data availability statements, or supplementary materials included in this article.


