Abstract
Long-term glucocorticoid treatment is associated with numerous adverse outcomes, including weight gain, insulin resistance, and diabetes; however, the pathogenesis of these side effects remains obscure. Glucocorticoids also suppress osteoblast function, including osteocalcin synthesis. Osteocalcin is an osteoblast-specific peptide that is reported to be involved in normal murine fuel metabolism. We now demonstrate that osteoblasts play a pivotal role in the pathogenesis of glucocorticoid-induced dysmetabolism. Osteoblast-targeted disruption of glucocorticoid signaling significantly attenuated the suppression of osteocalcin synthesis and prevented the development of insulin resistance, glucose intolerance, and abnormal weight gain in corticosterone-treated mice. Nearly identical effects were observed in glucocorticoid-treated animals following heterotopic (hepatic) expression of both carboxylated and uncarboxylated osteocalcin through gene therapy, which additionally led to a reduction in hepatic lipid deposition and improved phosphorylation of the insulin receptor. These data suggest that the effects of exogenous high-dose glucocorticoids on insulin target tissues and systemic energy metabolism are mediated, at least in part, through the skeleton.
Introduction
Glucocorticoids have been used as a therapeutic agent for over 60 years, with significant beneficial outcomes in terms of treating chronic inflammatory conditions such as rheumatoid arthritis, asthma, or inflammatory bowel disease (1, 2). Glucocorticoids are also widely used as cancer therapeutics, for hematological conditions, and in posttransplant management (3). However, particularly when given at higher doses and for extended periods of time, glucocorticoids are associated with multiple and potentially debilitating adverse outcomes, which are often chronic in nature and difficult to treat. These include, but are not limited to, musculoskeletal pathologies such as osteoporosis (4) and sarcopenia (5); metabolic disorders such as glucose intolerance, diabetes mellitus, and dyslipidemia (6, 7); and excessive and abnormal fat accrual (6).
The effects of exogenous glucocorticoids on bone and bone cells have been relatively well established (8, 9). It is understood that glucocorticoids affect the function of all 3 cell types, osteoblasts, osteoclasts, and osteocytes (8, 10), with most of the evidence indicating that osteoblasts are the main skeletal target (10, 11). In humans, the effects of glucocorticoids on the skeleton and particularly the osteoblast are manifested by a rapid and profound suppression of serum markers of bone formation, which correlates with bone loss over time (12). For example, serum levels of osteocalcin, a marker of osteoblast activity (13), are invariably reduced in patients receiving glucocorticoids, even when given at lower doses (12, 14). It has also been documented that glucocorticoids induce an initial stimulation in bone resorption via increases in osteoclastogenesis (8, 15) as well as matrix metalloproteinases (15).
In contrast to these well-documented skeletal effects, the cellular and molecular pathways by which exogenous glucocorticoids exert their detrimental effects on energy and particularly glucose metabolism are less well established (16). Thus, while we know that many (but not all) patients receiving glucocorticoids develop impaired glucose tolerance or even type 2 diabetes (16), it remains unclear exactly how glucocorticoids affect the regulation of fuel metabolism on a molecular and cellular basis. As a result, clinicians are unable to predict which patients will become glucose intolerant or diabetic, and there are not any known strategies to directly prevent these unwanted outcomes.
Osteocalcin is a noncollagenous protein that is unique in that it is synthesized and secreted solely by osteoblasts and undergoes vitamin-K–dependent posttranslational modifications via γ-carboxylation of 3 glutamic acid residues (13, 17). Carboxylated osteocalcin has a high affinity for binding to the mineralized bone matrix. Studies have failed to confirm osteocalcin as a functional contributor to the initial deposition of mineral (18); however, it does affect the growth and maturation of the hydroxyapatite crystals. Other studies suggest that osteocalcin plays a role in bone remodeling (19, 20). In humans, osteocalcin is incompletely carboxylated and therefore circulates in both a fully carboxylated and undercarboxylated or uncarboxylated form (21).
Recent mouse data suggests that osteocalcin may be involved in the control of fuel metabolism via its actions on pancreatic insulin production and secretion as well as insulin sensitivity (22–24). In particular, uncarboxylated osteocalcin has been suggested to act in a hormone-like manner to control energy metabolism (22, 25). The authors indicate that uncarboxylated osteocalcin is responsible for the metabolic actions that they report on pancreatic β cells and insulin-sensitive tissues. These results provide further evidence that the skeleton, through specific products such as osteocalcin, may have an active role in the control of fuel metabolism under normal physiological conditions. Here, we demonstrate that the skeleton and, in particular, mature osteoblasts play a pivotal role in the pathogenesis of glucocorticoid-induced metabolic disorders. Our data are derived from two experimental approaches. First, we used a transgenic mouse model in which intracellular glucocorticoid signaling is disrupted at the prereceptor level exclusively in osteoblasts (26, 27). This enabled us to study the effects of glucocorticoid signaling in osteoblasts on whole-body fuel metabolism, using the same dose of glucocorticoids that we have previously shown to suppress bone formation (10). Second, we induced endogenous heterotopic expression of carboxylated and uncarboxylated osteocalcin by gene therapy in WT mice in order to determine whether osteocalcin is able to prevent, attenuate, or reverse glucocorticoid-induced metabolic dysfunction in our mice.
Results
Prevention of glucocorticoid-induced metabolic dysfunction via targeted transgenic inactivation of glucocorticoid signaling in osteoblasts
Transgenic (Tg) overexpression of the glucocorticoid-inactivating enzyme 11β-hydroxysteroid dehydrogenase type 2 (11bHSD2) under the control of the rat 2.3-kb collagen type I promoter results in disruption of prereceptor glucocorticoid signaling in osteoblasts of Col2.3-11bHSD2 Tg mice and the development of a distinct skeletal phenotype (26–28). To test the hypothesis that the metabolic effects of exogenous glucocorticoids are mediated through the osteoblast, Col2.3-11bHSD2 Tg mice and their WT littermates were treated with 1.5 mg corticosterone (slow-release pellet) per week, or placebo, for 28 days, and phenotypic and functional metabolic parameters were monitored over time or at end point. Both WT and Tg mice were implanted with corticosterone pellets. Corticosterone is the major active circulating glucocorticoid in mice. Clearly elevated levels of corticosterone were present in mouse serum within 3 days of treatment onset. Serum levels of corticosterone peaked at 536 ± 85 nmol/l and 489 ± 79 nmol/l in corticosterone-treated WT and Tg mice, respectively, while remaining within the rodent-specific reference range in placebo-treated WT and Tg animals (149 ± 43 nmol/l and 171 ± 37 nmol/l, respectively).
Disruption of osteoblastic glucocorticoid signaling attenuates glucocorticoid-induced obesity and hyperlipidemia.
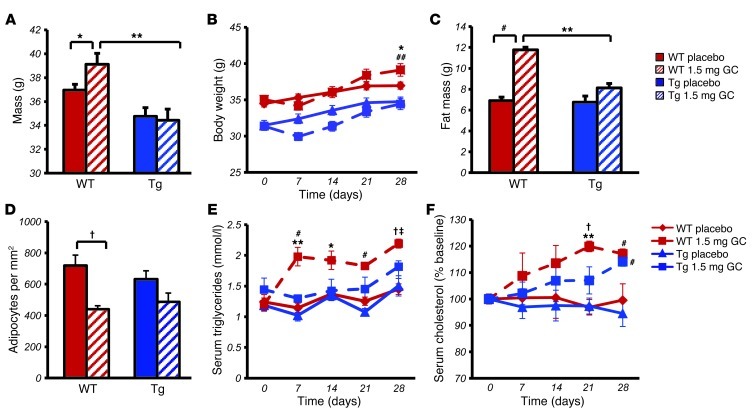
As expected, all mice treated with corticosterone displayed an initial drop in body weight. WT mice treated with corticosterone gained significantly more weight than WT placebo-treated controls (P < 0.05; Figure 1A). By day 28, corticosterone-treated WT mice had gained 4.1 grams in total body weight, compared with 2.5 grams in WT controls. The latter would be considered normal growth-associated weight gain. In contrast, body weight at day 28 did not differ between untreated and corticosterone-treated Col2.3-11bHSD2 Tg mice (Figure 1, A and B), with both untreated and treated Tg mice having gained 3.3 and 3.0 grams, respectively, in total body weight. Compared with placebo-treated WT mice, body weight at end point was slightly lower in both treated and untreated Tg mice, consistent with the known smaller body size of Col2.3-11bHSD2 Tg mice observed in previous studies (26, 28). WT mice treated with corticosterone gained a significantly greater amount of weight than the Tg mice compared with that of their placebo-treated WT controls. This was observed by day 28 (P < 0.05; Figure 1B).
Figure 1. Targeted disruption of glucocorticoid signaling in osteoblasts profoundly affects glucocorticoid-induced changes in body composition and blood lipids.
(A) End point (day 28) body weight of WT and Tg mice treated with 1.5 mg corticosterone (1.5 mg GC) per week or placebo. (B) Body weight of treated WT and Tg mice over the 4-week period. (C) Fat mass in WT and Tg mice at day 28 measured by dual-energy x-ray absorptiometry. (D) Adipose cells per mm2 in H&E-stained sections of gonadal fat pads following 28 days of treatment. (E) Serum triglyceride levels of treated WT and Tg mice over the 4-week period. (F) Serum cholesterol levels of treated WT and Tg mice over the 4-week period. *P < 0.05, #P < 0.01, †P < 0.001 compared with respective genotype placebo-treated controls; ‡P < 0.05, **P < 0.01, ##P < 0.001 WT 1.5 mg GC compared with Tg 1.5 mg GC (2-way ANOVA followed by post-hoc analysis; repeated-measures ANOVA followed by post-hoc analysis for time-dependent measurements; error bars represent SEM).
Body fat mass, as measured by dual-energy x-ray absorptiometry, was significantly increased in corticosterone-treated mice compared with that in placebo-treated WT mice, while being similar in placebo-treated WT and Tg mice and in corticosterone-treated Tg animals (Figure 1C). We further characterized the adipose tissues by measuring adipocyte numbers (cells/mm2) in H&E-stained sections of gonadal fat pads excised from mice following 28 days of corticosterone or placebo treatment. We observed that corticosterone-treated WT mice had significantly fewer cell numbers per mm2 than placebo-treated controls. In contrast, the small difference in cell number seen between placebo- and corticosterone-treated Tg mice was not statistically significant (Figure 1D). These results suggest that cell size was increased in corticosterone-treated WT mice.
Serum triglyceride levels rose significantly in corticosterone-treated WT mice by day 7 and remained significantly higher than both the starting levels on day 0 and the levels of placebo-treated controls from day 7 until day 28. In contrast, corticosterone-treated Tg animals remained at levels similar to and not significantly different from the placebo groups (Figure 1E). There was no overall effect of genotype on triglyceride levels and no interaction between genotype and treatment, as analyzed by a 2-way ANOVA. Tg mice also displayed a delayed increase in serum cholesterol following corticosterone treatment over the 28 days compared with that of WT littermates (Figure 1F).
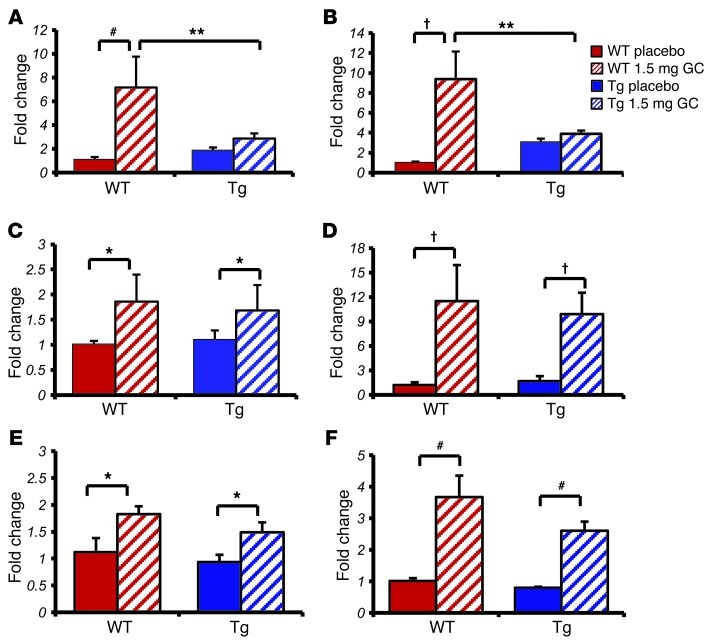
As previously reported, the Col2.3-11bHSD2 transgene is exclusively localized in osteoblasts and osteocytes by immunohistochemical staining (26, 27). To confirm that under the conditions of corticosterone treatment, as used in our study, glucocorticoid signaling is reduced or absent in the osteoblasts of Tg mice, we analyzed the expression of 2 genes known to be induced in WT mice by glucocorticoids: glucocorticoid-induced leucine zipper (Gilz) (29) and FK506-binding protein 5 (Fkbp5) (30). We observed that these genes were induced in the tibias of WT corticosterone-treated mice but not in those of the Tg mice treated with glucocorticoids (Figure 2, A and B).
Figure 2. Targeted disruption of glucocorticoid signaling in osteoblasts affects acute glucocorticoid signaling in osteoblasts but not muscle or liver as shown by qRT-PCR.
(A and B) Quantitative RT-PCR analysis of tibia RNA expression in WT and Tg mice treated for 3 days with either placebo or corticosterone of genes known to be modulated by glucocorticoids: (A) Gilz and (B) Fkbp5. (C and D) Quantitative RT-PCR analysis of muscle RNA expression of (C) Gilz and (D) Fkbp5 in WT and Tg mice treated for 3 days with placebo or corticosterone. (E and F) Quantitative RT-PCR analysis of liver RNA expression of (E) Gilz and (F) Fkbp5 in WT and Tg mice treated for 3 days with placebo or corticosterone. *P < 0.05, #P < 0.01, †P < 0.001 compared with respective genotype placebo-treated controls; **P < 0.01 WT 1.5 mg GC compared with Tg 1.5 mg GC (2-way ANOVA followed by post-hoc analysis; error bars represent SEM).
Muscle and liver tissues are considered to be metabolically active organs, and the expression of GILZ and FKBP5 in these tissues was measured in response to glucocorticoid treatment to confirm that glucocorticoid signaling in these organs was not affected in Tg mice. We observed no differences in the regulation of Gilz and Fkbp5 by glucocorticoid treatment in WT and Tg mice in either muscle or liver RNA extracts (Figure 2, C–F). These results indicate that the expression of the 11βHSD2 transgene in the osteoblasts of Tg mice also does not have any direct impact on the known effects of glucocorticoids in muscle and liver.
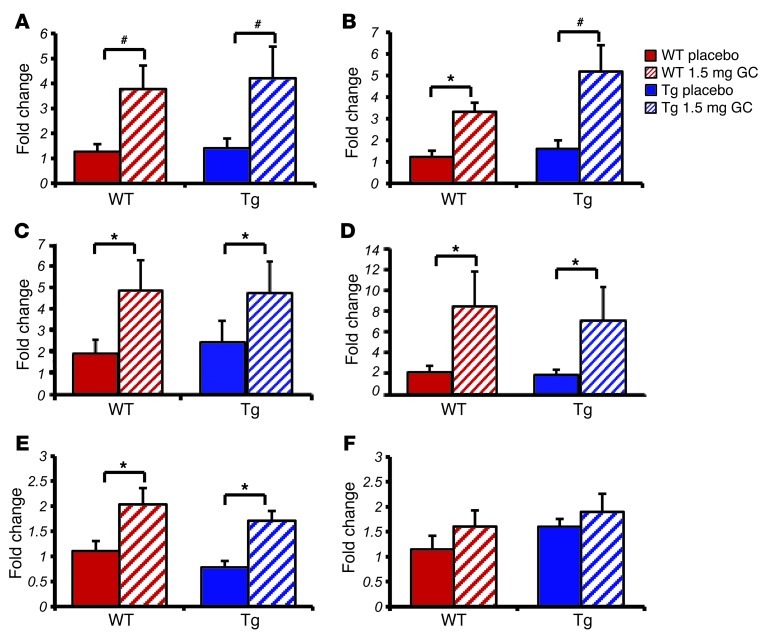
11βHSD2 was not detected by immunohistochemical staining of adipocytes (data not shown). To confirm that glucocorticoid signaling in adipocytes of Tg mice was not affected by the transgene, we measured the expression levels of 6 genes known to be regulated in adipocytes by exogenous glucocorticoids, using qRT-PCR on adipose tissue excised from the mice. We found that Gilz, Fkbp5, 11β-hydroxysteroid dehydrogenase type 1 (Hsd11b1), fatty acid binding protein 4 (Fabp4, also known as adipocyte protein 2 or Ap2), Pparg, and CCAAT-enhancer-binding protein α (Cebpa) were not differently regulated in WT and Tg mice following glucocorticoid treatment (Figure 3). These results indicate that the expression of the 11βHSD2 transgene in the osteoblasts of Tg mice does not have any direct effect on known effects of glucocorticoids in adipocytes.
Figure 3. Targeted disruption of glucocorticoid signaling in osteoblasts does not affect acute glucocorticoid signaling in white adipose tissue as shown by qRT-PCR.
Quantitative RT-PCR analysis of white adipose tissue RNA expression in WT and Tg mice treated for 3 days with either placebo or corticosterone of genes known to be modulated by glucocorticoids: (A) Gilz, (B) Fkbp5, (C) Fabp4, (D) Hsd11b1, (E) Pparg, and (F) Cebpa. *P < 0.05, #P < 0.01 compared with respective genotype placebo-treated controls (2-way ANOVA followed by post-hoc analysis; error bars represent SEM).
Disruption of osteoblastic glucocorticoid signaling prevents glucocorticoid-induced insulin resistance and glucose intolerance.
Corticosterone-induced fat accumulation and hyperlipidemia were significantly attenuated in Tg mice, suggesting that osteoblast-specific glucocorticoid signaling has a role in mediating the metabolic consequences of exogenous glucocorticoids on body composition. As the transgene itself had no effect on genetic markers of adipocyte function and differentiation, we hypothesized that our observations are attributable to changes in fuel metabolism caused by the effects of glucocorticoids on osteoblast function. To test this hypothesis, we performed both insulin tolerance tests (ITTs) and oral glucose tolerance tests (oGTTs) on WT and Tg mice receiving either 1.5 mg corticosterone per week or placebo. Tests were performed at weekly intervals (days 0, 3, 7, 14, 21, and 28) over a 28-day treatment period.
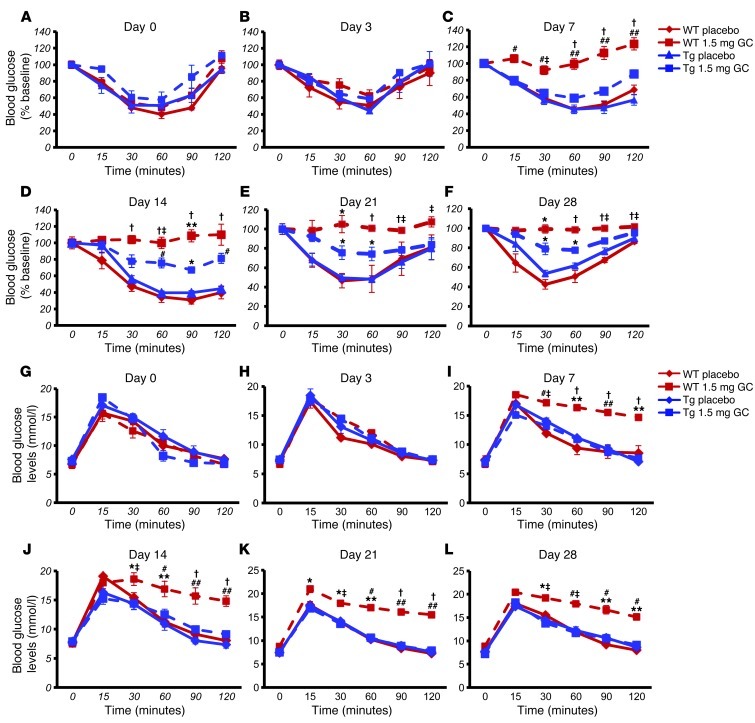
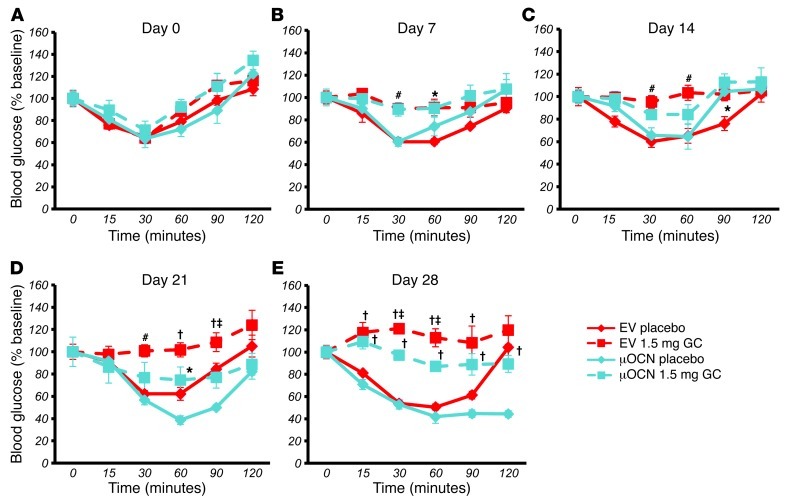
All animals exhibited a similar response to insulin prior to the implantation of corticosterone- or placebo-containing pellets (Figure 4A). This pattern was also observed on day 3 of the treatment (Figure 4B). Placebo-treated WT and placebo-treated Tg mice continued with this same response over the course of the experiment, with a rapid drop in blood glucose following an insulin injection and a return toward baseline values within 2 hours (Figure 4, A–F). As expected, WT mice treated with corticosterone became insulin resistant as early as 7 days into treatment (Figure 4C). It should be noted that osteocalcin levels decreased immediately following treatment of WT mice with corticosterone (i.e., on day 1) and that the change in insulin responsiveness occurred subsequent to the decrease in osteocalcin levels (i.e., on day 7). This resistance was observed until the end of the experiment on day 28, with blood glucose levels remaining unchanged over the 2-hour period following an insulin injection (Figure 4, C–F). In contrast, corticosterone-treated Tg mice showed a normal response to insulin on day 7 (Figure 4C; P < 0.001 at t = 60, 90, and 120 minutes), although partial insulin resistance became evident from day 14 onward. Corticosterone-treated Tg mice, however, continued to exhibit a response to insulin that was significantly different from that of corticosterone-treated WT mice throughout the duration of the experiment. Absolute values are shown in Supplemental Figure 1, A–F.
Figure 4. Targeted disruption of glucocorticoid signaling in osteoblasts partially prevents impaired metabolic responses seen in glucocorticoid-treated WT mice.
(A–F) ITTs in WT (red) and Tg (blue) mice treated with either placebo (solid lines) or 1.5 mg corticosterone per week (dashed lines). (G–L) oGTTs on WT (red) and Tg (blue) mice treated with either placebo (solid lines) or 1.5 mg corticosterone per week (dashed lines). *P < 0.05, #P < 0.01, †P < 0.001 compared with respective genotype placebo-treated controls; ‡P < 0.05, **P < 0.01, ##P < 0.001 WT 1.5 mg GC compared with Tg 1.5 mg GC (repeated-measures ANOVA followed by post-hoc analysis for time-dependent measurements; error bars represent SEM).
oGTTs were performed to determine the effect of disrupted osteoblastic glucocorticoid signaling on glucose metabolism. A bolus dose of 2 g/kg glucose was administered via gavage, and blood glucose levels were monitored over 2 hours. At baseline, all mice showed a physiological response to glucose (Figure 4G). This pattern was also observed on day 3 of the treatment (Figure 4H) and was maintained in placebo-treated WT and Tg animals but also in corticosterone-treated Tg mice throughout the 28-day experimental period. In contrast, corticosterone-treated WT littermates were glucose intolerant from day 7 to day 28 (Figure 4, I–L).
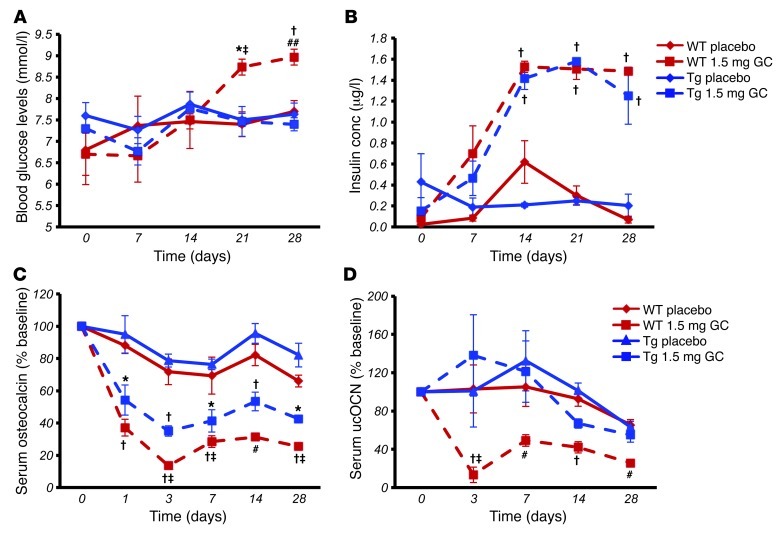
Using data from the above metabolic tests, we analyzed the baseline fasting blood glucose and insulin levels at days 0, 7, 14, 21, and 28. Fasting glucose levels increased in a time-dependent manner in corticosterone-treated WT mice, while no changes in fasting blood glucose levels were observed in corticosterone-treated Tg mice or placebo-treated mice (Figure 5A). Surprisingly, however, we found that corticosterone treatment was associated with a time-dependent significant increase in serum insulin levels regardless of genotype, with no change in the placebo-treated groups (Figure 5B).
Figure 5. Targeted disruption of glucocorticoid signaling in osteoblasts partially prevents impaired metabolic responses seen in glucocorticoid-treated WT mice but has no effect on total serum insulin concentrations.
(A) Baseline fasting blood glucose concentration levels in WT and Tg mice treated with 1.5 mg corticosterone per week or placebo over the 4-week period (day 0, before treatment; day 28, after 4 weeks of treatment). (B) Baseline fasting serum insulin levels in WT and Tg mice treated with 1.5 mg corticosterone per week or placebo over the 4-week period. conc, concentration. (C) Serum total osteocalcin concentrations in WT and Tg mice treated with 1.5 mg corticosterone per week or placebo over the 4-week period (composite of 2 experiments standardized by expression as percentage of baseline). (D) Serum uncarboxylated osteocalcin (unOCN) concentrations in WT and Tg mice treated with 1.5 mg corticosterone per week or placebo over the 4-week period (composite of 2 experiments standardized by expression as percentage of baseline). *P < 0.05, #P < 0.01, †P < 0.001 compared with respective genotype placebo-treated controls; ‡P < 0.05, ##P < 0.001 WT 1.5 mg GC compared with Tg 1.5 mg GC (repeated-measures ANOVA followed by post-hoc analysis for time-dependent measurements; error bars represent SEM).
Taken together, these data suggest that exogenous glucocorticoids, through a suppression of osteoblast activity, impair insulin sensitivity and thereby glucose uptake in insulin target tissues.
Serum total and undercarboxylated osteocalcin levels are suppressed in WT but not in Tg corticosterone-treated mice.
In keeping with clinical observations (12, 14), treatment with exogenous glucocorticoids resulted in a rapid and significant decrease in serum total osteocalcin levels in WT mice (–75% at day 28 compared with baseline; Figure 5C). This effect was still present in Tg mice (58% reduction by day 28 compared with baseline), although serum total osteocalcin levels remained significantly higher than those of corticosterone-treated WT mice (Figure 5C). In placebo-treated mice, serum osteocalcin levels fell slowly over time, consistent with the normal, growth-associated reduction in bone turnover.
We also determined the levels of undercarboxylated osteocalcin in these same mice. We found that in WT mice corticosterone therapy induced a decrease in both serum total and undercarboxylated osteocalcin levels, with no change in the percentage of undercarboxylated osteocalcin. In contrast, undercarboxylated osteocalcin levels remained unchanged in Tg corticosterone-treated mice at all the time points tested (Figure 5D).
Prevention of glucocorticoid-induced metabolic dysfunction by osteocalcin gene therapy
It has recently been reported that osteocalcin may be involved in the regulation of glucose metabolism (22, 23) by modifying insulin secretion and sensitivity (31) as well as pancreatic β cell proliferation (23). Our own findings in Col2.3-11bHSD2 Tg animals led us to reason that the glucocorticoid-induced suppression of osteoblast activity may play a central role in mediating the adverse effects of glucocorticoids on glucose and lipid metabolism. We therefore hypothesized that replacing osteocalcin in the circulation would prevent or at least ameliorate the metabolic changes observed in WT animals exposed to exogenous glucocorticoids. Furthermore, prior studies have pointed to uncarboxylated osteocalcin as the active metabolic regulator (22, 25). We therefore developed a method by which the carboxylation status of the replaced osteocalcin is controlled. This enabled us to determine whether there are any differences between the effects of either carboxylated or uncarboxylated osteocalcin on glucose metabolism.
In our hands, purified native or thermally decarboxylated osteocalcin administered either via injection or slow-release osmotic pumps failed to generate measurable sustained serum osteocalcin levels. We were not able to induce any metabolic effects in untreated or corticosterone-treated animals using these administration techniques. To overcome this problem and to generate measurable and sustained levels of osteocalcin in the circulation, we used hydrodynamic tail vein injection (hTVI) to transfect hepatocytes in vivo with a plasmid containing osteocalcin (OC, also known as Bglap) and a commercially available vector (pLIVE, Mirus Bio), which targets expression to the liver via the minimal mouse albumin promoter and the mouse α-fetoprotein enhancer. This leads to hepatic transgene expression and has been reported to enable secretion of transfected proteins into the circulation (32). In order to control for the carboxylation status of the transfected osteocalcin, we constructed both a WT full-length OC (wtOCN) and a mutant OC (μOCN) plasmid. In the latter, the 3 γ-carboxylation sites (glutamic acid residues or Glu) are substituted with aspartic acid residues (Asp), leading to the expression of an osteocalcin protein that is unable to undergo carboxylation. This method of controlling the carboxylation status of osteocalcin has been previously used to inactivate vitamin K–dependent clotting factors (33). Furthermore, for validation purposes (see below), we cloned green fluorescent protein (gfp) into the pLIVE vector. In all experiments, an empty vector (EV) was used as a control.
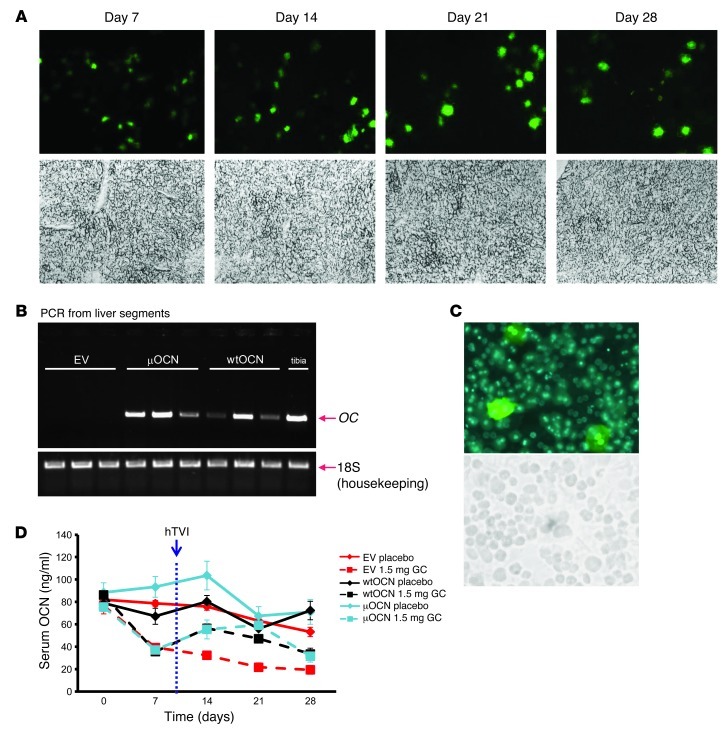
First, transfection via hTVI was validated using the gfp-containing plasmid. Analysis of frozen liver sections confirmed GFP protein expression by hepatocytes at 7, 14, 21, and 28 days after transfection (Figure 6A). Qualitative (end-point) PCR on RNA extracted from whole livers corroborated hepatic osteocalcin (OC) expression in mice receiving the wtOCN or μOCN construct via hTVI (Figure 6B). We further quantified hepatocytic GFP expression by isolating hepatocytes from mice receiving the GFP construct via hTVI. GFP was expressed by 5.5% ± 0.3% of viable hepatocytes 7 days after the transfection (Figure 6C). This is in keeping with results of other in vivo transfections (32).
Figure 6. Validating heterotopic expression following gene therapy using hTVI.
(A) Fluorescent GFP expression in frozen liver sections 7, 14, 21, and 28 days after hTVI of the pLIVE vector containing GFP. Halogen light microscope images of same fields of view appear in the bottom row. Original magnification, ×100. (B) RT-PCR of RNA extracted from liver segments of mice 28 days after hTVI of vectors containing either no cDNA insert (EV) or the wtOCN or the μOCN insert to determine RNA expression of osteocalcin (OC). 18S was amplified as the housekeeping gene for loading reference. RNA was also extracted from mouse tibias as a positive control for OC expression. (C) Fluorescent image of GFP expression in primary hepatocytes isolated from mice 28 days after hTVI of pLIVE vector plus GFP cDNA. A halogen light microscope image of the same field of view appears in the bottom row. Original magnification, ×200. (D) Serum osteocalcin concentrations (measured by IRMA) of EV, wtOCN, and μOCN vector–receiving mice treated with 1.5 mg corticosterone per week or placebo (plc) over the 4-week period.
We then determined whether osteocalcin gene therapy would prevent, or at least ameliorate, the effects of glucocorticoids on glucose metabolism. To this aim, 7-week-old WT mice were treated with 1.5 mg corticosterone per week, or placebo, for 28 days (n = 60), starting on day 0. On day 8, animals received EV (n = 20), wtOCN vector (n = 20), or μOCN vector (n = 20) via hTVI, resulting in the allocation of 10 mice per group of either placebo or glucocorticoid treatment for each of the 3 vectors (Figure 6D).
Baseline osteocalcin levels varied between 70 and 75 ng/ml. During the first 7 days of this experiment, serum osteocalcin levels remained unchanged in placebo-treated mice, whereas mice treated with corticosterone displayed a marked and rapid drop to approximately 40% of baseline at day 7 (39.3 ± 2.0 ng/ml, 37.3 ± 2.3 ng/ml, and 35.6 ± 2.7 ng/ml in corticosterone-treated EV-, wtOCN-, and μOCN-receiving mice, respectively; Figure 6D). Delivery of osteocalcin-containing vectors resulted in an increase in serum osteocalcin concentrations corticosterone-treated groups (55.4 ± 8.4 ng/ml and 56.4 ± 3.9 ng/ml; Figure 6D). Osteocalcin levels in mice receiving the EV and corticosterone continued to decrease, with levels reaching 17% of their initial baseline concentrations (19.3 ± 3.8 ng/ml).
Effect of osteocalcin gene therapy on body weight, composition, and hyperlipidemia in corticosterone-treated mice.
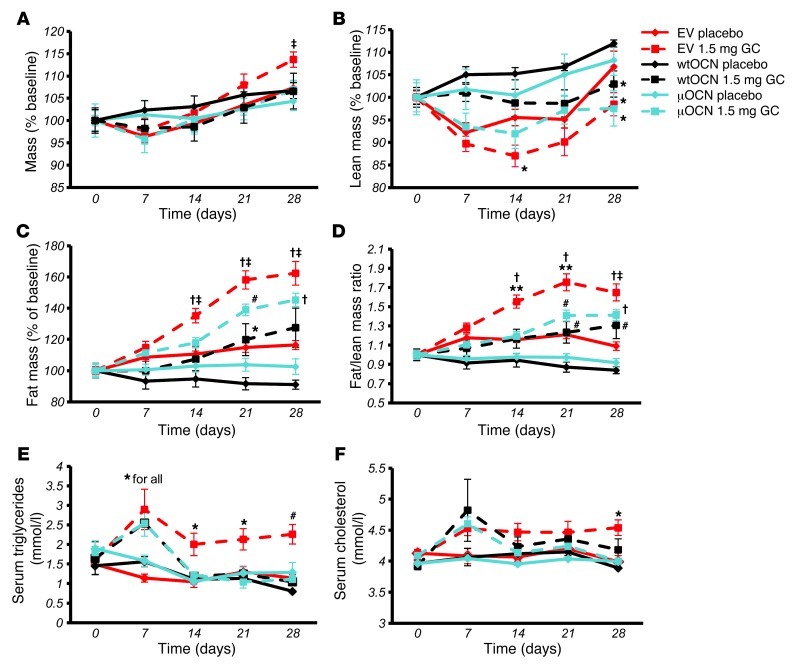
Total body weight gradually increased in all groups, as expected for young adult mice. In mice receiving corticosterone and the EV, total body weight at end point was significantly higher than that in all other groups, including mice receiving corticosterone and the functional osteocalcin vectors (P < 0.05; Figure 7A). In regards to body composition, lean mass was always somewhat lower in the corticosterone-treated mice compared with that in placebo-treated controls receiving the same vector. This was most pronounced in the EV groups, in which the difference was significant as early as day 14 (Figure 7B). Fat mass was markedly increased in EV mice receiving corticosterone, consistent with the increase in total body weight in this group. Corticosterone-treated animals receiving the either the μOCN or the wtOCN vector displayed a smaller increase in body fat mass over time, although total fat mass was significantly higher than that in the respective placebo-treated controls at day 21 and day 28. In the placebo-treated groups, EV mice displayed a slight increase in fat mass, which may be due to normal fat accrual associated with ageing, while the placebo-treated wtOCN and μOCN mice gained no fat mass over the 4-week period and were not significantly different from each other (Figure 7C).
Figure 7. Heterotopic expression of osteocalcin from day 8 reduces glucocorticoid-induced changes in body composition.
(A) Body weight as percentage of baseline of EV, wtOCN, and μOCN vector–receiving mice (vector administered via hTVI on day 8) treated with 1.5 mg corticosterone per week or placebo over the 4-week period. (B) Lean body mass of vector-receiving mice treated over the 4-week period. (C) Body fat mass of vector-receiving mice treated over the 4-week period. (D) Fat/lean mass ratio of vector-receiving mice treated over the 4-week period. (E) Serum triglyceride levels of vector-receiving mice treated over the 4-week period. (F) Serum cholesterol levels of vector-receiving mice treated over the 4-week period (“for all” indicates that significance applies to all groups at this time point). *P < 0.05, #P < 0.01, †P < 0.001 compared with respective vector-receiving placebo-treated controls; ‡P < 0.05, **P < 0.01 compared with other corticosterone-treated groups receiving wtOCN and μOCN vectors (repeated-measures ANOVA followed by post-hoc analysis; error bars represent SEM).
When changes in body composition were expressed as a ratio of fat to lean body mass, we found that mice receiving corticosterone and the EV developed a significantly higher fat/lean mass ratio compared with both their own baseline and corticosterone-treated wtOCN and μOCN vector-receiving mice. While corticosterone-treated mice harboring either of the osteocalcin vectors acquired significantly greater fat/lean mass ratios compared with those of respective placebo-treated controls, these mice never reached significantly greater fat/lean mass ratios than their baseline values (Figure 7D). These changes in fat/lean mass in the EV-receiving corticosterone-treated mice suggests there is a redistribution of energy from muscle to fat.
Serum triglyceride levels at day 7 were significantly higher in all corticosterone-treated mice compared those in placebo-treated controls (Figure 7E). Following the introduction of the vectors at day 8, serum triglyceride levels remained significantly higher in mice receiving the EV, yet fell to levels comparable to those observed in placebo-treated controls in animals receiving either the wtOCN or the μOCN vector. This effect was visible by day 14 and remained for the duration of the experiment (Figure 7E). Serum cholesterol levels increased slightly in all corticosterone-treated mice by day 7 (Figure 7F). Cholesterol levels remained higher in EV-receiving corticosterone-treated mice than in placebo-treated mice, and this difference was significant by day 28. Cholesterol levels fell and remained comparable to those of placebo-treated controls in wtOCN and μOCN vector–receiving mice following the introduction of these vectors (after day 8; Figure 7F).
Glucose metabolism — osteocalcin gene therapy reverses the metabolic effects of glucocorticoid treatment.
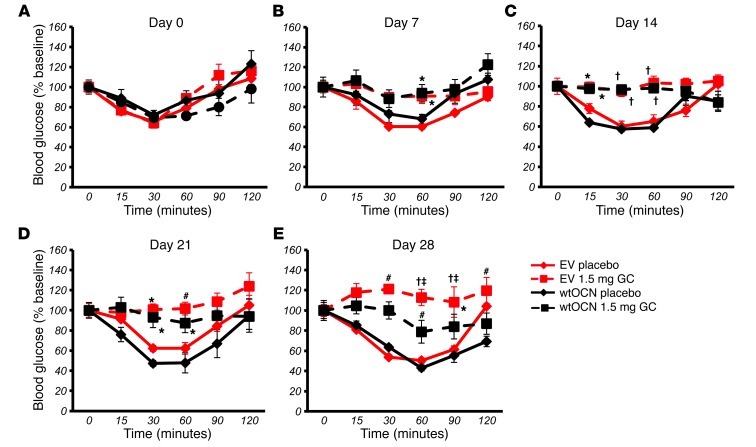
In order to determine whether osteocalcin plays a role in glucocorticoid-induced insulin resistance, we performed ITTs in vector-receiving, corticosterone- or placebo-treated mice at days 0, 7, 14, 21, and 28. A secondary aim was to establish whether carboxylated and uncarboxylated osteocalcin would have different effects on insulin sensitivity in glucocorticoid-treated animals. At baseline (day 0), all mice displayed similar insulin sensitivities (Figure 8A and Figure 9A).
Figure 8. Heterotopic expression of wtOCN improves glucocorticoid-induced insulin resistance.
ITTs in EV- (red) and wtOCN (black) vector–receiving mice (vector administered via hTVI on day 8) treated with either placebo (solid lines) or 1.5 mg corticosterone per week (dashed lines) on (A) day 0, (B) day 7, (C) day 14, (D) day 21, and (E) day 28. *P < 0.05, #P < 0.01, †P < 0.001 compared with respective vector-receiving placebo-treated controls; ‡P < 0.05 compared with other corticosterone-treated groups receiving μOCN or wtOCN vectors (repeated-measures ANOVA followed by post-hoc analysis for time-dependent measurements; error bars represent SEM).
Figure 9. Heterotopic expression of μOCN improves glucocorticoid-induced insulin resistance.
ITTs in EV- (red) and μOCN (blue) vector–receiving mice (vector administered via hTVI on day 8) treated with either placebo (solid lines) or 1.5 mg corticosterone per week (dashed lines) on (A) day 0, (B) day 7, (C) day 14, (D) day 21, and (E) day 28. *P < 0.05, #P < 0.01, †P < 0.001 compared with respective vector-receiving placebo-treated controls; ‡P < 0.05 compared with other CS, corticosterone-treated groups receiving μOCN or wtOCN vectors (repeated-measures ANOVA followed by post-hoc analysis for time-dependent measurements; error bars represent SEM).
All placebo-treated mice continued to display an ITT response that was similar to their baseline response at all time points tested. Mice treated with corticosterone became insulin resistant as early as 7 days after onset of corticosterone treatment (Figure 8B and Figure 9B). For corticosterone-treated mice harboring the EV, this resistance was observed until end point (day 28) (Figure 8, B–E, and Figure 9, B–E). In contrast, corticosterone-receiving mice transfected with the wtOCN vector regained a partial sensitivity to insulin by day 28 and were significantly different from the glucocorticoid-treated EV-receiving group at the 30- and 60-minute time points (Figure 8E). Mice that received the μOCN vector and were treated with glucocorticoids also demonstrated partial protection from insulin resistance, although in this case changes were noted from day 14 (Figure 9, B–E). Absolute values are shown in Supplemental Figure 2, A–J.
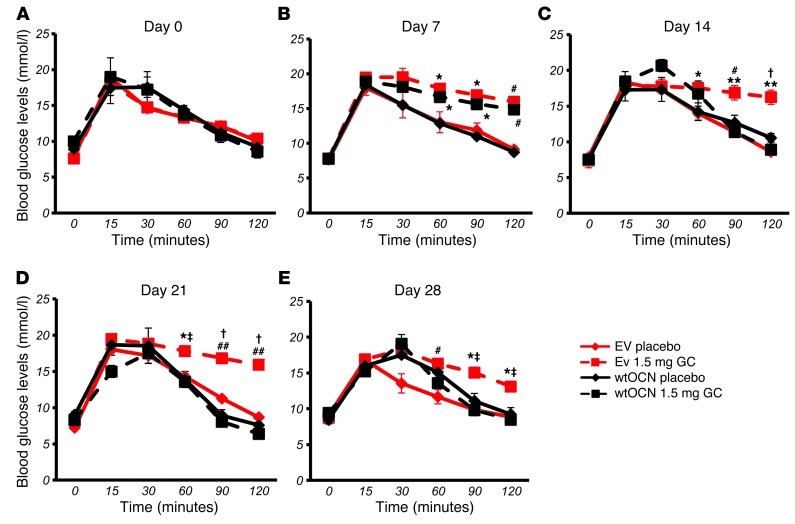
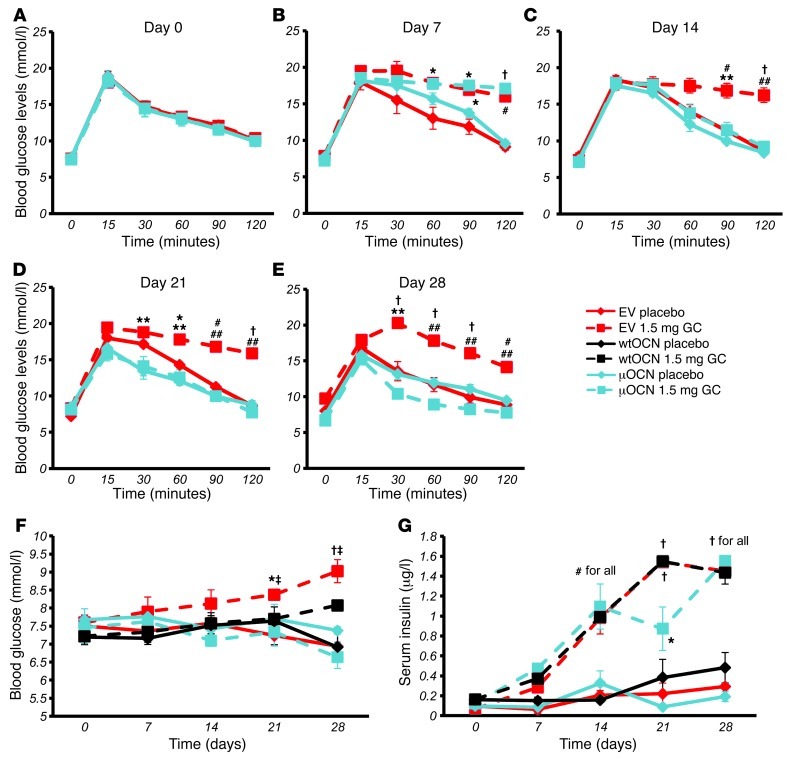
In order to test for changes in glucose handling, we performed oGTTs at day 0 and again at days 7, 14, 21, and 28. At day 0, all groups responded similarly to an orally administered bolus of glucose (2 g/kg body weight; Figure 10A and Figure 11A). At day 7, placebo-treated mice had the same response to glucose that they did at baseline, while mice treated with corticosterone had become glucose intolerant (Figure 10B and Figure 11B). Mice receiving corticosterone and the EV remained intolerant to glucose for the remaining time points measured, days 14, 21, and 28 (Figure 10, C–E, and Figure 11, C–E). In contrast, corticosterone-treated mice receiving the wtOCN or the μOCN vectors regained physiological glucose tolerance from day 14 to day 28 (Figure 10, C–E, and Figure 11, C–E), indicating that the presence of osteocalcin, in both the carboxylated and uncarboxylated forms, enables the mice to handle glucose normally.
Figure 10. Heterotopic expression of wtOCN improves glucocorticoid-induced glucose tolerance.
oGTTs in EV- (red) and wtOCN (black) vector–receiving mice (vector administered via hTVI on day 8) treated with either placebo (solid lines) or 1.5 mg corticosterone per week (dashed lines) on (A) day 0, (B) day 7, (C) day 14, (D) day 21, and (E) day 28. *P < 0.05, #P < 0.01, †P < 0.001 compared with respective vector-receiving placebo-treated controls; ‡P < 0.05, **P < 0.01, ##P < 0.001 compared with other CS, corticosterone-treated groups receiving μOCN or wtOCN vectors (repeated-measures ANOVA followed by post-hoc analysis for time-dependent measurements; error bars represent SEM).
Figure 11. Heterotopic expression of μOCN from day 8 improves glucocorticoid-induced glucose tolerance.
(A–E) oGTTs in EV- (red) and μOCN (blue) vector–receiving mice (vector administered via hTVI on day 8) treated with either placebo (solid lines) or 1.5 mg corticosterone per week (dashed lines) on (A) day 0, (B) day 7, (C) day 14, (D) day 21, and (E) day 28. (F) Baseline fasting blood glucose concentration levels in EV- and wtOCN and μOCN vector–receiving mice treated with 1.5 mg corticosterone per week or placebo over the 4-week period. (G) Fasting serum insulin levels in EV- and wtOCN and μOCN vector–receiving mice treated with 1.5 mg corticosterone per week or placebo over the 4-week period (“for all” indicates that significance applies to all groups at this time point). *P < 0.05, #P < 0.01, †P < 0.001 compared with respective vector-receiving placebo-treated controls; ‡P < 0.05, **P < 0.01, ##P < 0.001 compared with other CS, corticosterone-treated groups receiving μOCN or wtOCN vectors (repeated-measures ANOVA followed by post-hoc analysis for time-dependent measurements; error bars represent SEM).
Using data from the above metabolic tests, we calculated the baseline fasting blood glucose and insulin levels for mice from each of the 6 groups. We again found that corticosterone treatment of mice harboring the EV was associated with a significant and time-dependent increase in fasting blood glucose levels (Figure 11F). In contrast, corticosterone-treated mice transfected with the μOCN construct had fasting blood glucose concentrations indistinguishable from those of placebo-treated mice. Corticosterone-treated animals harboring the wtOCN vector showed a similar picture, except that at end point (day 28) blood glucose levels were significantly higher than those in placebo-treated controls (Figure 11F).
Treatment with corticosterone substantially and time-dependently increased serum insulin levels, regardless of whether the mice had received an empty or OCN-containing vector (Figure 11G). All placebo groups remained unchanged over time regardless of the vector they received.
Lipid deposition in the liver — osteocalcin gene therapy prevents glucocorticoid-induced increased lipid deposition.
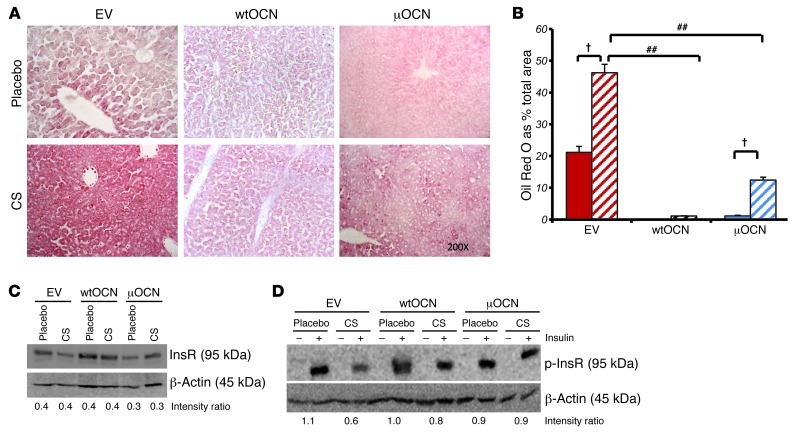
It is well documented that long-term glucocorticoid therapy leads to liver steatosis or fatty liver (34). Based on our findings thus far, we hypothesized that this effect may be associated with the downregulation of osteocalcin. To test this hypothesis, we analyzed lipid deposition in the livers of our experimental mice by Oil Red O staining on frozen liver sections. With an average 21.2% ± 1.85% of total measured area being positive for lipid deposition, placebo-treated EV-receiving mice had little steatosis, although lipid could be identified in the area surrounding the central veins, in which hypoxia may have been present. Lipid deposition was significantly increased in EV-receiving mice treated with corticosterone, with average Oil Red O–stained areas rising to 46.23% ± 2.66% of total measured areas (P < 0.001; Figure 12, A and B). Sections analyzed from placebo-treated mice receiving the wtOCN and μOCN vectors were found to have almost no lipid content, with Oil Red O staining seen in only 0.12% ± 0.01% and 1.15% ± 0.17% of total measured areas, respectively. Corticosterone-treated wtOCN- and μOCN-receiving mice also had very little hepatic lipid accumulation, with staining covering only 1.10% ± 0.06% and 12.41% ± 0.92% of total measured areas, respectively (Figure 12, A and B). While our preliminary studies could find no effect on metabolic parameters when osteocalcin was directly placed into the circulation, gene therapy that produced local pharmacologic doses of the protein were effective. Collectively, our results suggest that the effects of osteocalcin on insulin function predominantly occur in the insulin target organs, such as the liver and muscle. This led us to hypothesize that there were changes also to the insulin signaling pathway in hepatocytes, which is intrinsically involved in liver glucose metabolism.
Figure 12. Heterotopic expression of osteocalcin reduces lipid deposition in the liver and rescues insulin signaling.
(A) Oil Red O staining on frozen liver sections of EV- and wtOCN and μOCN vector–receiving mice treated with 1.5 mg corticosterone per week or placebo. Original magnification, ×200. CS, corticosterone. (B) Quantification of Oil Red O in frozen liver sections. Bars represent the percentage of lipid-stained area over total measured area. (C) Western blot of total InsR of cell lysate collected from isolated primary hepatocytes of EV- and wtOCN and μOCN vector–receiving mice. Cells were treated for 24 hours with either corticosterone (100 mM) or placebo. Density ratios were calculated using Quantity One software. (D) Western blot of phosphorylated InsR (p-InsR) of cell lysate collected from isolated primary hepatocytes of EV- and wtOCN and μOCN vector–receiving mice. Cells were treated for 24 hours with either corticosterone (100 mM) or placebo and stimulated with insulin (50 nM) or placebo 5 minutes before lysis. †P < 0.001 compared with respective vector-receiving placebo-treated controls, ##P < 0.001 compared with other corticosterone-treated groups receiving μOCN vectors (2-way ANOVA followed by post-hoc analysis; error bars represent SEM).
Insulin signaling in target tissues is protected in mice receiving functional osteocalcin vectors.
We therefore performed Western blots using protein extracted from isolated hepatocytes to determine whether insulin signaling was changed in the liver. Isolated hepatocytes were treated for 24 hours with 100 mM corticosterone or vehicle before cells were lysed. We found that the insulin receptor (InsR) was not regulated by either of the vectors or by corticosterone treatment (Figure 12C). In a second experiment, in addition to the above conditions, we also treated the cells with 50 nM insulin or placebo for 5 minutes before cells were lysed. These conditions are known to trigger phosphorylation of the InsR in hepatocytes (35). No phosphorylated InsR was detected in hepatocytes from EV-receiving mice that were not treated with insulin prior to lysis. Stimulating the hepatocyte cultures with insulin for 5 minutes prior to lysis lead to the phosphorylation of the InsR as observed by Western blotting, and this insulin-induced phosphorylation was markedly reduced in EV hepatocytes exposed to corticosterone for 24 hours (lane 4, Figure 12D). Such inhibition of InsR phosphorylation induced by corticosterone was prevented in hepatocytes from mice that received either the wtOCN or μOCN vectors.
Discussion
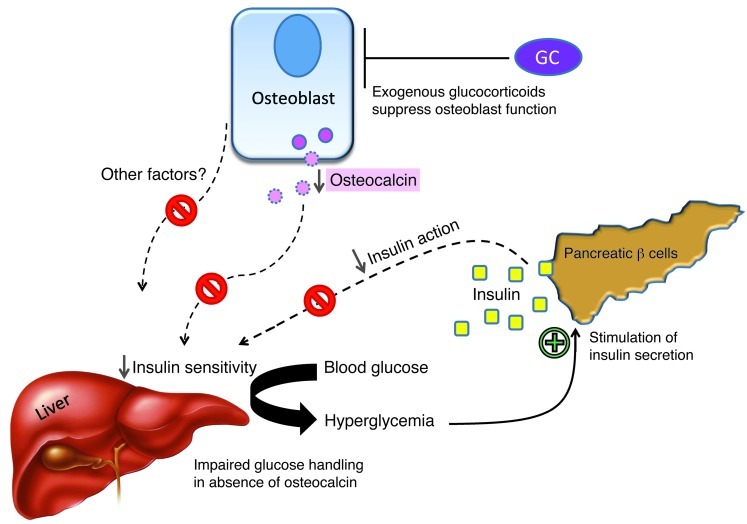
Our studies demonstrate, for the first time to our knowledge, that the skeleton and specifically the osteoblast play a central role in the pathogenesis of the detrimental effects of exogenous high-dose glucocorticoids on systemic fuel metabolism (Figure 13). Recent reports have posited both the osteoblast and the osteoclast as major determinants in the physiological control of murine energy metabolism (22, 25, 31, 36). Our findings now provide a basis for a deeper understanding of the pathophysiology of glucocorticoid-induced diabetes and related metabolic disorders, conditions that are of clinical relevance to a wide range of patients.
Figure 13. Schematic model of the effects exogenous high-dose glucocorticoids on insulin sensitivity and glucose handling in mice.
Under physiological conditions, osteocalcin improves insulin sensitivity in peripheral tissues such as the liver, allowing for efficient glucose handling in times of high insulin release. This action is impaired when glucocorticoids (GCs) interfere with osteoblast activity, suppressing the production and secretion of osteocalcin (and possibly other factors). The lack of osteocalcin leads to decreased insulin sensitivity, which results in impaired hepatic glucose output inhibition, peripheral glucose uptake, hyperglycemia, and a compensatory increase in insulin release, all of which are characteristic features of glucocorticoid-induced (pre-) diabetes. In the absence of osteocalcin, high insulin levels have reduced effects on end-organ glucose uptake.
Glucocorticoid-induced changes in fuel metabolism are mediated by the skeleton.
The enzyme 11bHSD2 inactivates corticosterone, the active glucocorticoid in mice, at the prereceptor level. In Col2.3-11bHSD2 Tg mice, targeted overexpression of this enzyme results in a disruption of normal glucocorticoid signaling exclusively in mature osteoblasts and osteocytes (26). We have recently shown that the skeleton of Col2.3-11bHSD2 Tg mice is protected from the adverse effects of long-term glucocorticoid treatment (10). We now demonstrate that disruption of glucocorticoid signaling in the same cells also prevents, or even reverses, the deleterious effects of exogenous high-dose glucocorticoids on whole-body fuel metabolism. Compared with WT mice, body weight and fat mass accrual, increased adipose cell size, insulin resistance, and glucose intolerance were significantly less pronounced or even absent in corticosterone-treated Col2.3-11bHSD2 Tg mice. These findings clearly indicate that a factor, or several factors, originating from osteoblasts and modified by glucocorticoid signaling in these very cells is responsible for the adverse effects of glucocorticoids on systemic energy metabolism and body composition. The expression of the 11bHSD2 transgene in the osteoblasts of Tg mice does not have any direct effect on the actions of glucocorticoids in adipocytes, as expression levels of genes known to be regulated in adipocytes by exogenous glucocorticoids remained intact. 11bHSD1, an enzyme that converts inactive glucocorticoids to their active metabolites (37), is known to be rapidly upregulated by its substrate (38). Similarly, Fabp4, a member of the fatty acid binding protein family known to be involved in adipocyte differentiation and fatty acid uptake, has been shown to be upregulated by exogenous glucocorticoid treatment (39). PPARγ and CEBPα have been positively correlated with glucocorticoid binding of the GR (40). Glucocorticoid treatment did not differentially regulate Gilz, Fkbp5, Hsd11b1, Fabp4, Pparg, and Cebpa in WT and Tg mice.
Importantly, prereceptor inactivation of corticosterone in osteoblasts also significantly attenuated the otherwise pronounced suppression of osteocalcin synthesis and secretion regularly seen following exogenous glucocorticoid administration. Thus, serum osteocalcin levels were significantly higher in Tg corticosterone-treated mice compared with those in treated WT littermates, in which osteocalcin levels were markedly reduced. The latter observation closely mimics the reduction in bone formation markers invariably seen in patients treated with even low-dose glucocorticoids (12, 14). As previous studies suggested that osteocalcin is involved in normal energy metabolism (22, 25, 31, 36), we sought to further investigate the role of osteocalcin in glucocorticoid-induced dysmetabolism. The possibility that changes in osteocalcin levels are indirectly mediated through the effects of glucocorticoids on osteoclasts has been investigated in a previous study (10). We found that serum levels of the bone resorption marker TRAP5b were increased in glucocorticoid-treated WT animals only. Levels of serum TRAP5b in glucocorticoid-treated Tg mice remained unchanged, as did levels in both WT and Tg placebo-treated groups. These data indicate that changes in serum osteocalcin levels in glucocorticoid-treated Tg mice are unlikely due to the indirect effects of glucocorticoids on osteoclasts. To test whether osteocalcin functions to antagonize the adverse effects of corticosterone on fuel metabolism, it was pivotal to generate and then sustain measurable levels of osteocalcin in the circulation. To this aim, we used the hTVI method of gene therapy and successfully delivered plasmids that contained either no additional insert (EV), the gfp sequences, or the OC or mutant OC cDNA. Hepatic expression of both the wtOCN and μOCN plasmids resulted in a significant and sustained increase in serum osteocalcin levels despite treatment with corticosterone. In contrast, osteocalcin concentrations remained suppressed in glucocorticoid-treated mice carrying the EV. While the latter mice gained significantly in body weight and fat mass in response to corticosterone treatment, these effects were absent in similarly treated but osteocalcin-replete littermates, indicating that mice transfected with the functional osteocalcin vector were able to maintain normal body composition despite glucocorticoid treatment. Indeed, mice receiving both the EV and corticosterone had the lowest lean body mass and the highest percentage of body fat mass of all the groups. The resulting rise in fat/lean mass ratio indicates that corticosterone treatment induces a redistribution of “energy” from muscle to fat.
When the total body fat/lean mass ratio was calculated for mice receiving the functional osteocalcin vectors, no increase was observed compared with baseline ratios. There was, however, a significant increase from day 21 when compared with their respective placebo-treated control groups. This latter point is not surprising as OCN vector-receiving placebo-treated groups had a decrease in their total body fat/lean mass ratio over the 4-week period. This indicates that the presence of osteocalcin itself, expressed heterotopically in the liver, leads to an overall decrease in fat mass, regardless of glucocorticoid treatment. We are yet to uncover the mechanism behind this effect of osteocalcin on body fat in mice; however, this finding does highlight the potential importance of direct effects of osteocalcin on adipose tissue. Not only did osteocalcin expression in the liver lead to a decrease in the total fat mass, but it also, in both the mutant and WT forms, resulted in a reduction in corticosterone-induced hypertriglyceridemia and, albeit to a lesser degree, hypercholesterolemia. These results indicate that osteocalcin may interact with pathway(s) by which glucocorticoids increase circulating lipid levels. This phenomenon is also seen in patients with metabolic syndrome, in which large increases of cortisol are detected alongside significant increases in serum triglyceride and cholesterol levels (41, 42). Recent reports also suggest that low serum osteocalcin levels are often found in patients with metabolic syndrome (43), correlating with high serum triglycerides (44).
Glucocorticoid-induced suppression of osteocalcin modulates the sensitivity of target tissues to insulin without changes to insulin production per se.
Based on the results of our ITTs and oGTTs and previous reports indicating that osteocalcin stimulates β cell proliferation and insulin secretion under physiological conditions (22, 23, 25), we expected that glucocorticoid treatment through the suppression of osteocalcin activity would decrease serum insulin levels, resulting in hypoinsulinemia in our mice. We also expected that this effect would be less pronounced in Tg animals, thereby explaining the observed effects on metabolic function and body composition. In fact, we observed the exact opposite: corticosterone-treated mice exhibited a marked, time-dependent increase in serum insulin levels, regardless of genotype. However, while corticosterone-treated WT mice developed severe hyperglycemia, their identically treated Tg littermates had normal fasting blood glucose levels, which remained unchanged over the experimental period. These results indicate that WT mice became insulin resistant in response to glucocorticoid treatment, as is the case in humans. In contrast, mice with osteoblast-specific disruption of glucocorticoid signaling developed hyperinsulinemia but stayed normoglycemic throughout the experimental period. We interpret these results to mean that WT mice developed complete insulin resistance, while their Tg littermates exhibited a pattern consistent with improved insulin sensitivity at the target tissue level, allowing normal or near normal glucose handling.
We made very similar observations following osteocalcin gene therapy, during which corticosterone-treated mice showed a marked and time-dependent increase in serum insulin levels, regardless of which vector they had received. Thus, insulin levels increased in response to corticosterone treatment despite osteocalcin being replaced. The difference between osteocalcin-depleted and osteocalcin-replete mice was solely seen in blood glucose handling, which was abnormal in the former group and normal in latter group. Furthermore, placebo-treated mice receiving either of the 2 active osteocalcin vectors displayed fasting serum insulin levels that remained unchanged compared with both their own baseline (day 0) and the levels seen in placebo-treated EV mice. This supports the notion that neither total nor uncarboxylated osteocalcin lead to increased serum insulin levels. However, the current data suggest that osteocalcin replacement results in improved peripheral insulin sensitivity, where the lack of hyperglycemia denotes a state of compensated insulin resistance.
Recent studies from both the Karsenty and the Clemens laboratories have shown that osteocalcin plays an important if not central role in normal glucose metabolism via its effects on both insulin production by the pancreatic β cells and insulin sensitivity at the target tissues (22, 23, 31). Our data support the hypothesis that osteocalcin has an effect on insulin sensitivity at the target tissues. It must be noted, however, that we cannot fully conclude that the liver is the target organ for circulating osteocalcin, as the liver itself was targeted for the expression of osteocalcin in our studies. The results of our metabolic tests indicate that replacing osteocalcin in glucocorticoid-treated animals leads to an improvement in both insulin sensitivity and glucose tolerance. In addition, fat mass in our mice is inversely correlated with serum osteocalcin levels, supporting data reported by Ferron and colleagues (22, 23). We did not, however, see a difference in regards to the effects of osteocalcin on pancreatic insulin secretion. Thus, in our model, we did not observe a rise in serum insulin levels in response to the hepatic expression of osteocalcin. This disparity is likely due to differences in the various mouse models investigated. While the previous studies have used models of physiology and obesity (22, 23, 31), our approach focuses on the pathophysiology of glucocorticoid-induced dysmetabolism. Therefore, some of the differences we observed in comparison to previous reports are likely due to the effects of glucocorticoids on tissues other than the skeleton. One of these effects may play a role in the increases we observed in fasting serum insulin levels in all animals treated with corticosterone, regardless of genotype or osteocalcin replacement. There is evidence that glucocorticoids may upregulate preproinsulin in pancreatic islet cells (45) and act as weak stimulators of insulin release (46, 47). Some of our results, indeed, seem to suggest that corticosterone, given at the dose used in this study, is able to stimulate an increase in insulin release in these mice. However, while direct effects of corticosterone on pancreatic islet cells cannot be excluded at this point, our data suggest that the changes in insulin levels seen in our animals are largely driven by peripheral insulin resistance.
Taken together, our results provide evidence that osteocalcin plays a significant role in the sensitivity of insulin target tissues and therefore in the maintenance of whole-body energy metabolism (Figure 13). Our findings further suggest that within the setting of glucocorticoid excess, the metabolic effects of long-term glucocorticoid treatment result from the suppression of osteocalcin synthesis and release by the osteoblast. These changes precede the changes in glucose handling and insulin responsiveness, which are not detected until a week after corticosterone treatment has been established.
Liver responses to overexpression of osteocalcin.
The current data indicate that a marked decrease in serum osteocalcin levels, as is observed following glucocorticoid therapy, correlates with decreased sensitivity of the target tissues to insulin. As the effects of osteocalcin in our mice did not appear to be at the pancreatic level, we decided to study the action of corticosterone on insulin target tissues, in particular the liver.
We found that hepatic expression of osteocalcin-containing vectors prevented glucocorticoid-induced hepatosteatosis. Even the limited lipid storage observed in 12-week-old control mice receiving the EV was almost completely absent in osteocalcin vector–receiving mice. The exact mechanism behind the effect of osteocalcin on lipid deposition or perhaps lipolysis in hepatocytes remains unclear. It is possible that the hyperinsulinemia induced by excess glucocorticoids drives lipogenesis via increased expression of the key transcription factor SREBP-1c or that glucocorticoids directly stimulate lipogenic pathways in liver by altering gene expression (48). It is possible, therefore, that these pathways are activated by glucocorticoids and directly inhibited by osteocalcin. Whether similar effects are present in other metabolically active insulin-sensitive organs, such as muscle and adipose tissue, needs to be investigated.
However, we do provide evidence that osteocalcin plays a role in insulin signaling at the target tissue level. In further experiments, we have therefore focused on insulin signaling pathways in hepatocytes. We found that neither glucocorticoids nor osteocalcin affect the total expression of the InsR, rather a desensitization of the receptor occurs with glucocorticoid treatment, which is protected in the presence of osteocalcin. This desensitization may be a consequence of the effect of glucocorticoids on one of those molecules responsible for InsR dephosphorylation. A large amount of recent work has demonstrated that 2 protein tyrosine phosphatases play major and nonredundant roles in glucose homeostasis and InsR regulation in insulin-sensitive organs, such as the liver and muscle. These are protein tyrosine phosphatase 1B (PTP1B) and T cell protein tyrosine phosphatase (TCPTP) (35, 49). It is possible that desensitization of the InsR in glucocorticoid-treated mice is PTP dependent. Further work on this signaling pathway is necessary to uncover the mechanism behind this effect.
The reduction in InsR phosphorylation was absent in wtOCN and μOCN vector–containing hepatocytes treated with corticosterone. Our findings demonstrate a marked negative effect on insulin signaling in hepatocytes by glucocorticoids and a positive interference in this setting by osteocalcin. It is clear that further studies into the interference of insulin signaling by corticosterone, osteocalcin, and lipid presence are necessary (50). Furthermore, downstream signaling molecules need to be analyzed in this setting, including phosphorylation of insulin receptor substrates 1 and 2 (IRS-1 and IRS-2) and Akt (35) as well as AS160 and Foxo1 (51).
One obvious finding from this study is that there are no major differences between the mutant and WT osteocalcin vectors. Both active osteocalcin vectors do result in similar effects on target tissue insulin sensitivity. The role of this osteoblast-specific protein seems to lie outside of the bone microenvironment, and this study is consistent with the involvement of osteocalcin as a mediator of insulin sensitivity. When treated with corticosterone, WT mice displayed a decrease in the level of both total and undercarboxylated osteocalcin but no change in the proportion of undercarboxylated osteocalcin. This mimics observations in humans treated with glucocorticoids (52). It has also been reported that both the vitamin K–dependent carboxylase activity and the biosynthesis of its substrates are enhanced by glucocorticoids (53, 54). This was not seen in Tg mice, in which glucocorticoid signaling was disrupted in osteoblasts.
In summary, based on our results, we propose that the skeleton, via the osteoblast-osteocyte lineage, plays a pivotal role in the pathogenesis of the severe metabolic changes seen in mice chronically treated with pharmacologic doses of glucocorticoids. Thus, when glucocorticoid signaling is rendered dysfunctional in mature osteoblasts, the effects of exogenously applied glucocorticoids on both osteoblast function (e.g., osteocalcin synthesis) and whole-body fuel metabolism (i.e., insulin sensitivity, glucose handling, weight gain) are either completely absent or greatly attenuated. Based on our observations in Col2.3-11bHSD2 Tg mice and supported by the nearly identical results following gene therapy for heterotopic osteocalcin expression, it is likely that osteocalcin plays a central role in mediating the effects of exogenous glucocorticoids on systemic fuel metabolism. Of note, however, heterotopic expression of osteocalcin resulted not only in improvements of whole-body energy metabolism but also in a reduction of local (i.e., hepatic) lipid deposition and improved phosphorylation of the InsR expressed by liver cells. Depending on the pathophysiological context, osteocalcin may therefore have pleiotropic effects involving actions on lipid deposition, insulin sensitivity, and/or insulin signaling within local target tissues. While we cannot exclude that factors other than osteocalcin may be involved in the regulation of systemic fuel metabolism, our observations provide clear evidence that the deleterious effects of exogenous glucocorticoids on glucose and lipid handling are mediated, at least in part, by the skeleton.
Methods
Animals.
All mice were from a CD-1 background. Col2.3-11bHSD2 mice, in which a truncated 2.3-kb fragment of the proximal promoter and most of the first intron of the rat Pro-a1(I) collagen (Col1a1) gene was cloned with the rat Hsd11b1 cDNA, leading to expression in osteoblasts, were donated by Barbara Kream (University of Connecticut Health Center, Farmington, Connecticut, USA) (26). These mice were crossed with outbred CD-1 mice, resulting in an equal distribution of Tg mice overexpressing 11b-HSD2 in osteoblasts and WT littermates. The presence of Hsd11b2 transgene was tested by PCR of DNA obtained from toe clips (10). Mice were housed up to 5 per cage, maintained under Physical Containment Level 2 laboratory conditions, and had access to water and feed ad libitum except when fasting conditions were required. All animal procedures were approved by the Sydney South West Area Health Services Ethical Committee.
For initial WT versus Tg animal experiments, 8-week-old male Col2.3-11bHSD2 Tg mice (n = 42) and WT littermates (n = 44) were subcutaneously implanted with slow-release pellets containing either 1.5 mg corticosterone or placebo (Innovative Research of America). Following a previously described protocol (55), pellets were implanted at days 0, 7, 14, and 21 in order to achieve continuous suppression of osteoblast function (as indicated by a sustained reduction in serum osteocalcin levels) (55). At day 1 after implantation, serum corticosterone levels peaked at 536 ± 85 nmol/l and 489 ± 79 nmol/l in corticosterone-treated WT and Tg mice, respectively, while serum corticosterone levels remained low in placebo-treated WT and Tg animals, at 149 ± 43 and 171 ± 37 nmol/l, respectively. Serum corticosterone was measured by stable isotope dilution liquid chromatography–tandem mass spectrometry (LC-MS/MS) as described previously (56).
Body mass analysis — PIXImus.
Measurements of lean and fat mass were performed on a Lunar PIXImus Densitometer for mice (GE Medical Systems) at weekly intervals and just prior to sacrifice according to the manufacturer’s instructions.
ITTs.
For ITTs, mice were fasted for 6 hours prior to a baseline blood glucose reading, followed by an intraperitoneal injection of insulin at 0.75 U/kg body weight (Eli Lilly). Blood glucose was then measured at 15, 30, 60, 90, and 120 minutes after insulin injection. Blood was obtained from a tail prick, and blood glucose was measured on glucose strips and an Accu check glucometer (Roche). Blood glucose data is presented as percentage of baseline blood glucose.
oGTTs.
oGTTs were performed following a 6-hour fast by measuring blood glucose on glucose strips and an Accu-check glucometer (Roche) at baseline and at 15, 30, 60, 90, and 120 minutes after oral bolus dose of glucose at 2 g/kg body weight. Blood was obtained as for the ITTs. Blood glucose data is presented as percentage of baseline blood glucose.
Gene therapy — tail vein injection.
OC and mutant OC (the 3 glutamic acid residues, Glu [positions], had been mutated to aspartic acid residues [Asp]) constructs were provided by Caren Gundberg (33). pLIVE expression vector, a vector driven by a liver-specific promoter composed of the minimal mouse albumin promoter and the mouse α-fetoprotein enhancer was purchased from Mirus Bio. To obtain liver expression of osteocalcin, a full-length OC and mutant OC was inserted into the pLIVE expression vector to generate the construct of wtOCN and μOCN, respectively. Green fluorescent protein (gfp) was also constructed into the pLIVE vector as one of the control vectors (GFP).
pLIVE EV, GFP, or wtOCN and μOCN DNA constructs (50 μg/10% volume mouse body weight) were hydrodynamically delivered to mice for expression in the liver. Preparation of DNA for in vivo delivery was performed under sterile conditions as follows: 50 μg of DNA plasmid was diluted into 10% volume mouse body weight of endotoxin-free and sterile Trans IT delivery solution (Mirus). The total injection volume was determined using the following formula: total volume per mouse (ml) = (mouse body weight [g]/10) + 0.1 ml delivery solution.
Animals were kept conscious throughout the procedure to ensure heart rate and blood pressure did not decrease significantly. A restraining canister was used to control movement of mice. Tails were heated in a water bath (40°C) prior to injections for approximately 30 seconds to induce vein dilation for visualization and optimal injection.
The injection was performed with a 26-gauge, one-half inch needle in the ventral tail vein at the distant end of the tail. The complete volume minus 0.1 ml of void volume held within the syringe was dispensed into the tail vein within 4 to 7 seconds at a constant rate to achieve maximum in vivo delivery. Animals were observed until recovery.
For hTVI experimental procedures, 7-week-old male Tg and WT mice were randomly allocated to groups (n = 10 per group) as follows: WT placebo-treated EV; WT 1.5 mg corticosterone-treated EV; WT placebo-treated wtOCN plasmid; WT 1.5 mg corticosterone-treated wtOCN plasmid, WT placebo-treated μOCN plasmid; WT 1.5 mg corticosterone-treated μOCN plasmid; 10 WT mice were allocated to a placebo-treated GFP plasmid group. All mice were treated with either 1.5 mg corticosterone or placebo for 28 days as above, and hTVIs were performed on day 8. Mice were sacrificed on day 28, and organs were removed for ex vivo examination of parameters as discussed below. Blood was collected weekly from all mice and just prior to sacrifice (t = 28 days) for osteocalcin determinations. Weight was monitored weekly throughout the experimental period and just prior to sacrifice.
Gene expression analysis.
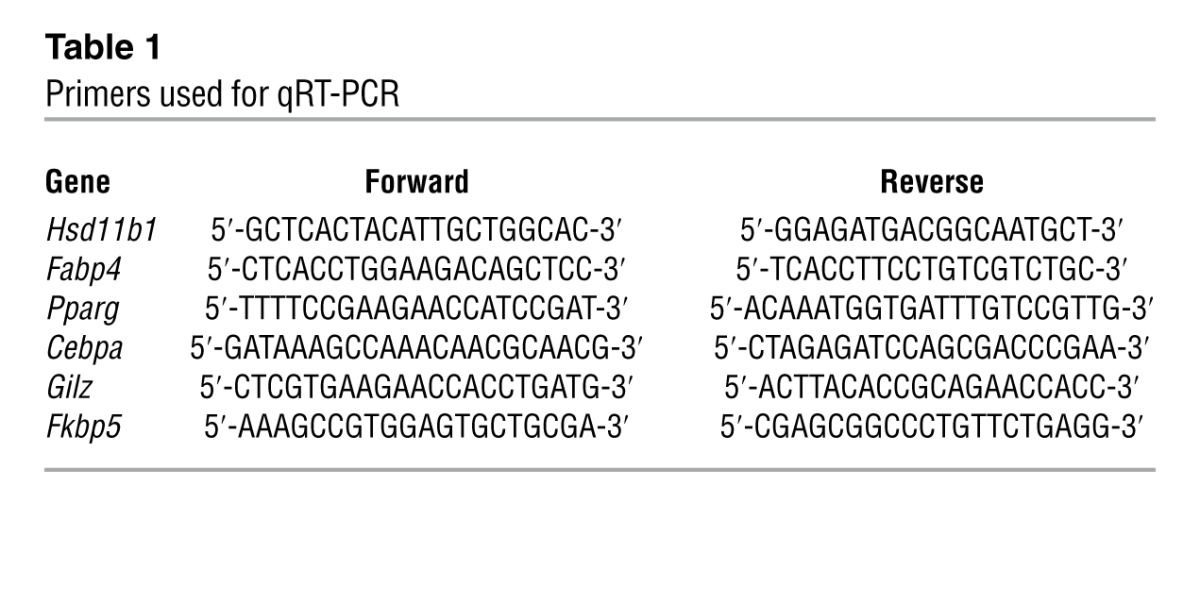
PCR was performed on DNase-treated total RNA extracted from whole mouse tibia, muscle, liver, and adipose tissue collected from the gonadal fat pads using TRIZOL reagent (Invitrogen) and QIAGEN RNeasy mini-kits following sacrifice at day 28. RNA was converted to cDNA using SuperScript III (Invitrogen), and amplification of osteocalcin was performed on an Eppendorf thermo-cycler with Taq SYBR Green Supermix to determine the presence of osteocalcin in the livers of hTVI-transfected mice using the following primers: (forward) 5′-GCTCTGTCTCTCTGACCTCACA-3′ and (reverse) 5′-TAGATGCGTTTGTAGGCGG-3′. 18S was used as an internal reference as described previously (57). Real-time quantitative PCR was used for the determination of fold changes of Hsd11b1, Fabp4, Pparg, Cebpa, Gilz, and Fkbp5 in adipose, tibia, muscle, and liver tissue using the primers described in Table 1. Once again, 18S was used as an internal reference as described previously (57).
Table 1.
Primers used for qRT-PCR
Measurement of total and uncarboxylated serum osteocalcin.
Blood was collected by retro-orbital capillary puncture on anesthetized mice. Total osteocalcin was measured using radioimmunoassay (IRMA) reagents from Immunotopics according to manufacturer’s instructions. Uncarboxylated osteocalcin was measured as described previously (58). In short, serum samples were diluted to an osteocalcin concentration of 40 ng/ml. After incubation with 50 mg/ml hydroxyapatite (Calbiochem/EMB Sciences) for 1 hour at room temperature, the samples were centrifuged for 2 minutes at 10,000 g. Carboxylated osteocalcin binds to the hydroxyapatite. The amount of (nonbound) uncarboxylated osteocalcin was determined in the supernatant using radioimmunoassay (IRMA) reagents as described above. Subsequently, the total amount of uncarboxylated osteocalcin was calculated using the dilution factor.
Measurement of serum corticosterone.
Serum corticosterone was measured by stable isotope dilution LC-MS/MS as described previously (56).
Oil Red O staining.
Livers were excised from mice at the end of the 28-day experimental period. 6- × 5- × 5-mm segments were then cut from the whole livers and fixed in 10% buffered formalin for 24 hours before being soaked in 30% sucrose for 48 hours at 20°C. Liver segments were then embedded in OCT compound (Tissue-Tek), and 10-μm sections were mounted on poly-l-lysine–coated slides. Sections were then air-dried, fixed with formalin, and stained with Oil Red O in 60% isopropanol to observe lipid deposition. ImageJ analysis software (NIH) was used to determine Oil Red O–positive area as a percentage of total area. Positive areas were determined using the default color threshold method, followed by application of the particle analysis tool, which determined whether an area (which could be as small as 1 × 1 pixels) was staining or not. The total sum of all these positive areas in a determined area (in our case, in a micrograph) was then calculated and expressed as a percentage of the total area. Three sections per mouse were analyzed.
Adipose tissue histology.
Gonadal fat pads were used to evaluate adipose tissue. Fat pads were excised from mice at the end of the 28-day experimental period and fixed with 4% paraformaldehyde, embedded in paraffin, sectioned at 7 μm, stained with H&E, and evaluated by histomorphometry at ×200 magnification. Histomorphometric measurements were performed using Osteomeasure software (Osteometrics Inc.).
Isolation of primary hepatocytes.
Hepatocytes were isolated from mice that had received hTVI of EV, wtOCN, or μOCN 28 days prior to the cell isolation procedure. Liver perfusions were carried out on anesthetized mice and performed by cannulation of the portal vein on anesthetized mice; outflow was directed through cutting of the inferior vena cava. Perfusion medium containing Liberase (Roche) enzyme cocktail mix was used to digest the connective tissue, and, after 10 minutes of perfusion, whole livers were transferred to a petri dish in which livers were manually dissociated. The cell suspension was filtered through a 70-μm cell filter, centrifuged at 60 g for 2 minutes at 4°C, and resuspended in 50 ml PBS 5 times. On the final centrifugation, cells were resuspended in 50 ml RPMI plus 5% BSA, and cells were counted on a hemocytometer. For GFP expression, cells were seeded in collagen-coated chamber well slides (250,000 cells per chamber) and incubated in cell culture medium (5% BSA, RPMI-40) under a humidified atmosphere (37°C, 95% O2/5% CO2) for 24 hours before fixing and counterstaining with DAPI.
For protein analysis, cells were plated into collagen-coated 6-well plates (4 × 10⁶ cells per well) and incubated in cell culture medium (5% BSA, RPMI-40) under a humidified atmosphere (37°C, 95% O2/5% CO2). After 2-hour incubation, cells were washed and cell medium changed (RPMI-40 serum free). Following 24-hour incubation, the cells were treated with either placebo or corticosterone at a concentration of 10–8 M. After 24 hours of treatment, cells were treated with insulin (50 nM insulin in serum-free RPMI-40 medium) or vehicle for 5 minutes and washed with PBS. Cells were collected in ice-cold PBS (500 μl), and cells from the same treatment group were pooled and centrifuged (3 minutes, 3,000 g). Cell pellets were resuspended in lysis buffer (50 mM Tris, 150 mM NaCl, 100 mM NaF, 0.1% w/v SDS, 1% v/v Triton X-100, and Roche protease inhibitor and phosphatase inhibitor), left on ice for 30 minutes, and centrifuged (5 minutes, 0°C–4°C, 17,500 g). The lysates were collected and protein concentration was determined using a BCA.
Western blotting.
Cells were lysed in ice-cold lysis buffer (50 mM Tris, 150 mM NaCl, 0.1% SDS, 1% v/v Triton X-100, 100 mM NaF, Complete Protease Inhibitor tablet [Roche], phosphatase inhibitor tablet [PhosSTOP, Roche], pH 7.8). Protein concentrations were determined by Micro BCA assay (Pierce). Equal amounts of protein were subjected to electrophoresis on ready-made NuPage Bis-Tris gels (4%–12%; Invitrogen) and then transferred electrophoretically onto a nitrocellulose membrane. Immunoblotting was performed according to the manufacturer’s instructions for each antibody. Bands were identified using a Kodak Imaging system, using an enhanced chemiluminescent substrate (Western Lightning; PerkinElmer), and band densities were measured by densitometry using Kodak Molecular Imaging Software. Density ratios were calculated using Quantity One (Bio-Rad Laboratories). All antibodies were purchased from Santa Cruz Biotechnology Inc., except for P-InsR (Y1150), which was purchased from Cell Signalling.
Statistics.
All results are presented as mean ± SEM. A 1-way ANOVA, followed by Fisher’s PLSD post-hoc test, was used to determine significant differences between groups when data were parametric. Interactions between the genotype or vector and corticosterone treatment were determined by a 2-way ANOVA. Repeated-measures ANOVA were used to determine statistical significance within groups over time. A P value of less than or equal to 0.05 was considered significant. StatView 5.0 software (SAS Institute Inc.) was used for all analyses.
Study approval.
All animal procedures were approved by the Sydney South West Area Health Services Ethical Committee.
Supplementary Material
Acknowledgments
We are grateful to Janine Street and Markus Herrmann for their technical assistance with animal tissue collection and Elysia Neist for cloning procedures. We thank Barbara Kream for providing the Col2.3-11bHSD2 mice and William Philbrick for making the osteocalcin (wtOCN) and mutant osteocalcin (μOCN) constructs. We would also like to thank Sonia Bustamante and the Bioanalytical Mass Spectrometry Facility at the Universityof New South Wales for mass spectrometry readings of serum corticosterone levels. Support was provided by project grants from the NHMRC (402462 and 632819), and T.C. Brennan-Speranza is the recipient of an NHMRC Early Career Training Fellowship. In addition, support was provided for C. Gundberg by the following NIH grants: Yale Diabetes Endocrinology Research Center DK04735 and Yale Core Center for Musculoskeletal Diseases AR46032. This work was further supported in part by the Bundesministerium für Bildung und Forschung (BMBF) and the State of Berlin, BCRT-Grant I and II to U. Heinevetter and F. Buttgereit, and the DFG (Bu 1015/9-1; SPP1468-Immunobone).
Footnotes
Conflict of interest: The authors have declared that no conflict of interest exists.
Citation for this article: J Clin Invest. 2012;122(11):4172–4189. doi:10.1172/JCI63377.
See the related Commentary beginning on page 3854.
References
- 1.Barnes PJ. How corticosteroids control inflammation: Quintiles Prize Lecture 2005. Br J Pharmacol. 2006;148(3):245–254. doi: 10.1038/sj.bjp.0706736. [DOI] [PMC free article] [PubMed] [Google Scholar]
- 2.Buttgereit F, et al. Efficacy of modified-release versus standard prednisone to reduce duration of morning stiffness of the joints in rheumatoid arthritis (CAPRA-1): a double-blind, randomised controlled trial. Lancet. 2008;371(9608):205–214. doi: 10.1016/S0140-6736(08)60132-4. [DOI] [PubMed] [Google Scholar]
- 3.Kassi E, Moutsatsou P. Glucocorticoid receptor signaling and prostate cancer. Cancer Lett. 2011;302(1):1–10. doi: 10.1016/j.canlet.2010.10.020. [DOI] [PubMed] [Google Scholar]
- 4.Sambrook P, et al. Corticosteroid effects on proximal femur bone loss. J Bone Miner Res. 1990;5(12):1211–1216. doi: 10.1002/jbmr.5650051204. [DOI] [PubMed] [Google Scholar]
- 5.Schakman O, Gilson H, Thissen JP. Mechanisms of glucocorticoid-induced myopathy. J Endocrinol. 2008;197(1):1–10. doi: 10.1677/JOE-07-0606. [DOI] [PubMed] [Google Scholar]
- 6.Gounarides JS, Korach-André M, Killary K, Argentieri G, Turner O, Laurent D. Effect of dexamethasone on glucose tolerance and fat metabolism in a diet-induced obesity mouse model. Endocrinology. 2008;149(2):758–766. doi: 10.1210/en.2007-1214. [DOI] [PubMed] [Google Scholar]
- 7.de Oliveira C, de Mattos AB, Biz C, Oyama LM, Ribeiro EB, do Nascimento CM. High-fat diet and glucocorticoid treatment cause hyperglycemia associated with adiponectin receptor alterations. Lipids Health Dis. 2011;10:11. doi: 10.1186/1476-511X-10-11. [DOI] [PMC free article] [PubMed] [Google Scholar]
- 8.Sivagurunathan S, Muir MM, Brennan TC, Seale JP, Mason RS. Influence of glucocorticoids on human osteoclast generation and activity. J Bone Miner Res. 2005;20(3):390–398. doi: 10.1359/JBMR.041233. [DOI] [PubMed] [Google Scholar]
- 9.Weinstein RS. Clinical practice. Glucocorticoid-induced bone disease. N Engl J Med. 2011;365(1):62–70. doi: 10.1056/NEJMcp1012926. [DOI] [PubMed] [Google Scholar]
- 10.Henneicke H, et al. Corticosterone selectively targets endo-cortical surfaces by an osteoblast-dependent mechanism. Bone. 2011;49(4):733–742. doi: 10.1016/j.bone.2011.06.013. [DOI] [PubMed] [Google Scholar]
- 11.O’Brien CA, et al. Glucocorticoids act directly on osteoblasts and osteocytes to induce their apoptosis and reduce bone formation and strength. Endocrinology. 2004;145(4):1835–1841. doi: 10.1210/en.2003-0990. [DOI] [PubMed] [Google Scholar]
- 12.Prummel MF, Wiersinga WM, Lips P, Sanders GT, Sauerwein HP. The course of biochemical parameters of bone turnover during treatment with corticosteroids. J Clin Endocrinol Metab. 1991;72(2):382–386. doi: 10.1210/jcem-72-2-382. [DOI] [PubMed] [Google Scholar]
- 13.Calvo MS, Eyre DR, Gundberg CM. Molecular basis and clinical application of biological markers of bone turnover. Endocr Rev. 1996;17(4):333–368. doi: 10.1210/edrv-17-4-333. [DOI] [PubMed] [Google Scholar]
- 14.Reid IR, et al. Low serum osteocalcin levels in glucocorticoid-treated asthmatics. J Clin Endocrinol Metab. 1986;62(2):379–383. doi: 10.1210/jcem-62-2-379. [DOI] [PubMed] [Google Scholar]
- 15.Canalis E, Delany AM. Mechanisms of glucocorticoid action in bone. Ann N Y Acad Sci. 2002;966(1):73–81. doi: 10.1111/j.1749-6632.2002.tb04204.x. [DOI] [PubMed] [Google Scholar]
- 16.Besse C, Nicod N, Tappy L. Changes in insulin secretion and glucose metabolism induced by dexamethasone in lean and obese females. Obes Res. 2005;13(2):306–311. doi: 10.1038/oby.2005.41. [DOI] [PubMed] [Google Scholar]
- 17.Gundberg C. Matrix proteins. Osteoporos Int. 2003;14(suppl 5):S37–S40. doi: 10.1007/s00198-003-1471-7. [DOI] [PubMed] [Google Scholar]
- 18.Ducy P, et al. Increased bone formation in osteocalcin-deficient mice. Nature. 1996;382(6590):448–452. doi: 10.1038/382448a0. [DOI] [PubMed] [Google Scholar]
- 19.Ingram RT, Park YK, Clarke BL, Fitzpatrick LA. Age- and gender-related changes in the distribution of osteocalcin in the extracellular matrix of normal male and female bone. Possible involvement of osteocalcin in bone remodeling. J Clin Invest. 1994;93(3):989–997. doi: 10.1172/JCI117106. [DOI] [PMC free article] [PubMed] [Google Scholar]
- 20.Price PA, Otsuka AA, Poser JW, Kristaponis J, Raman N. Characterization of a gamma-carboxyglutamic acid-containing protein from bone. Proc Natl Acad Sci U S A. 1976;73(5):1447–1451. doi: 10.1073/pnas.73.5.1447. [DOI] [PMC free article] [PubMed] [Google Scholar]
- 21.Hauschka PV, Lian JB, Cole DE, Gundberg CM. Osteocalcin and matrix Gla protein: vitamin K-dependent proteins in bone. Physiol Rev. 1989;69(3):990–1047. doi: 10.1152/physrev.1989.69.3.990. [DOI] [PubMed] [Google Scholar]
- 22.Ferron M, Hinoi E, Karsenty G, Ducy P. Osteocalcin differentially regulates β cell and adipocyte gene expression and affects the development of metabolic diseases in wild-type mice. Proc Natl Acad Sci U S A. 2008;105(13):5266–5270. doi: 10.1073/pnas.0711119105. [DOI] [PMC free article] [PubMed] [Google Scholar]
- 23.Ferron M, McKee MD, Levine RL, Ducy P, Karsenty G. Intermittent injections of osteocalcin improve glucose metabolism and prevent type 2 diabetes in mice. Bone. 2012;50(2):568–575. doi: 10.1016/j.bone.2011.04.017. [DOI] [PMC free article] [PubMed] [Google Scholar]
- 24.Kanazawa I, Yamaguchi T, Tada Y, Yamauchi M, Yano S, Sugimoto T. (2011) Serum osteocalcin level is positively associated with insulin sensitivity and secretion in patients with type 2 diabetes. Bone. 2011;48(4):720–725. doi: 10.1016/j.bone.2010.12.020. [DOI] [PubMed] [Google Scholar]
- 25.Lee NK, et al. Endocrine regulation of energy metabolism by the skeleton. Cell. 2007;130(3):456–469. doi: 10.1016/j.cell.2007.05.047. [DOI] [PMC free article] [PubMed] [Google Scholar]
- 26.Sher LB, et al. Transgenic expression of 11beta-hydroxysteroid dehydrogenase type 2 in osteoblasts reveals an anabolic role for endogenous glucocorticoids in bone. Endocrinology. 2004;145(2):922–929. doi: 10.1210/en.2003-0655. [DOI] [PubMed] [Google Scholar]
- 27.Zhou H, et al. Glucocorticoid-dependent Wnt signaling by mature osteoblasts is a key regulator of cranial skeletal development in mice. Development. 2009;136(3):427–436. doi: 10.1242/dev.027706. [DOI] [PubMed] [Google Scholar]
- 28.Kalak R, et al. Endogenous glucocorticoid signalling in osteoblasts is necessary to maintain normal bone structure in mice. Bone. 2009;45(1):61–67. doi: 10.1016/j.bone.2009.03.673. [DOI] [PubMed] [Google Scholar]
- 29.Mittelstadt PR, Ashwell JD. Inhibition of AP-1 by the glucocorticoid-inducible protein GILZ. J Biol Chem. 2001;276(31):29603–29610. doi: 10.1074/jbc.M101522200. [DOI] [PubMed] [Google Scholar]
- 30.Davies TH, Ning Y-M, Sánchez ER. A new first step in activation of steroid receptors. J Biol Chem. 2002;277(7):4597–4600. doi: 10.1074/jbc.C100531200. [DOI] [PubMed] [Google Scholar]
- 31.Fulzele K, et al. Insulin receptor signaling in osteoblasts regulates postnatal bone acquisition and body composition. Cell. 2010;142(2):309–319. doi: 10.1016/j.cell.2010.06.002. [DOI] [PMC free article] [PubMed] [Google Scholar]
- 32.Hibbitt OC, et al. Delivery and long-term expression of a 135 kb LDLR genomic DNA locus in vivo by hydrodynamic tail vein injection. J Gene Med. 2007;9(6):488–497. doi: 10.1002/jgm.1041. [DOI] [PubMed] [Google Scholar]
- 33.Hubbard BR, Jacobs M, Ulrich MM, Walsh C, Furie B, Furie BC. Vitamin K-dependent carboxylation. In vitro modification of synthetic peptides containing the gamma-carboxylation recognition site. J Biol Chem. 1986;264(24):14145–14150. [PubMed] [Google Scholar]
- 34.Macfarlane DP, Forbes S, Walker BR. Glucocorticoids and fatty acid metabolism in humans: fuelling fat redistribution in the metabolic syndrome. J Endocrinol. 2008;197(2):189–204. doi: 10.1677/JOE-08-0054. [DOI] [PubMed] [Google Scholar]
- 35.Fukushima A, et al. T-cell protein tyrosine phosphatase attenuates STAT3 and insulin signaling in the liver to regulate gluconeogenesis. Diabetes. 2010;59(8):1906–1914. doi: 10.2337/db09-1365. [DOI] [PMC free article] [PubMed] [Google Scholar]
- 36.Ferron M, et al. Insulin signaling in osteoblasts integrates bone remodeling and energy metabolism. Cell. 2010;142(2):296–308. doi: 10.1016/j.cell.2010.06.003. [DOI] [PMC free article] [PubMed] [Google Scholar]
- 37.Lakshmi V, Monder C. Purification and characterization of the corticosteroid 11 beta-dehydrogenase component of the rat liver 11 beta-hydroxysteroid dehydrogenase complex. Endocrinology. 1988;123(5):2390–2398. doi: 10.1210/endo-123-5-2390. [DOI] [PubMed] [Google Scholar]
- 38.Bujalska IJ, Quinkler M, Tomlinson JW, Montague CT, Smith DM, Stewart PM. Expression profiling of 11β-hydroxysteroid dehydrogenase type-1 and glucocorticoid-target genes in subcutaneous and omental human preadipocytes. J Mol Endocrinol. 2006;37(2):327–340. doi: 10.1677/jme.1.02048. [DOI] [PubMed] [Google Scholar]
- 39.Tomlinson JJ, Boudreau A, Wu D, Atlas E, Haché RJG. Modulation of early human preadipocyte differentiation by glucocorticoids. Endocrinology. 2006;147(11):5284–5293. doi: 10.1210/en.2006-0267. [DOI] [PubMed] [Google Scholar]
- 40.Chinetti-Gbaguidi G, et al. Peroxisome proliferator-activated receptor-γ activation induces 11β-hydroxysteroid dehydrogenase type 1 activity in human alternative macrophages. Arterioscler Thromb Vasc Biol. 2012;32(3):677–685. doi: 10.1161/ATVBAHA.111.241364. [DOI] [PMC free article] [PubMed] [Google Scholar]
- 41.Anagnostis P, Athyros VG, Tziomalos K, Karagiannis A, Mikhailidis DP. The pathogenetic role of cortisol in the metabolic syndrome: a hypothesis. J Clin Endocrinol Metab. 2009;94(8):2692–2701. doi: 10.1210/jc.2009-0370. [DOI] [PubMed] [Google Scholar]
- 42.Baudrand R, et al. Increased urinary glucocorticoid metabolites are associated with metabolic syndrome, hypoadiponectinemia, insulin resistance and β cell dysfunction. Steroids. 2011;76(14):1575–1581. doi: 10.1016/j.steroids.2011.09.010. [DOI] [PubMed] [Google Scholar]
- 43.Oosterwerff MM, van Schoor NM, Lips P, Eekhoff EMW. Clin Endocrinol (Oxf). Osteocalcin as a predictor of the metabolic syndrome in older persons: a population-based study [published online ahead of print March 21, 2012]. doi: 10.1111/j.1365-2265.2012.04391.x . [DOI] [PubMed] [Google Scholar]
- 44.Yeap BB, et al. Reduced serum total osteocalcin is associated with metabolic syndrome in older men via waist circumference, hyperglycemia, and triglyceride levels. Eur J Endocrinol. 2010;163(2):265–272. doi: 10.1530/EJE-10-0414. [DOI] [PubMed] [Google Scholar]
- 45.Marinelarena AM, Aguayo-Mazzucato C, Bonner-Weir S. Dexamethasone as a regulator of β-cell maturation. Endocr Rev. 2011;32(3):P2–501. [Google Scholar]
- 46.Hult M, et al. Short-term glucocorticoid treatment increases insulin secretion in islets derived from lean mice through multiple pathways and mechanisms. Mol Cell Endocrinol. 2009;301(1–2):109–116. doi: 10.1016/j.mce.2008.09.038. [DOI] [PubMed] [Google Scholar]
- 47.Strack AM, Sebastian RJ, Schwartz MW, Dallman MF. Glucocorticoids and insulin: reciprocal signals for energy balance. Am J Physiol. 1995;268(1):R142–R149. doi: 10.1152/ajpregu.1995.268.1.R142. [DOI] [PubMed] [Google Scholar]
- 48.Haas Joel T, et al. Hepatic insulin signaling is required for obesity-dependent expression of SREBP-1c mRNA but not for feeding-dependent expression. Cell Metab. 2012;15(6):873–884. doi: 10.1016/j.cmet.2012.05.002. [DOI] [PMC free article] [PubMed] [Google Scholar]
- 49.Tiganis T. FEBS J. PTP1B and TCPTP – nonredundant phosphatases in insulin signaling and glucose homeostasis [published online ahead of print March 10, 2012]. doi: 10.1111/j.1742-4658.2012.08563.x . [DOI] [PubMed] [Google Scholar]
- 50.Gathercole LL, Morgan SA, Bujalska IJ, Hauton D, Stewart PM, Tomlinson JW. Regulation of lipogenesis by glucocorticoids and insulin in human adipose tissue. PLoS One. 2011;6(10):e26223. doi: 10.1371/journal.pone.0026223. [DOI] [PMC free article] [PubMed] [Google Scholar]
- 51.Brandon AE, et al. The evolution of insulin resistance in muscle of the glucose infused rat. Arch Biochem Biophys. 2011;509(2):133–141. doi: 10.1016/j.abb.2011.03.008. [DOI] [PMC free article] [PubMed] [Google Scholar]
- 52.Hozuki T, et al. Response of serum carboxylated and undercarboxylated osteocalcin to risedronate monotherapy and combined therapy with vitamin K(2) in corticosteroid-treated patients: a pilot study. Intern Med. 2010;49(5):371–376. doi: 10.2169/internalmedicine.49.2551. [DOI] [PubMed] [Google Scholar]
- 53.Gilbert KA, Rannels SR. Glucocorticoid effects on vitamin K-dependent carboxylase activity and matrix Gla protein expression in rat lung. Am J Physiol Lung Cell Mol Physiol. 2003;285(3):L569–L577. doi: 10.1152/ajplung.00426.2002. [DOI] [PubMed] [Google Scholar]
- 54.Wallin R, Hutson SM. Dexamethasone stimulates vitamin K-dependent carboxylase activity in neonatal rats and cultured fetal hepatocytes. Pediatr Res. 1991;30(3):281–285. doi: 10.1203/00006450-199109000-00017. [DOI] [PubMed] [Google Scholar]
- 55.Herrmann M, et al. The challenge of continuous exogenous glucocorticoid administration in mice. Steroids. 2009;74(2):245–249. doi: 10.1016/j.steroids.2008.11.009. [DOI] [PubMed] [Google Scholar]
- 56.Simanainen U, et al. Long-term corticosterone treatment induced lobe-specific pathology in mouse prostate. Prostate. 2011;71(3):289–297. doi: 10.1002/pros.21242. [DOI] [PubMed] [Google Scholar]
- 57.Zhou H, Mak W, Zheng Y, Dunstan CR, Seibel MJ. Osteoblasts directly control lineage commitment of mesenchymal progenitor cells through Wnt signaling. J Biol Chem. 2008;283(4):1936–1945. doi: 10.1074/jbc.M702687200. [DOI] [PubMed] [Google Scholar]
- 58.Gundberg CM, Nieman SD, Abrams S, Rosen H. Vitamin K status and bone health: an analysis of methods for determination of undercarboxylated osteocalcin. J Clin Endocrinol Metab. 1998;83(9):3258–3266. doi: 10.1210/jc.83.9.3258. [DOI] [PubMed] [Google Scholar]
Associated Data
This section collects any data citations, data availability statements, or supplementary materials included in this article.


