

Abstract
Many disorders are associated with altered serum protein concentrations, including malnutrition, cancer, and cardiovascular, kidney, and inflammatory diseases. Although these protein concentrations are highly heritable, relatively little is known about their underlying genetic determinants. Through transethnic meta-analysis of European-ancestry and Japanese genome-wide association studies, we identified six loci at genome-wide significance (p < 5 × 10⁻⁸) for serum albumin (HPN-SCN1B, GCKR-FNDC4, SERPINF2-WDR81, TNFRSF11A-ZCCHC2, FRMD5-WDR76, and RPS11-FCGRT, in up to 53,190 European-ancestry and 9,380 Japanese individuals) and three loci for total protein (TNFRS13B, 6q21.3, and ELL2, in up to 25,539 European-ancestry and 10,168 Japanese individuals). We observed little evidence of heterogeneity in allelic effects at these loci between groups of European and Japanese ancestry but obtained substantial improvements in the resolution of fine mapping of potential causal variants by leveraging transethnic differences in the distribution of linkage disequilibrium. We demonstrated a functional role for the most strongly associated serum albumin locus, HPN, for which Hpn knockout mice manifest low plasma albumin concentrations. Other loci associated with serum albumin harbor genes related to ribosome function, protein translation, and proteasomal degradation, whereas those associated with serum total protein include genes related to immune function. Our results highlight the advantages of transethnic meta-analysis for the discovery and fine mapping of complex trait loci and have provided initial insights into the underlying genetic architecture of serum protein concentrations and their association with human disease.
Main Text
Albumin, the major plasma protein, transports endogenous and exogenous compounds such as nutrients, hormones, metabolic catabolites, and drugs and maintains intravascular volume by generating oncotic pressure. Diverse conditions, including cancer, liver and kidney diseases, and acute and chronic inflammatory states, manifest reduced plasma albumin concentrations. Low plasma albumin is associated with increased risk of cardiovascular disease1 and mortality.2 Gamma globulins, the second most abundant type of plasma protein, are composed primarily of immunoglobulins (Ig), the effector arm of humoral immunity. Dysregulation of Ig may result from altered production in infectious and autoimmune diseases and in immunodeficiency syndromes and from increased loss in kidney disease.3 To date, little is known about the genetic regulation of plasma proteins, and the pathophysiologic mechanisms leading to low albumin concentrations in many acute and chronic disease conditions remain obscure. Genetic tools may allow for the discovery of pathways in the metabolism, regulation, and/or disease processes associated with changes in these proteins and may provide insights into the immune system, cancer, inflammatory diseases, and malnutrition.
Serum albumin heritability estimates range from 0.36 to 0.77 in family and twin studies.4–7 Recent genome-wide association studies (GWASs) of populations of eastern Asian ancestry have revealed genetic loci contributing to variation in blood protein concentrations: GCKR (MIM 600842)-FNDC4 (MIM 611905) to serum albumin,8 TNFRSF13B (MIM 604907) to total protein,8 and RPS11 (MIM 180471)-FCGRT (MIM 601437) to both traits.8,9 These associations have not been previously examined in other ancestry groups, and much of the heritability of blood protein concentrations remains unexplained. To bridge this gap in our understanding of the genetic architecture of serum protein concentrations, we began by performing a meta-analysis of European-ancestry GWASs for albumin and total protein. Subsequently, we combined the European meta-analysis with data from a GWAS of Japanese ancestry with the aim of (1) identifying additional loci through increased sample size, (2) assessing the evidence of heterogeneity in allelic effects between ethnic groups, and (3) improving the resolution of fine mapping in associated regions by leveraging the expected differences in the structure of linkage disequilibrium (LD) between diverse populations.
The European-ancestry meta-analysis consisted of 53,190 individuals (from 20 GWASs) for serum albumin and 25,539 individuals (from six GWASs) for total protein (Tables S1–S3 and Supplemental Data available online). The procedures followed were approved by the institutional review board committees and are in accordance with the ethical standards of the institutional committees on human experimentation. All participants have given informed consent. Sample and SNP quality control (QC) were undertaken within each study. Each GWAS was then imputed at up to 2.5M autosomal SNPs with the use of CEU (Utah residents with ancestry from northern and western Europe from the CEPH collection) samples from phase II of the International HapMap Project.10 Each SNP with minor allele frequency (MAF) >1% that passed QC was tested for association with serum albumin and total protein under an additive model after adjustment for study-specific covariates. The results of each GWAS were corrected for residual population structure using the genomic control inflation factor11 and were combined via fixed-effect inverse-variance-weighted meta-analysis. The results of the meta-analysis were subsequently corrected by a second round of genomic control (λGC = 1.04 for serum albumin and λGC = 1.02 for total protein) to allow for population differences between studies.
The European-ancestry meta-analysis identified six genome-wide significant loci (p < 5 × 10⁻⁸) for serum albumin and two for total protein (Table 1, Figure S1). These included association signals for serum albumin at HPN (MIM 142440)-SCN1B (MIM 600235) (p = 3.3 × 10⁻¹⁵), SERPINF2 (MIM 613168)-WDR81 (MIM 614218) (p = 6.8 × 10⁻¹³), TNFRSF11A (MIM 603499)-ZCCHC2 (p = 3.9 × 10⁻⁹), and FRMD5-WDR76 (p = 2.0 × 10⁻⁸) and for total protein on chromosome 6q21.3 (p = 3.4 × 10⁻⁹). We also confirmed the associations previously reported in eastern Asian populations at GCKR-FNDC4 (p = 2.9 × 10⁻¹⁴) and RPS11-FCGRT (p = 3.2 × 10⁻⁸) for serum albumin and TNFRSF13B (p = 1.3 × 10⁻¹⁰) for total protein. Inspection of the HPN-SCN1B locus (Figure 1) provided evidence for two independent association signals for serum albumin (rs4806073, p = 3.3 × 10⁻¹⁵; rs11671010, p = 1.9 × 10⁻¹³; CEU r2 = 0.02, 4.3 kb apart). To perform conditional analyses at this locus, we applied genome-wide complex trait analysis (GCTA)12 to the results of the European-ancestry meta-analysis and individual-level genotype data from the Atherosclerosis Risk in Communities Study (8,127 European American individuals, Table S1) and confirmed that both SNPs remained genome-wide significant after adjustment for the effect of the other (rs4806073, p = 1.6 × 10⁻¹²; rs11671010, p = 1.5 × 10⁻¹¹).
Table 1.
Loci Achieving Genome-wide Significance for Serum Albumin and Total Protein in European-Ancestry Populations
| Lead SNP | Chr | Position (Build 36) |
Alleles |
EAF | Beta | SE | p Value | Sample Size | Locus | |
|---|---|---|---|---|---|---|---|---|---|---|
| Effect | Other | |||||||||
| Serum Albumin | ||||||||||
| rs4806073 | 19 | 40,247,030 | C | T | 0.93 | 0.0257 | 0.0033 | 3.3 × 10⁻¹⁵ | 53,187 | HPN-SCN1B |
| rs1260326 | 2 | 27,584,444 | T | C | 0.41 | 0.0124 | 0.0016 | 2.9 × 10⁻¹⁴ | 53,189 | GCKR-FNDC4 |
| rs11078597 | 17 | 1,565,113 | C | T | 0.18 | 0.0205 | 0.0029 | 6.8 × 10⁻¹³ | 38,231 | SERPINF2-WDR81 |
| rs13381710 | 18 | 58,304,309 | G | A | 0.30 | 0.0108 | 0.0018 | 3.9 × 10⁻⁹ | 53,189 | TNFRSF11A-ZCCHC2 |
| rs16948098 | 15 | 42,006,899 | A | G | 0.06 | 0.0229 | 0.0041 | 1.9 × 10⁻⁸ | 53,189 | FRMD5-WDR76 |
| rs739347 | 19 | 54,693,197 | T | C | 0.89 | 0.0186 | 0.0034 | 3.2 × 10⁻⁸ | 38,231 | RPS11-FCGRT |
| Total Protein | ||||||||||
| rs3751991 | 17 | 16,776,011 | A | C | 0.11 | 0.0377 | 0.0059 | 1.3 × 10⁻¹⁰ | 25,537 | TNFRSF13B |
| rs204999 | 6 | 32,217,957 | A | G | 0.74 | 0.0251 | 0.0042 | 3.4 × 10⁻⁹ | 25,537 | 6q21.3 |
Genome-wide significance is defined as p < 5 × 10⁻⁸. The following abbreviations are used: Chr, chromosome; and EAF, effect allele frequency.
Figure 1.
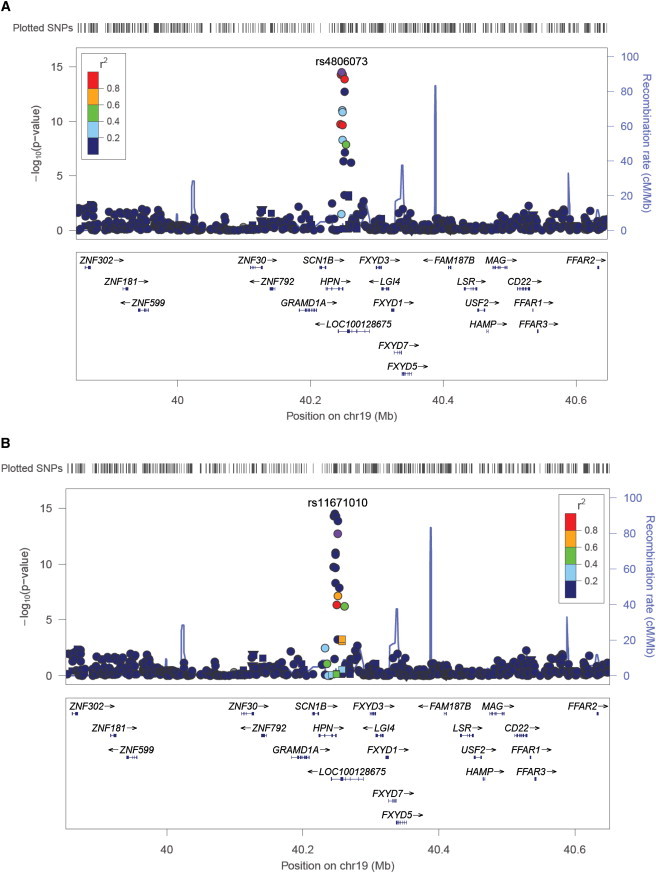
Signal Plot of the HPN-SCN1B Locus for Serum Albumin
The two panels present signal plots from the fixed-effect meta-analyses of European-ancestry individuals showing evidence for two independent associations in the region only: (A) SNPs tagged by rs4806073 and (B) SNPs tagged by rs11671010. In each panel, the lead SNP is represented by the purple circle. Each point represents a SNP plotted with their p (on a log10 scale) as a function of genomic position (build 36). The color coding of all other SNPs indicates LD with the lead SNP (estimated by CEU r2 from phase II HapMap): red, r2 ≥ 0.8; gold, 0.6 ≤ r2<0.8; green, 0.4 ≤ r2<0.6; cyan, 0.2 ≤ r2<0.4; blue, r2<0.2; and gray, r2 unknown. Recombination rates are estimated from the International HapMap Project, and gene annotations are taken from the University of California Santa Cruz genome browser.
The results of the European meta-analysis were then combined with a Japanese-ancestry GWAS (BioBank Japan Project) consisting of 9,380 individuals for serum albumin and 10,168 individuals for total protein (Tables S1–S3, Supplemental Data). Sample and SNP QC were undertaken within the BioBank Japan Project. The GWAS was imputed at up to 2.5 M autosomal SNPs with the use of Han Chinese in Beijing and Japanese in Tokyo (CHB+JPT) samples from phase II of the International HapMap Project.10 Each SNP with MAF >1% that passed QC was then tested for association with serum albumin and total protein in the BioBank Japan Project under an additive model after adjustment for age and sex, and the results were corrected for residual population structure with the genomic control inflation factor (λGC = 0.98 for serum albumin and λGC = 1.08 for total protein). The European meta-analysis and the BioBank Japan Project GWAS were then combined via transethnic meta-analysis implemented with MANTRA (meta-analysis of transethnic association studies).13 This approach has the advantage of allowing for heterogeneity in allelic effects between ancestry groups by assigning studies to clusters according to a Bayesian partition model of similarity in terms of their allele frequency profile. Studies assigned to the same cluster have the same allelic effect. However, each cluster can have different allelic effects. Fixed-effect meta-analysis is thus equivalent to a Bayesian partition model with a single cluster of studies.
We observed strong evidence of association, as defined by a log10 Bayes factor (BF) of 5 (equivalent to prior odds of association of any SNP with either trait of 1:100,000),14 at all identified loci for both traits (Table 2, Figure S2). These loci included RPS11-FCGRT for total protein, which was previously observed in eastern Asian populations but not at genome-wide significance in our European-ancestry meta-analysis. The only exception was at the FRMD5-WDR76 locus (log10BF = 4.79), where the lead SNP from the European meta-analysis (rs16948098) was not observed in the Japanese GWAS and is monomorphic in eastern Asian (CHB and JPT) HapMap populations.10 Using the threshold of log10BF > 5 for strong evidence of association, we identified two additional “potential” loci for serum albumin and four for total protein (Table 2).
Table 2.
Loci with Strong Evidence of Association with Serum Albumin and Total Protein after Transethnic MANTRA Analysis of European-Ancestry and Japanese GWASs
| Lead SNP | Chr | Position (Build 36) |
Alleles |
European Ancestry GWAS Meta-analysis |
Japanese GWAS |
MANTRA Transethnic Meta-analysis |
Locus | ||||||||||
|---|---|---|---|---|---|---|---|---|---|---|---|---|---|---|---|---|---|
| Effect | Other | EAF | Beta | SE | p Value | Sample Size | EAF | Beta | SE | p Value | Sample Size | log10BF Association | log10BF Heterogeneity | ||||
| Serum Albumin Established Loci | |||||||||||||||||
| rs1260326 | 2 | 27,584,444 | T | C | 0.41 | 0.0124 | 0.0016 | 2.9 × 10⁻¹⁴ | 53,189 | 0.56 | 0.0270 | 0.0050 | 2.2 × 10⁻⁸ | 9,380 | 17.01 | 0.28 | GCKR-FNDC4 |
| rs4806073 | 19 | 40,247,030 | C | T | 0.93 | 0.0257 | 0.0033 | 3.3 × 10⁻¹⁵ | 53,187 | 0.92 | 0.0380 | 0.0090 | 1.3 × 10⁻⁵ | 9,380 | 15.81 | −0.08 | HPN-SCN1B |
| rs11078597 | 17 | 1,565,113 | C | T | 0.18 | 0.0205 | 0.0029 | 6.8 × 10⁻¹³ | 38,231 | 0.18 | 0.0200 | 0.0060 | 1.8 × 10⁻³ | 9,380 | 12.51 | 0.20 | SERPINF2-WDR81 |
| rs694419 | 18 | 58,277,092 | T | C | 0.52 | 0.0093 | 0.0016 | 1.2 × 10⁻⁸ | 53,189 | 0.05 | 0.0180 | 0.0110 | 9.2 × 10⁻² | 9,380 | 7.05 | −0.11 | TNFRSF11A-ZCCHC2 |
| rs2280401 | 19 | 54,691,821 | A | G | 0.17 | 0.0121 | 0.0024 | 7.6 × 10⁻⁷ | 53,189 | 0.16 | 0.0240 | 0.0070 | 3.1 × 10⁻⁴ | 9,380 | 6.96 | 0.13 | RPS11-FCGRT |
| rs16948098 | 15 | 42,006,899 | A | C | 0.06 | 0.0229 | 0.0041 | 1.9 × 10⁻⁸ | 53,189 | 0.00 | 4.79 | FRMD5-WDR76 | |||||
| Serum Albumin Additional Potential Loci | |||||||||||||||||
| rs2293579 | 11 | 47,397,334 | A | G | 0.40 | 0.0093 | 0.0017 | 8.0 × 10⁻⁸ | 53,189 | 0.26 | 0.0030 | 0.0050 | 5.7 × 10⁻¹ | 9,380 | 5.61 | −0.05 | PSMC3 |
| rs12914385 | 15 | 76,685,778 | C | T | 0.61 | 0.0064 | 0.0016 | 8.7 × 10⁻⁵ | 53,189 | 0.70 | 0.0200 | 0.0050 | 1.3 × 10⁻⁴ | 9,380 | 5.07 | 0.12 | CHRNA3- CHRNA5 |
| Total Protein Established Loci | |||||||||||||||||
| rs4561508 | 17 | 16,789,475 | T | C | 0.11 | 0.0360 | 0.0060 | 1.3 × 10⁻⁹ | 25,534 | 0.37 | 0.0470 | 0.0700 | 2.0 × 10⁻¹¹ | 10,168 | 16.25 | −0.00 | TNFRSF13B |
| rs204999 | 6 | 32,217,957 | A | G | 0.74 | 0.0250 | 0.0040 | 3.4 × 10⁻⁹ | 25,537 | 0.94 | 0.0420 | 0.0130 | 1.7 × 10⁻³ | 10,168 | 9.01 | 0.10 | 6q21.3 |
| rs2280401 | 19 | 54,691,821 | A | G | 0.16 | 0.0120 | 0.0050 | 1.5 × 10⁻² | 25,537 | 0.16 | 0.0500 | 0.0090 | 6.5 × 10⁻⁸ | 10,168 | 5.19 | 0.96 | RPS11-FCGRT |
| Total Protein Additional Potential Loci | |||||||||||||||||
| rs3777200 | 5 | 95,260,547 | T | C | 0.27 | 0.0180 | 0.0040 | 1.9 × 10⁻⁵ | 25,524 | 0.30 | 0.0290 | 0.0070 | 1.1 × 10⁻⁴ | 10,168 | 6.57 | −0.14 | ELL2 |
| rs1260326 | 2 | 27,584,444 | T | C | 0.44 | 0.0150 | 0.0040 | 1.1 × 10⁻⁴ | 25,537 | 0.56 | 0.0310 | 0.0070 | 3.7 × 10⁻⁶ | 10,168 | 5.93 | −0.02 | GCKR-FNDC4 |
| rs2675609 | 10 | 63,306,537 | T | C | 0.39 | 0.0090 | 0.0040 | 1.4 × 10⁻² | 25,537 | 0.43 | −0.0360 | 0.0070 | 1.7 × 10⁻⁶ | 10,168 | 5.81 | 6.79 | ARID5B |
| rs10097731 | 8 | 82,190,227 | T | G | 0.15 | 0.0230 | 0.0050 | 1.1 × 10⁻⁵ | 25,537 | 0.17 | 0.0310 | 0.0090 | 5.9 × 10⁻⁴ | 10,168 | 5.67 | 0.19 | PAG1 |
Strong evidence is defined as log10 BF > 5. The following abbreviations are used: Chr, chromosome; GWAS, genome-wide association study; MANTRA, meta-analysis of transethnic association studies; EAF, effect allele frequency; and BF, Bayes factor.
MANTRA revealed little evidence of heterogeneity in allelic effects between European-ancestry and Japanese studies at the majority of the serum albumin and total protein loci (Table 2). The extent of heterogeneity was assessed through comparison of association BF under a Bayesian partition model wherein the number of clusters of studies is unrestricted to that wherein there is a single cluster, the latter corresponding to homogeneous allelic effects across all ancestry groups. Subsequent fixed-effect inverse-variance-weighted meta-analysis across groups of European and Japanese ancestry (Table S4) revealed one additional signal for total-protein mapping to ELL2 (MIM 601874, p = 1.1 × 10⁻⁸), although none of the other potential MANTRA loci showed genome-wide significance (p < 5 × 10⁻⁸). Among these potential loci, however, there was strong evidence of heterogeneity at ARID5B (MIM 608538) for total protein (MANTRA log10BF in favor of heterogeneity of 6.79). The lead SNP at this locus (rs2675609) was strongly associated with total protein only in the Japanese GWAS (p = 1.7 × 10⁻⁶, compared with p = 0.014 in the European meta-analysis), and the allelic effects were in opposite directions in the two ancestry groups (Table 2). Interestingly, the effect-allele frequency is similar in European-ancestry and Japanese GWASs, and there is little evidence of variation in LD structure between CEU and CHB+JPT reference haplotypes from the 1000 Genomes Project15 (Figure S3). Although intrastudy phenotypic variation in total protein concentrations (such as Ig, which is not available for analyses here) might contribute to these apparent transethnic differences in allelic effects, further investigation is required to fully elucidate the source of heterogeneity between ancestry groups.
To assess the improvement in fine-mapping resolution due to transethnic meta-analysis in serum albumin and total protein loci, we defined “credible sets” of SNPs (J.B. Maller, personal communication) with the strongest signals of association and, hence, most likely to be causal (or tagging an unobserved causal variant), on the basis of European-ancestry GWASs only and then after inclusion of the Japanese study. At each locus, defined by the genomic region 500 kb up and downstream of the lead SNP, we calculated the posterior probability that the jth SNP is “causal” (or tags an unobserved causal variant) by
In this expression, BFj denotes the BF in favor of association of the jth SNP from the transethnic MANTRA analysis, and the summation in the denominator is over all SNPs passing QC across the locus (J.B. Maller, personal communication). A 100ω% credible set at the locus was then constructed through (1) ranking all SNPs according to their BF and (2) combining ranked SNPs until their cumulative posterior probability exceeded ω. Using this definition, we observed improved resolution, in terms of the number of SNPs and the genomic interval covered by the credible set, at HPN-SCN1B, TNFRSF11A-ZCCHC2, and RPS11-FCGRT for serum albumin and at TNFRSF13B and the 6q21.3 locus for total protein (Figure 2, Table S5). The most striking improvements in resolution were observed at the 6q21.3 locus for total protein, wherein the 99% credible set was reduced from 14 SNPs (covering 346 kb), to just three (covering 37 kb). Furthermore, after transethnic meta-analysis, the posterior probability that the lead SNP was causal (or tagged an unobserved causal variant) was more than 95% at GCKR-FNDC4 and SERPINF2-WDR81 for serum albumin and at TNFRSF13B and the 6q21.3 locus for total protein.
Figure 2.
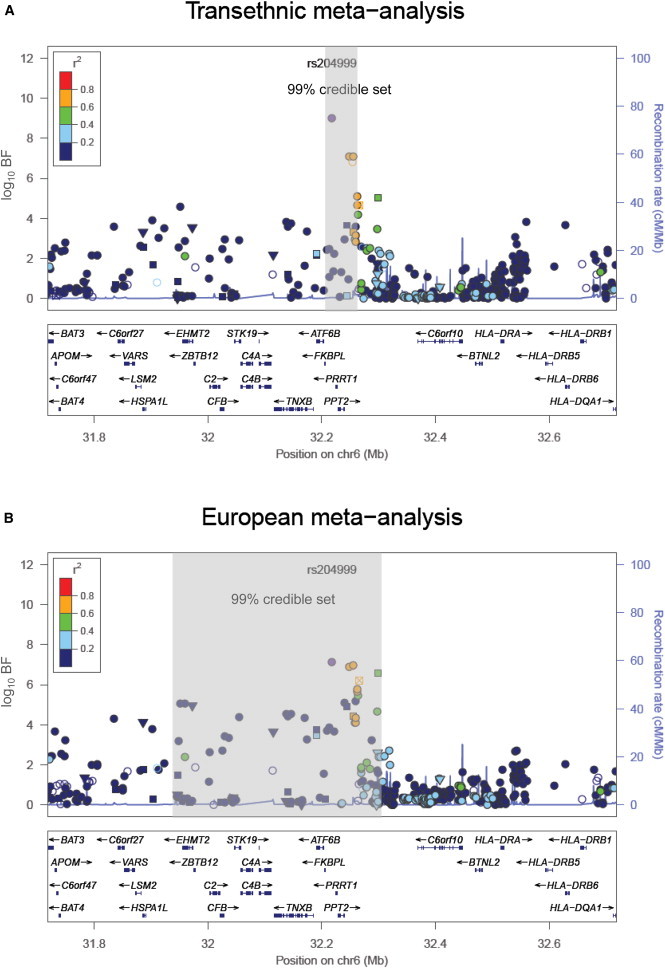
Fine Mapping of the 6q21.3 Locus for Total Protein
The two panels present signal plots for the MANTRA association signal (A) after transethnic meta-analysis of European-ancestry and Japanese GWASs and (B) after meta-analysis of the European ancestry GWAS only. Each point represents a SNP passing QC in our MANTRA analysis, plotted with their BF (on a log10 scale) as a function of genomic position (build 36). In each panel, the lead SNP is represented by the purple circle. The color coding of all other SNPs indicates LD with the lead SNP (estimated by CEU r2 from phase II HapMap): red, r2 ≥ 0.8; gold, 0.6 ≤ r2<0.8; green, 0.4 ≤ r2<0.6; cyan, 0.2 ≤ r2<0.4; blue, r2<0.2; and gray, r2 unknown. Recombination rates are estimated from the International HapMap Project and gene annotations are taken from the University of California Santa Cruz genome browser. In each panel, the gray-shaded regions correspond to the genomic interval covered by a 99% credible set of SNPs.
Two of the serum albumin loci, HPN-SCN1B and RPS11-FCGRT, can be validated by existing mouse models. The lead SNP at the HPN-SCN1B locus maps to an intron of HPN, a gene encoding hepsin, a membrane-bound serine protease that has substrate specificity for basic amino acids similar to that of proalbumin processing, suggesting a physiologic role of hepsin in the cleavage of proalbumin to albumin. We compared serum protein concentrations between hepsin knockout (KO) mice and wild-type litter mates16 (Figure 3) using blood samples collected from the inferior vena cava and analyzed by Consolidated Veterinary Diagnostics (West Sacramento, CA, USA). In hepsin−/− mice, we observed overwhelming evidence of reduced serum albumin (p = 9.1 × 10⁻¹²) and, to a lesser extent, reduced total protein (p = 1.5 × 10⁻⁵), but not Ig. At the RPS11-FCGRT locus, KO Fcgrt mice have been previously demonstrated to manifest low serum albumin and low serum gamma Ig concentrations.17,18 Furthermore, in humans, two siblings with genetic deficiency of FcRn due to lack of the β2 microglobumin component have manifested reduced serum albumin and gamma Ig concentrations.19 FCGRT encodes the heavy alpha chain of the FcRn, which prevents lysosomal degradation of albumin and Ig in lysosomes and thereby extends their serum half-life.17
Figure 3.
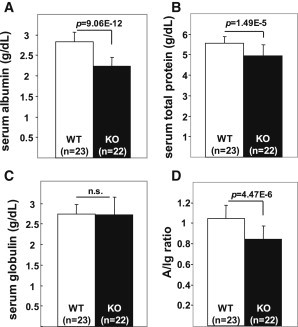
Serum Albumin, Total Protein, and Serum Globulin Concentrations and Albumin-to-Ig Ratio in Wild-Type and hepsin−/− Mice
Data are presented as mean ± SD, and the number of mice in each experimental group is shown in parentheses. Results for serum albumin are shown in (A); for total protein in (B); for serum globulin in (C); and the albumin-to-Ig ratio (A/Ig ratio) in wild-type (WT) and hepsin−/− (KO) mice in (D). Statistical differences are shown by p values. Note the significantly lower serum albumin concentrations, but not Ig concentrations, in KO mice compared to WT mice.
To gain insights into the possible functional role of other serum albumin and total protein loci, we began by performing expression quantitative trait locus (eQTL) mapping using data derived from 1,469 whole blood samples.20 Gene expression levels were measured from peripheral blood and assayed in 1,240 individuals with Illumina HT12 v3 and in 229 individuals with Illumina H8 v2 BeadChip arrays. Both sets were independently quantile-normalized after log2 transformation and subsequently corrected for 50 principal components obtained from the gene expression probe covariance matrix. To integrate both data sets, genotype data were imputed up to 2.5M autosomal SNPs with the use of CEU samples from phase II of the International HapMap Project.10 SNPs of low frequency (MAF < 5%) or with deviation from Hardy-Weinberg equilibrium (p < 10−4) were excluded from the subsequent analysis. Cis-eQTL effects (within 1 Mb of the probe) were determined with Spearman’s ranked correlation, and meta-analysis between the two data sets was performed with the use of weighted Z scores. The false discovery rate (FDR) was then assessed by permutation. Using this approach, we mapped lead SNPs at four of the identified loci (GCKR-FNDC4, SERPINF2-WDR81, and RPS11-FCGRT for serum albumin; 6q21.3 for total protein) to cis expression levels of 18 genes (Table S6). The strongest associations were observed for expression of NOSIP (p = 2.4 × 10⁻¹⁷ at RPS11-FCGRT) and HLA-DQA1 (MIM 146880) /HLA-DQA2 (MIM 613503, p = 9.1 × 10−36 at 6q21.3). NOSIP (nitric oxide synthase interacting protein) inhibits endothelial nitric oxide synthesis, whereas HLA-DQA1/2 is a human leukocyte antigen (HLA) class II antigen with an immune system role related to processing and presentation of antigen peptides.
We noticed that the lead SNP at the GCKR-FNDC4 locus (rs1260326, c.1337T>C [p. Leu446Pro]; RefSeq NM_001486.3) is a GCKR missense mutation with moderate predicted functional impact by snpEff, and has been previously associated with several metabolic traits, as well as kidney, liver, and hematologic phenotypes (Table S7). We used data from the 1000 Genomes Project15 to search for additional coding variants with predicted function in strong LD (r2 > 0.5 in 283 individuals of European ancestry) with lead SNPs at our identified serum albumin and total protein loci (Table S8). Across serum albumin loci, two nonsynonymous SNPs mapped to SERPINF2, a gene encoding an inhibitor of plasmin which degrades plasma fibrin and other proteins, and one nonsynonymous SNP mapped to CHRNA5 (MIM 118505), a nicotinic acetylcholine receptor gene associated with smoking behavior21,22 and lung cancer.23 For total protein, nonsynonymous SNPs mapped to TNFRSF13B and ELL2, and to PPT2 (MIM 603298) and EGFL8 (MIM 609897) at the 6q21.3 locus. Mutations in TNFRSF13B cause immunodeficiency common variable type 2 (MIM 240500), characterized by hypogammaglobulinemia and recurrent bacterial infections due to failure of β cell differentiation and impaired production of Ig. They also cause selective IgA deficiency 2 (MIM 609529), the most common primary immunodeficiency, affecting 1 in 600 individuals in the western world. ELL2 product directs Ig secretion in plasma cells, and the 6q21.3 major histocompatibility complex class III region encompasses a number of genes involved in autoimmunity, inflammation, and complement proteins. Interrogation of the National Human Genome Research Institute (NHGRI) GWAS catalog24 highlighted that lead SNPs at ten of the identified loci have themselves been reported or are in LD (r2 > 0.5 in 283 individuals of European ancestry) with those disclosed, for a diverse range of human complex traits (Table S7) but are enriched for metabolic phenotypes that are associated with, or are direct products of, protein metabolism.
Finally, we used the human interactome database (Cytoscape) to construct an interaction network consisting of 250 proteins that directly interact with genes in the identified serum albumin and total protein loci reported in Table 2. For identifying molecular complexes within this first-degree interaction network, cluster analyses were performed with the FAG-EC algorithm, implemented in the ClusterViz plug-in, with standard settings applied. In total, 16 distinct clusters were identified, including three large complexes (Figure S4) that were carried forward for further analysis. Functional enrichment analyses within these clusters were performed following defined pathways from BioCarta, KEGG, PANTHER, and Reactome via the Database for Annotation, Visualization, and Integrated Discovery (DAVID). The most significantly enriched clusters from protein interaction network analyses incorporated ribosomal functioning and protein translation, proteasomal protein degradation, and immune-response signaling (Table S9). As a complementary approach, we applied an implementation of gene-set enrichment analysis (MAGENTA25) to identify whether defined biological pathways from BioCarta, Gene Ontology, Ingenuity, KEGG, PANTHER, and Reactome were enriched in the leading-edge fraction of the meta-analysis. In brief, gene association p values were calculated on the basis of meta-analysis summary statistics for SNPs within a 110-kb-upstream and 40-kb-downstream window. These gene scores were then corrected for gene size, number of SNPs, and the LD between them, and subsequently ranked by p value. Enrichment in the 75th and 95th percentiles was assessed for significance by comparison with 10,000 randomly generated pathways. Using an FDR threshold of 5%, we observed significant overrepresentation of genes assigned to three pathways: RNA- (FDR = 0.044), sensory-perception- (FDR = 0.027), and protein-trafficking-related pathways (FDR = 0.043-0.044) (Table S10).
In conclusion, we have identified six loci for serum albumin concentration and three for total protein at genome-wide significance. These loci harbor genes that fall across a diverse range of biological pathways, including those involved in biomarkers, immune regulation, and disease, but are enriched for those relevant to the synthesis and degradation of serum protein. By combining GWAS data from European and Japanese populations, we observed some evidence of heterogeneity in allelic effects between ancestry groups and have demonstrated substantial improvements in the localization of potential causal variants. Taken together, our results highlight the advantages of transethnic meta-analysis for the discovery and fine mapping of complex trait loci and provide initial insights into the underlying genetic architecture of serum protein concentrations and their association with human disease.
Acknowledgments
A.P.M acknowledges financial support from the Wellcome Trust, grant numbers WT081682, WT064890, WT098017, and WT090532. N.F. acknowledges financial support from AHA 0675001N, R01HL089651, and U01HG004803.
Contributor Information
Nora Franceschini, Email: noraf@unc.edu.
Andrew P. Morris, Email: amorris@well.ox.ac.uk.
Supplemental Data
Web Resources
The URLs for data presented herein are as follows:
1000 Genomes Project, http://www.1000genomes.org/
ClusterViz plug-in, http://code.google.com/p/clusterviz-cytoscape
NHGRI Catalog of Published Genome-wide Association Studies, http://www.genome.gov/gwastudies/
Online Mendelian Inheritance in Man (OMIM), http://www.omim.org
snpEff, http://snpeff.sourceforge.net
References
- 1.Nelson J.J., Liao D., Sharrett A.R., Folsom A.R., Chambless L.E., Shahar E., Szklo M., Eckfeldt J., Heiss G. Serum albumin level as a predictor of incident coronary heart disease: the Atherosclerosis Risk in Communities (ARIC) study. Am. J. Epidemiol. 2000;151:468–477. doi: 10.1093/oxfordjournals.aje.a010232. [DOI] [PubMed] [Google Scholar]
- 2.Goldwasser P., Feldman J. Association of serum albumin and mortality risk. J. Clin. Epidemiol. 1997;50:693–703. doi: 10.1016/s0895-4356(97)00015-2. [DOI] [PubMed] [Google Scholar]
- 3.Johnson A., Rohlfs E., Silverman L. WB Saunders Co.; Philadelphia, PA: 1999. Tietz Textbook of Clinical Chemistry. [Google Scholar]
- 4.Dal Colletto G.M., Krieger H., Magalhães J.R. Genetic and environmental determinants of 17 serum biochemical traits in Brazilian twins. Acta Genet. Med. Gemellol. (Roma) 1983;32:23–29. doi: 10.1017/s0001566000008126. [DOI] [PubMed] [Google Scholar]
- 5.Whitfield J.B., Martin N.G. The effects of inheritance on constituents of plasma: a twin study on some biochemical variables. Ann. Clin. Biochem. 1984;21:176–183. doi: 10.1177/000456328402100303. [DOI] [PubMed] [Google Scholar]
- 6.Kalousdian S., Fabsitz R., Havlik R., Christian J., Rosenman R. Heritability of clinical chemistries in an older twin cohort: the NHLBI Twin Study. Genet. Epidemiol. 1987;4:1–11. doi: 10.1002/gepi.1370040102. [DOI] [PubMed] [Google Scholar]
- 7.Pankow J.S., Folsom A.R., Cushman M., Borecki I.B., Hopkins P.N., Eckfeldt J.H., Tracy R.P. Familial and genetic determinants of systemic markers of inflammation: the NHLBI family heart study. Atherosclerosis. 2001;154:681–689. doi: 10.1016/s0021-9150(00)00586-4. [DOI] [PubMed] [Google Scholar]
- 8.Kamatani Y., Matsuda K., Okada Y., Kubo M., Hosono N., Daigo Y., Nakamura Y., Kamatani N. Genome-wide association study of hematological and biochemical traits in a Japanese population. Nat. Genet. 2010;42:210–215. doi: 10.1038/ng.531. [DOI] [PubMed] [Google Scholar]
- 9.Kim Y.J., Go M.J., Hu C., Hong C.B., Kim Y.K., Lee J.Y., Hwang J.Y., Oh J.H., Kim D.J., Kim N.H., MAGIC consortium Large-scale genome-wide association studies in East Asians identify new genetic loci influencing metabolic traits. Nat. Genet. 2011;43:990–995. doi: 10.1038/ng.939. [DOI] [PubMed] [Google Scholar]
- 10.Frazer K.A., Ballinger D.G., Cox D.R., Hinds D.A., Stuve L.L., Gibbs R.A., Belmont J.W., Boudreau A., Hardenbol P., Leal S.M., International HapMap Consortium A second generation human haplotype map of over 3.1 million SNPs. Nature. 2007;449:851–861. doi: 10.1038/nature06258. [DOI] [PMC free article] [PubMed] [Google Scholar]
- 11.Devlin B., Roeder K. Genomic control for association studies. Biometrics. 1999;55:997–1004. doi: 10.1111/j.0006-341x.1999.00997.x. [DOI] [PubMed] [Google Scholar]
- 12.Yang J., Lee S.H., Goddard M.E., Visscher P.M. GCTA: a tool for genome-wide complex trait analysis. Am. J. Hum. Genet. 2011;88:76–82. doi: 10.1016/j.ajhg.2010.11.011. [DOI] [PMC free article] [PubMed] [Google Scholar]
- 13.Morris A.P. Transethnic meta-analysis of genomewide association studies. Genet. Epidemiol. 2011;35:809–822. doi: 10.1002/gepi.20630. [DOI] [PMC free article] [PubMed] [Google Scholar]
- 14.Stephens M., Balding D.J. Bayesian statistical methods for genetic association studies. Nat. Rev. Genet. 2009;10:681–690. doi: 10.1038/nrg2615. [DOI] [PubMed] [Google Scholar]
- 15.1000 Genomes Project Consortium A map of human genome variation from population-scale sequencing. Nature. 2010;467:1061–1073. doi: 10.1038/nature09534. [DOI] [PMC free article] [PubMed] [Google Scholar]
- 16.Wu Q., Yu D., Post J., Halks-Miller M., Sadler J.E., Morser J. Generation and characterization of mice deficient in hepsin, a hepatic transmembrane serine protease. J. Clin. Invest. 1998;101:321–326. doi: 10.1172/JCI1617. [DOI] [PMC free article] [PubMed] [Google Scholar]
- 17.Chaudhury C., Mehnaz S., Robinson J.M., Hayton W.L., Pearl D.K., Roopenian D.C., Anderson C.L. The major histocompatibility complex-related Fc receptor for IgG (FcRn) binds albumin and prolongs its lifespan. J. Exp. Med. 2003;197:315–322. doi: 10.1084/jem.20021829. [DOI] [PMC free article] [PubMed] [Google Scholar]
- 18.Roopenian D.C., Christianson G.J., Sproule T.J., Brown A.C., Akilesh S., Jung N., Petkova S., Avanessian L., Choi E.Y., Shaffer D.J. The MHC class I-like IgG receptor controls perinatal IgG transport, IgG homeostasis, and fate of IgG-Fc-coupled drugs. J. Immunol. 2003;170:3528–3533. doi: 10.4049/jimmunol.170.7.3528. [DOI] [PubMed] [Google Scholar]
- 19.Wani M.A., Haynes L.D., Kim J., Bronson C.L., Chaudhury C., Mohanty S., Waldmann T.A., Robinson J.M., Anderson C.L. Familial hypercatabolic hypoproteinemia caused by deficiency of the neonatal Fc receptor, FcRn, due to a mutant beta2-microglobulin gene. Proc. Natl. Acad. Sci. USA. 2006;103:5084–5089. doi: 10.1073/pnas.0600548103. [DOI] [PMC free article] [PubMed] [Google Scholar]
- 20.Fehrmann R.S., Jansen R.C., Veldink J.H., Westra H.J., Arends D., Bonder M.J., Fu J., Deelen P., Groen H.J., Smolonska A. Trans-eQTLs reveal that independent genetic variants associated with a complex phenotype converge on intermediate genes, with a major role for the HLA. PLoS Genet. 2011;7:e1002197. doi: 10.1371/journal.pgen.1002197. [DOI] [PMC free article] [PubMed] [Google Scholar]
- 21.Thorgeirsson T.E., Gudbjartsson D.F., Surakka I., Vink J.M., Amin N., Geller F., Sulem P., Rafnar T., Esko T., Walter S., ENGAGE Consortium Sequence variants at CHRNB3-CHRNA6 and CYP2A6 affect smoking behavior. Nat. Genet. 2010;42:448–453. doi: 10.1038/ng.573. [DOI] [PMC free article] [PubMed] [Google Scholar]
- 22.Tobacco and Genetics Consortium Genome-wide meta-analyses identify multiple loci associated with smoking behavior. Nat. Genet. 2010;42:441–447. doi: 10.1038/ng.571. [DOI] [PMC free article] [PubMed] [Google Scholar]
- 23.Amos C.I., Wu X., Broderick P., Gorlov I.P., Gu J., Eisen T., Dong Q., Zhang Q., Gu X., Vijayakrishnan J. Genome-wide association scan of tag SNPs identifies a susceptibility locus for lung cancer at 15q25.1. Nat. Genet. 2008;40:616–622. doi: 10.1038/ng.109. [DOI] [PMC free article] [PubMed] [Google Scholar]
- 24.Hindorff L.A., Sethupathy P., Junkins H.A., Ramos E.M., Mehta J.P., Collins F.S., Manolio T.A. Potential etiologic and functional implications of genome-wide association loci for human diseases and traits. Proc. Natl. Acad. Sci. USA. 2009;106:9362–9367. doi: 10.1073/pnas.0903103106. [DOI] [PMC free article] [PubMed] [Google Scholar]
- 25.Segrè A.V., Groop L., Mootha V.K., Daly M.J., Altshuler D., DIAGRAM Consortium. MAGIC investigators Common inherited variation in mitochondrial genes is not enriched for associations with type 2 diabetes or related glycemic traits. PLoS Genet. 2010;6:e1001058. doi: 10.1371/journal.pgen.1001058. [DOI] [PMC free article] [PubMed] [Google Scholar]
Associated Data
This section collects any data citations, data availability statements, or supplementary materials included in this article.