

Abstract
A retrospective correlational analysis of UC781 (0.1, 0.25%) gel pharmacokinetics (PK) and pharmacodynamics (PD) was undertaken using data generated in the RMP-01/MTN-006 Phase 1 rectal safety study of the UC781 microbicide gel, where strong UC781-related inhibition of ex vivo biopsy infectibility (PD) was seen. Precision analysis, linear and logistical correlational methods were applied to model the dose-response relationship. Four analyses of explant virus growth were compared to determine tissue concentrations of UC781 needed to maintain ex vivo virus growth below a range of cut-points. SOFT, a cross-sectional index from a growth curve, and cumulative p24 endpoints were the most precise measurement of ex vivo HIV infection and significantly (p<0.01) correlated with rectal tissue UC781 concentrations. Cut-points reflecting infectibility, ranging from 200 to 1300 p24 pg/ml, provided EC50,90,95 tissue levels of UC781. A cut-point of 200 p24 pg/ml provided an EC50 of 2148 UC781 ng/g tissue; a cut-point of 1100 p24 predicted a lower EC50 of 101 UC781 ng/g. A 30- to 170-fold EC90:EC50 ratio was found. Higher p24 cut-points provided more predictive models. Tissue UC781 levels and ex vivo infectibility data were correlated to model dose-response drug efficacy in this small Phase 1 trial. Logistic regression analyses showed EC50,90,95 values were inversely related to p24 cut-point levels, providing clinically relevant insights into tissue drug concentration necessary for ex vivo suppression of HIV tissue infectibility. This first PK-PD assessment of topical microbicides demonstrates feasibility in Phase 1 trials, enabling comparisons of microbicide efficacy (i.e., EC50,90,95) between formulations, compartments, and application methods. (ClinicalTrials.gov; #NCT00408538)
Introduction
Microbicides are topical products that can be applied to the vaginal or rectal mucosa with the goal of preventing or, at least, significantly reducing the risk of HIV-1 acquisition. The current microbicide pipeline is focused on the evaluation of potent antiretroviral compounds such as tenofovir.1,2 Prevention of HIV-1 infection will be contingent on ensuring that the right concentration of drug is in the right location at the time of viral exposure. As a consequence, there is increasing interest in evaluating the compartmental pharmacokinetics (PK) of oral and topical antiretroviral preexposure prophylaxis (PrEP) products.3,4 Another challenge is to define product efficacy before committing resources to conduct large and expensive Phase 2B/3 effectiveness studies. One approach is to conduct in vitro assessment of product efficacy using an explant model. In this system, small pieces of rectal or vaginal tissue (explants) are exposed to HIV-1 in the presence or absence of the candidate drug to determine whether the drug is able to prevent or significantly reduce explant viral replication.5,6 A recent modification to this system is to conduct in vivo drug exposure and biopsy acquisition with subsequent ex vivo viral challenge to that tissue. This approach can be applied to single or multiple in vivo drug exposures and has been used in Phase 1 trials to evaluate the ex vivo efficacy of UC7817 and tenofovir 1% gels.8
RMP-01 was a Phase 1 rectal safety study of the UC781 gel, recently published.7 The study evaluated the safety and acceptability of two concentrations (0.1 and 0.25%) of a UC781 gel compared to the hydroxyethyl cellulose (HEC) placebo gel in 36 participants. In addition, detailed compartmental PK and ex vivo explant infections were undertaken after single and seven daily exposures to the test products. Colorectal tissue samples (biopsies) were collected at 10 and 30 cm from the anal margin to explore whether there was regional heterogeneity in PK or biopsy infectibility following rectal administration of the UC781 gel. Single and 7-day topical rectal exposure to both concentrations of UC781 were safe with no significant adverse events, no detected UC781 plasma drug levels (expected), no significant mucosal changes, and high participant acceptability. Of note, ex vivo biopsy infectibility of in vivo product-exposed rectal tissue demonstrated marked suppression of HIV infectibility, identifying a potential early biomarker of efficacy.
The goals of this paper were to determine (1) which explant readouts provided the most reliable measure of ex vivo HIV infection of rectal tissue biopsies in this UC781 trial; (2) whether these indices of rectal tissue infectibility (HIV suppression) correlate with tissue UC781 drug concentrations; (3) whether statistically significant correlations between ex vivo suppression of HIV infection and in vivo exposed tissue drug concentration can be used to calculate drug concentrations necessary to inhibit virus growth in 50, 90, and 95% of trial participants' biopsies (i.e., EC50,90,95); and (4) the gel formulation characteristics that might be predicted to provide EC50,90,95 levels of HIV inhibition ex vivo.
Materials and Methods
RMP-01 was a Phase 1 study of a UC781 gel (0.1% and 0.25% formulations) and an HEC placebo in 36 subjects with a 1:1:1 randomization.7 The study's primary endpoint was safety and acceptability. Secondary endpoints included mucosal toxicity and UC781 drug concentrations (plasma and rectal tissue) and a novel ancillary endpoint assessing ex vivo suppression of tissue biopsy infectibility with HIV-1. The study was approved by the UCLA Office of the Human Research Protection Program Institutional Review Board (UCLA IRB), all subjects provided written informed consent, and the study was registered at ClinicalTrials.gov (NCT00408538).
Endoscopic biopsies
Each participant had three flexible sigmoidoscopies for colonic biopsies and other sample collections each separated by 2–3 weeks for washout/healing: (1) baseline (Visit 2; V2); (2) 30 min after a single, clinician-applied topical rectal dose of product (Visit 3; V3); and (3) day 8, following seven daily participant-applied topical rectal doses (Visit 5; V5). Colonic biopsies were collected endoscopically using large cup biopsy forceps via a flexible sigmoidoscope as previously described9,10 at 10 cm and 30 cm within the colorectum. The freshly acquired colonic biopsies were prepared for ex vivo infection using two titers (102 and 104 TCID50) of the laboratory R5 strain, HIV-1BaL. UC781 concentrations for concurrently acquired blood (Bridge Laboratories, Gaithersburg, MD) and tissue biopsies (KAR Laboratories, Kalamazoo, MI) were determined.7
Ex vivo infections of rectal biopsies
Endoscopic biopsies from the 10 cm and the 30 cm site were collected in 50 ml RPMI 1640 (Gibco BRL, Gaithersburg, MD) supplemented with 1.125 μg/ml of Fungizone (Gibco BRL) and 50 mg/ml of Zosyn (Wyeth, Philadelphia, PA), and transported to the laboratory for explant set-up, as previously reported.7,11,12 Explant samples were exposed (within 1 h of collection) to one of two titers of the R5 HIVBaL strain (104 TCID50 or 102 TCID50); TCID50 was determined by titration using peripheral blood mononuclear cells (PBMCs). The same viral stock was used throughout the study. Explants were incubated with virus for 2 h and then thoroughly washed; six explants from both 10 cm and 30 cm sites were each placed on Gelfoam rafts in individual wells of a 24-well plate (Costar #3524, Corning, Inc., Corning, NY) and followed for 14 days. Supernatants for ELISA quantification of p24 (pg/ml) (p24 Antigen Capture ELISA from the AIDS & Cancer Virus Program, NCI, Bethesda, MD) were collected every 3–4 days and replaced with media. Measurements of p24≤2 pg/ml were converted to 2 pg/ml for analyses.
Tissues concentrations of UC781 in rectal biopsies
Tissue levels of UC781 were measured in biopsies collected at 10 cm and 30 cm from the anal margin using a validated assay (KAR Laboratories, Kalamazoo, MI). Tissue was homogenized with methanol/deinonized water (1:1), extracted with acetonitrile, and analyzed by liquid chromatography–mass spectrometry (LC/MS). Samples were obtained at baseline (V2) and after receiving UC781 (0.1 or 0.25%) or placebo following single (V3) and 7-day (V5) exposure. UC781 tissue-associated values were reported for samples showing a peak reading ≥5 ng/g. Samples with a peak reading <5 ng/g (i.e., LLOQ; lower limit of quantification) were reported as “BLQ.” Samples with a reading >2500 ng/g (i.e., ULOQ; upper limit of quantification) were diluted into the range of the standard curve to obtain a final UC781 tissue concentration. All plasma levels of UC781 were analyzed by Bridge Laboratories (Gaithersburg, MD) and were below the limits of detection as previously reported.7
Statistical methods
Ex vivo infection endpoints
Ex vivo infection was measured using readouts of cumulative p24 (CUM), p24 at the soft endpoint (SOFT), slope (SLOPE), and area under the virus growth curve (AUC) using previously reported calculation formulas,13 where the virus growth curve was the p24 supernatant (pg/ml), per time point, plotted against time. In brief, SLOPE was the slope parameter from a linear regression plotted between day 1 (first day of supernatant collection) and day 14 (last day of supernatant collection). The area under each virus growth curve (AUC) was approximated using the trapezoidal rule14 applied to a second order polynomial curve. SOFT is the virus growth measurement (p24) at the last time point where the increase in virus concentration between two consecutive time points is greater than the square root of the sum of sequential changes in virus concentration for the entire assay (Eq. 1). SOFT is an estimation of the p24 level at the start of the stationary phase of virus growth, after exponential growth has been achieved and prior to the onset of the decline phase15,16 when virus growth may be less likely due to tissue deterioration. See www.alphastatconsult.com for examples of the SOFT calculation applied to virus growth curves and the numerical example given below.
 |
(1) |
Numerical example of SOFT calculation
| Virus Growth Curve Data (Five Time Points) | |
| Time point | p24 (pg/ml) |
| 1 | 0 |
| 2 | 85 |
| 3 | 200 |
| 4 | 198 |
| 5 | 202 |
| Absolute changes in growth | |
| Time2,1 | ABS (85–0)=85 |
| Time3,2 | ABS (200–85)=115 |
| Time4,3 | ABS (198–200)=2 |
| Time5,4 | ABS (202–198)=4 |
| Sum change | (85+115+2+4)=206 |
| Square root sum change (c) | SQRT (206)=14 |
| Last time point (absolute change>c) | (115>14) |
| SOFT | 200 p24 pg/ml |
Precision of explant infectibility endpoints
Tissue infectibility at the baseline visit (V2) was used to compare intrasubject and intersubject measurement precision across the four measures of tissue infection and to test the effect of biopsy location (10, 30 cm) on biopsy virus growth. AUC, CUM, SOFT, and SLOPE endpoint measures were tested for normality and log-normally distributed data were log transformed prior to the precision analyses. AUC, CUM, SOFT, and SLOPE measurements were each entered into a mixed model ANOVA where subject was a random factor and biopsy location (10 vs. 30 cm) was a fixed factor. The mixed model ANOVA was used to test the null hypothesis that there was no effect of biopsy location on AUC, CUM, SOFT, and SLOPE virus growth endpoints at V2. In addition, the mixed model ANOVA provided the variance components for within and between subjects variance. The percent relative standard deviation (%RSD; Eq. 2, when modeled with the base-10 logarithm), an estimate of the amount of variability in each ANOVA model, was calculated using the subject covariance parameter estimate as a measure of intersubject variability and the residual variance covariance estimate as a measure of intrasubject variability.
 |
(2) |
In the mixed model ANOVA, variance is additive so that intersubject variability and intrasubject variability (residual variance) provide the total variance in each model. The percentage of total variance in each model attributed to intersubject and intrasubject sources can be determined as 100×(intersubject variance/total variance) and 100×(intrasubject variance/total variance), respectively. The relative proportion of measurement variability from intrasubject and intersubject sources was determined for each mixed model ANOVA. A mixed model ANOVA was run for each of the four endpoint measures (AUC, CUM, SOFT, and SLOPE) at each HIV inoculation condition (102 and 104 TCID50).
To determine the reproducibility of subject biopsy infectivity measurements over time, the placebo group log10 transformed biopsy infectivity endpoints (n=12; AUC, CUM, SOFT, and SLOPE) at V3 and V5 were compared to the infectivity levels from the same subjects at V2. It was hypothesized that for the biopsy infectivity measurements to show within-subject reproducibility over the duration of the study, the 90% confidence interval for the ratio of V3:V2 and V5:V2 would be within 0.7–1.3. An endpoint measure would be considered reproducible when biopsy infectibilities at V3 and V5 were within±30% (i.e., 70–130%18) of the infectibility for the same placebo subject, location, and virus titer at V2 90% of the time.
Tissue concentrations of UC781 in rectal biopsies
UC781 (ng/g) data were tested for normality and log-normally distributed data were log transformed. ANOVA models were used to test the main effects of treatment (0.1%, 0.25% UC781, and placebo) and location (10 versus 30 cm) on tissue UC781 levels at V3 and V5, where subject was a randomized block variable. Least squares means, adjusted for subject, were compared between treatment vs. placebo groups and 10 vs. 30 cm biopsy location by the Tukey pairwise comparison test, when indicated by statistically significant main effects of treatment, location, or the treatment×location interactions.
Correlating ex vivo HIV tissue infectibility with in vivo tissue UC781 drug concentrations
Linear regression analyses were used to correlate AUC, CUM, SOFT, and SLOPE endpoints with log transformed tissue concentrations of UC781 (ng/ml). A statistically significant (p<0.05) linear dose-response relationship between drug and endpoint was followed by the application of an infection/noninfection categorization. The infected/noninfected Boolean categorization of linear, continuous virus growth endpoint measurements was performed by imposing a cut-point where an assay virus growth endpoint less than or equal to the cut-point was categorized as a “noninfected” explant assay and an endpoint greater than the cut-point was categorized as an “infected” explant assay. A range of cut-points was tested, for example 200, 300, 400 etc. to 1300 (pg/ml) SOFT. For each cut-point, an assay result at or below the cut-point would be categorized as “noninfected,” depending on the virus growth endpoints that were progressed into this stage of the analysis.
Calculation of EC50,90,95
The infected/noninfected categorized explant results were entered into a series of logistical dose-response regression analyses where the dose of drug predicted to achieve noninfection in 50, 90, and 95% (EC50, EC90, and EC95) of explants was calculated. An ROC (receiver operating characteristic) curve was used to compare the “goodness of fit” of each of the logistical regression models. The ROC is a plot of the sensitivity (true positive rate) and 1 – specificity (true negative rate). The area under the ROC curve (C) was used as a measure of goodness of fit for each logistical regression model.
Statistical analyses were performed with SAS® version 9.2 and an α=0.05.
Results
The main study report7 compared baseline (V2) ex vivo infectibility of rectal tissue biopsies with HIV-1BaL to that following single exposure of randomized product (V3) and again following 7-day exposure of randomized product (V5). Data were reported using the “cumulative p24 at day 14” (CUM) analytic method. The findings in this paragraph have been published in detail7 and the ex vivo biopsy infectibility data are represented here, in summary form, to provide context for this paper's analyses. At baseline, 35/36 participant's samples were infectible ex vivo with the higher viral titer of HIV-1BaL (104 TCID50); only ∼60% of participant's biopsies were infectible when exposed to the lower (102 TCID50 viral titer). Following single exposure to the higher dose of UC781 (0.25%), tissue infectibility ex vivo was significantly suppressed (p<0.02), regardless of viral titer or biopsy location. With the lower dose of UC781 (i.e., 0.1%), there was a trend toward suppression with marginally significant/nonsignificant differences. No significant changes or trends were seen with placebo. For the higher dose of UC781 (0.25%) between group differences were significant for 104 TCID50 at 10 cm (p=0.002) and close to significant for 104 TCID50 at 30 cm (p=0.059) at the significance level of α=0.05. Significance was not reached with the lower dose UC781. For the 7-day exposure, none of the paired before–after comparisons within or between study groups (0.25% UC781, 0.1% UC781, placebo) demonstrated a significant change.
Comparison of the four measures of ex vivo rectal biopsy infectibility
Baseline (V2) measurements of rectal explant infections with CUM, SOFT, SLOPE, and AUC endpoints were log-normally distributed for both 102 and 104 TCID50 titers (Skewness 0.89–2.06; Shapiro–Wilk p<0.0001). CUM, SOFT, and AUC endpoints were log transformed prior to the analyses. As a SLOPE measure of 0 indicates no growth in the assay, this measure was not log transformed in order to retain this zero growth result. One subject's baseline measurements (ID 144) were extreme outliers and were excluded from both this analysis and that presented in the main study report.7 Baseline (V2) infectivity endpoints were entered into a mixed model ANOVA to measure intrasubject and intersubject variability. Intrasubject and intersubject variability parameters for these log transformed measurements are shown in Table 1.
Table 1.
Biopsy Infectivity Measurement Precision
| |
|
|
Variance Proportion |
RSD |
|
|
|
||
|---|---|---|---|---|---|---|---|---|---|
| Measure | Virus TCID50 | Variancea | Intrasubjectb | Intersubjectc | Intrasubjectd | Intersubjecte | Nf | Mean (range) | Locationg |
| Log10 (AUC) | 102 | 0.0391 | 57.7% | 42.3% | 41.3% | 34.5% | 140 | 2.79 (1.56–4.54) | 0.870 |
| 104 | 0.0168 | 43.4% | 56.6% | 21.7% | 25.2% | 140 | 4.05 (1.56–5.04) | 0.382 | |
| Log10 (CUM) | 102 | 0.0600 | 57.4% | 42.6% | 53.3% | 44.5% | 140 | 2.14 (1–3.77) | 0.816 |
| 104 | 0.0258 | 43% | 57% | 27.5% | 32.2% | 140 | 3.34 (1–4.24) | 0.432 | |
| Log10 (SOFT) | 102 | 0.0563 | 56.7% | 43.3% | 50.9% | 43.3% | 140 | 1.77 (0.3–3.58) | 0.841 |
| 104 | 0.0233 | 43.4% | 56.6% | 26.1% | 30.3% | 140 | 3.06 (0.3–4.13) | 0.444 | |
| SLOPE | 102 | 0.3361 | 35.6% | 64.4% | 121.8% | 191.9% | 140 | 50.68 (−11.05–293.04) | 0.722 |
| 104 | 0.1660 | 46.5% | 53.5% | 89.6% | 98.7% | 140 | 185.18 (0–1031.08) | 0.308 | |
Total variance in each ANOVA model.
Intrasubject variance proportion=100(intrasubject variance/total variance).
Intersubject variance proportion=100(intersubject variance/total variance).
Intrasubject %RSD=%RSD=100 ( ).
).
Inter-subject %RSD=%RSD=100 ( ).
).
Number of explant assay endpoints in the analysis; 35 subjects × 2 locations × 2 replicates at Visit 2.
Probability of no difference in endpoint between 10 cm and 30 cm biopsy location.
Intrasubject and intersubject measurement variability parameters from mixed model ANOVA at baseline (V2). The area under the curve (AUC), cumulative p24 in pg/ml (CUM), slope of the virus growth curve (SLOPE), and p24 at the soft endpoint in pg/ml (SOFT) endpoint variability were calculated by ANOVA where intrasubject was the residual variance, intersubject was the random factor of subject, and biopsy location (location; 10 vs. 30 cm) was a fixed factor. The ANOVA results for each endpoint measure at each TCID50 HIV titer infection are reported.
Variability greater for SLOPE infectibility measure
The total model variances for SLOPE were 5- to 10-fold higher for both 102 (0.3361) and 104 (0.1660) TCID50 viral titers (“Variance”; Table 1), compared to the AUC, CUM, and SOFT endpoint variances. Although there was a slightly larger proportion of variance from the intersubject compared to intrasubject sources of variances for the SLOPE measure [“Variance Proportion”; Table 1], the %RSD values [“RSD”; Table 1] were extremely high for both intersubject and intrasubject sources of measurement variation for SLOPE. Overall, 31% of virus growth curves had a zero slope value between day 0 and day 14.
Similar variance for AUC, CUM and SOFT infectibility measures
Total model variance for AUC, CUM, and SOFT ranged from 0.0168 to 0.0600 (“Variance”; Table 1), that is, total variance for all three endpoint measures were within a 2- to 3-fold range. There was a similar pattern in the relative proportion of variance attributed to intrasubject and intersubject sources for the AUC, CUM, and SOFT endpoints. A larger relative proportion of total variance was found from intrasubject sources after 102 infection [AUC=57.7%, CUM=57.4%, SOFT=56.7%; “Variance Proportion”; Table 1] and from intersubject sources after 104 infection (AUC=56.6%, CUM=57%, SOFT=56.6%).
Total measurement variance greater for 102 titer
The total variance explained by each model was increased by approximately 2- to 3-fold following the 102 viral titer compared to the 104 viral titer (“Variance”; Table 1). Intrasubject and intersubject variability was lower following the 104 infection (21.7–98.7; “%RSD,” Table 1) than the 102 infection (34.5–191.9% RSD; Table 1).
Intersubject variance was greater than intrasubject variance for 104 titer
The expectation was that multiple biopsy samples taken from the same subject (i.e., intrasubject) would be more consistently infectible than biopsy samples taken from multiple subjects (i.e., intersubject). This was found to be the case for the 104 titer, where the relative proportion of variance (“Variance Proportion”; Table 1) attributed to intersubject sources was consistently higher than intrasubject sources (Table 1).
No statistical impact of biopsy location
There was no effect of biopsy location on measurements of CUM, SOFT, AUC, and SLOPE at either 102 or 104 TCID50 infection (“Location,” Table 1).
Reproducibility of infectivity measures across visits for the 104 titer
It was expected that the biopsy infectivity results for subjects in the placebo group (n=12) would be reproducible across V2, V3, and V5 testing times as these measurements were made following either no gel application (V2) or HEC gel application (V3 and V5) where neither condition was expected to affect biopsy infectibility. Reproducibility was found for CUM, SOFT, and AUC endpoints for the 104 titer at 10 cm, where the 90% confidence interval (CI) for the ratio of V3:V2 and V5:V2 was within 0.7–1.3, an acceptable level of bioequivalence for data showing large interindividual variation18 (bolded values in Table 2), where the 90% CI for measures at V3:V2 were within 0.8–1.25.19 That is, the measures in the placebo group at V3 and V5 were within 30% of the baseline measures at V2 following the 104 infection and at 10 cm. A greater than±30% difference to baseline infectibility measures was found for CUM and SOFT following the 102 infection (Table 2) at both locations (10 and 30 cm) and at both visits (V3 and V5).
Table 2.
Placebo Group (n=12) Biopsy Infectivity Measurement Reproducibility Across Visits V2, V3, and V5
| |
|
|
Upper–lower 90% CIa(n)b |
|
|---|---|---|---|---|
| Measure | Virus TCID50 | Location (cm) | V3:V2 | V5:V2 |
| Log10 (AUC) | 102 | 10 | 0.75–1.43 (12) | 0.61–1.07 (12) |
| 30 | 0.72–1.31 (12) | 0.74–1.26 (12)c | ||
| 104 | 10 | 0.95–1.12 (12)c | 0.96–1.25 (12)c | |
| 30 | 0.84–1.37 (12) | 0.89–1.3 (12)c | ||
| Log10 (CUM) | 102 | 10 | 0.73–1.62 (12) | 0.56–1.14 (12) |
| 30 | 0.66–1.44 (12) | 0.69–1.4 (12) | ||
| 104 | 10 | 0.93–1.13 (12)c | 0.95–1.30 (12)c | |
| 30 | 0.78–1.53 (12) | 0.87–1.41 (12) | ||
| SLOPE | 102 | 10 | −0.1–1.84 (4) | −9.44–20.7 (3) |
| 30 | 0.47–1.18 (5)c | 0.56–2.33 (5) | ||
| 104 | 10 | 0.69–1.42 (12) | 0.42–2.27 (12) | |
| 30 | 0.62–1.41 (11) | 0.1–4.42 (11) | ||
| Log10 (SOFT) | 102 | 10 | 0.74–1.59 (12) | 0.56–1.13 (12) |
| 30 | 0.68–1.42 (12) | 0.72–1.38 (12) | ||
| 104 | 10 | 0.94–1.15 (12)c | 0.96–1.29 (12)c | |
| 30 | 0.8–1.5 (12) | 0.89–1.39 (12) | ||
Upper and lower 90% confidence intervals for the V3:V2 and V5:V2 ratio of biopsy infection.
Number of subjects with a calculated endpoint at both time points.
Within 0.7–1.3.
Biopsy infectibilities at V3 and V5 were compared with infectibility at V2 for each endpoint subject, location, and titer. Reproducibility was shown where the upper and lower 90% confidence interval for the ratio of V3:V2 and V5:V2 was wholly within the range 0.7–1.3. Values where the 90% confidence interval for the ratio of both V3:V2 and V5:V2 was within 0.7–1.3 are bolded.
Summary of infectibility endpoint measure comparisons
There was generally higher variability found for the SLOPE infectibility measure and following the 102 TCID50 viral titer. There were no significant differences between baseline infection rates at the 10 cm and 30 cm locations, although some evidence suggested that the 10 cm location provided more consistent biopsy infectibility across visits. Explant results from the more reliable 104 TCID50 infection titer were pooled across the 10 cm and 30 cm locations to enter into the dose-response analyses.
UC781 drug concentrations in rectal tissue
As expected for a nonnuclear reverse transcriptase inhibitor (NNRTI) with limited systemic bioavailability, no plasma levels of UC781 were detected in any participants after single or repeated topical applications.7 Drug levels in the concurrently acquired rectal biopsies (ng/g) were measured and detected at three time periods (V2, V3, and V5) for the 36 subjects, at two biopsy locations (10 and 30 cm; Table 3). Rectal tissue drug levels of UC781 were nondetectable for all subjects at V2 and for all placebo treated subjects at V3 and V5 (“BLQ”; Table 3). These nondetectable UC781 tissue concentrations were converted to the limit of quantification (5 ng/g). The UC781 drug concentrations were found to be log-normally distributed (skewness=3.6; Shapiro–Wilk p<0.0001) and were log transformed prior to statistical analyses.
Table 3.
UC781 Drug Concentrations in Rectal Tissue
| |
|
Location |
|||||
|---|---|---|---|---|---|---|---|
| |
|
10 cm |
30 cm |
||||
| Treatment | Study ID | V2 | V3 | V5 | V2 | V3 | V5 |
| 0.10% | 408 | BLQa | 37,200 | 101 | BLQ | 180 | 622 |
| 410 | BLQ | BLQ | BLQ | BLQ | BLQ | BLQ | |
| 418 | BLQ | 4,170 | BLQ | BLQ | 486 | BLQ | |
| 422 | BLQ | 22,800 | BLQ | BLQ | 1,460 | 20.1 | |
| 424 | BLQ | 4,790 | BLQ | BLQ | 1,710 | BLQ | |
| 425 | BLQ | 29,900 | BLQ | BLQ | 1,220 | BLQ | |
| 430 | BLQ | 15,600 | BLQ | BLQ | 780 | BLQ | |
| 439 | BLQ | 1,800 | BLQ | BLQ | 5,410 | BLQ | |
| 440 | BLQ | 1,910 | BLQ | BLQ | 3,460 | BLQ | |
| 443 | BLQ | 4,230 | BLQ | BLQ | 8,790 | BLQ | |
| 448 | BLQ | 9,450 | 1020 | BLQ | 4,830 | 84.2 | |
| 452 | BLQ | 2,370 | BLQ | BLQ | 720 | BLQ | |
| 0.25% | 405 | BLQ | 2,730 | 9580 | BLQ | 51.9 | 546 |
| 414 | BLQ | 76,600 | 559 | BLQ | 12,500 | 47.2 | |
| 420 | BLQ | 8,190 | BLQ | BLQ | 934 | BLQ | |
| 421 | BLQ | 26,700 | 1390 | BLQ | 2,450 | 351 | |
| 427 | BLQ | 50,600 | 14.4 | BLQ | 40,900 | BLQ | |
| 428 | BLQ | 6,150 | BLQ | BLQ | 45,800 | BLQ | |
| 431 | BLQ | 10,400 | BLQ | BLQ | 2,490 | BLQ | |
| 437 | BLQ | 25,400 | BLQ | BLQ | 12,500 | 15.2 | |
| 444 | BLQ | 15,900 | 361 | BLQ | 6,820 | BLQ | |
| 447 | BLQ | 47,400 | 117 | BLQ | 33,500 | BLQ | |
| 450 | BLQ | 8,340 | BLQ | BLQ | 4,750 | BLQ | |
| 453 | BLQ | 17,200 | BLQ | BLQ | 13,700 | BLQ | |
| Placebo | 401 | BLQ | BLQ | BLQ | BLQ | BLQ | BLQ |
| 407 | BLQ | BLQ | BLQ | BLQ | BLQ | BLQ | |
| 416 | BLQ | BLQ | BLQ | BLQ | BLQ | BLQ | |
| 417 | BLQ | BLQ | BLQ | BLQ | BLQ | BLQ | |
| 426 | BLQ | BLQ | BLQ | BLQ | BLQ | BLQ | |
| 429 | BLQ | BLQ | BLQ | BLQ | BLQ | BLQ | |
| 432 | BLQ | BLQ | BLQ | BLQ | BLQ | BLQ | |
| 438 | BLQ | BLQ | BLQ | BLQ | BLQ | BLQ | |
| 442 | BLQ | BLQ | BLQ | BLQ | BLQ | BLQ | |
| 445 | BLQ | BLQ | BLQ | BLQ | BLQ | BLQ | |
| 451 | BLQ | BLQ | BLQ | BLQ | BLQ | BLQ | |
| 455 | BLQ | BLQ | BLQ | BLQ | BLQ | BLQ | |
Below limit of quantitation (BLQ): <5 ng/g.
UC781 drug concentrations in rectal tissue for each participant's rectal biopsy, reported in ng/g by study ID, treatment group (0.1% UC781, 0.25% UC781, placebo), biopsy location (10 cm and 30 cm), and visit (V2, baseline; V3, single exposure; and V5, 7-day exposure).
Dose and location effects of 0.1% and 0.25% UC781 gel application at V3
At V3, after the single rectal microbicide application, differences in UC781 tissue concentration were found across treatments (p<0.0001) and locations (p=0.0013). The treatment×location interaction did not reach significance at alpha=0.05, but could be considered to be “marginally” significant (p=0.0506; Fig. 1a). At V3, tissue drug concentrations for 0.1% and 0.25% UC781 groups and at both locations (10 cm and 30 cm) were higher compared to the placebo (“Treatment vs. Placebo”; embedded table in Fig. 1a.). Additionally, there was a higher tissue concentration at the 10 cm biopsy location compared to the 30 cm biopsy location for the 0.10% UC781 treatment group (p=0.0166, “Treatment 10 cm vs. 30 cm”; embedded table in Fig. 1a.).
FIG. 1.

UC781 rectal tissue drug concentrations. Visit 3 (a), after single application of rectal microbicide gel and Visit 5 (b), after seven daily doses of rectal microbicide gel. The mean is displayed as a horizontal solid line. The horizontal dashed line indicates the lower limit of quantification for this assay (5 ng/g). Embedded tables show the probability values for the main effects of treatment (placebo, 0.1% and 0.25% UC781) and biopsy location (10, 30 cm) in the headers and the Tukey pairwise comparisons between each drug treated groups (0.1 and 0.25% UC781) and the placebo (treatment vs. placebo) and the effect of location (treatment at 10 cm vs. 30 cm) on log transformed UC781 tissue drug concentrations in the table. The treatment×location interaction for visits 3 and 5 are given as footnotes below each embedded table.
Dose and location effects of 0.25% UC781 gel application at V5
At V5, after the seven-daily rectal microbicide gel applications, there was an effect of treatment (p=0.0465, embedded Table in Fig. 1b) but no effect of biopsy location on tissue UC781 levels for the 0.1% gel. The treatment×location interaction was significant (p=0.0173; Fig. 1b). UC781 levels for the 0.25% gel treatment group were higher than the placebo at 10 cm (p=0.0247; embedded table in Fig. 1b). There was also an effect of location for the 0.25% treatment group at V5 where the 10 cm location provided a higher tissue concentration than the 30 cm location (p=0.00115; embedded table in Fig. 1b).
Rectal explant HIV-1 suppression correlated with tissue drug concentrations
UC781 in vivo biopsy tissue concentrations >5 ng/g (LLOQ) and ex vivo rectal biopsy HIV infection at 104 TCID50 from both V3 and V5 were used in the dose-response analyses. Infectibility results from the 10 cm and 30 cm locations were pooled for V3 and for V5 data points. All four infection endpoint measures were significantly and inversely correlated with tissue drug concentrations (Fig. 2a–d; linear slope probability values reported in embedded Table). The fit (r2) of the dose-response linear regressions was superior for SOFT and CUM, compared to AUC and SLOPE endpoints (Fig. 2; r2 embedded table). Although the percent variance accounted for by the linear dose-response curves was modest for SOFT and CUM (≈20–30%), the inverse slopes were clear (p<0.01; Embedded Table in Fig. 2). The AUC and SLOPE measurements showed heteroskedasticity (unequal variance) with greater variance at the higher infection/lower drug levels compared to the lower infection/higher drug levels (left vs. right halves of Fig. 2a and c). The linear dose-response analyses including visit (V3, V5) as a covariate factor remained significant for CUM (p=0.001) and SOFT (p=0.0078) but not SLOPE (p=0.7150) or AUC (p=0.8225).
FIG. 2.

Linear relationships between UC781 tissue concentrations and p24 biopsy infection yields. Significant correlations between UC781 tissue concentrations and degree of virus suppression for (a) AUC, (b) CUM, (c) SLOPE, and (d) SOFT. All subjects' samples exposed to 104 TCID50 HIVBaL were included. Data were pooled for the 10 and 30 cm biopsy locations for tissue biopsy results >5 ng/g (LOQ). Embedded table reports on the intercept, slope, probability of 0 slope (“Probability”), and the correlation coefficient (r2) for the linear least squares fit.
Application of “infected/noninfected” thresholds (cut-points) to tissue infectibility measures to clarify potential dose-response correlations in small trials
A series of cut-points for infectibility or noninfectibility were applied, per infectibility measure. A sliding scale for cut-points was used, where endpoint values at or lower than each cut-point level were categorized as “noninfected” and endpoint values higher than each cut-point were categorized as “infected.” For example, using the cut-point of 200 pg/ml p24 would categorize all assays with a p24 level ≤200 pg/ml p24 as “noninfected” and all assays with a p24 level above 200 as “infected.”
Candidate infectibility measures for “infected/noninfected” categorization
SOFT and CUM measures were considered candidate endpoints for the Boolean infection/noninfection categorization due to both the fit of the linear relationship with tissue UC781 and relatively high measurement precision (above). Specifically, SOFT and CUM measures presented clear, statistically significant, linear dose-response relationships (Fig. 2b and d), intersubject and intrasubject %RSDs <35% (Table 1), and evidence for measurement reproducibility over time (Table 2) for infectibility measured after a 104 titer. However, the CUM endpoint provided a difficult conceptualization for a cut-point intended to enable comparison of the same drug efficacy between different laboratories and explant models of different duration and tissue source. Without other confounders, a longer assay duration would increase this cumulative p24 measure and a shorter assay duration would reduce cumulative p24. A 14-day explant assay duration was used here whereas explant assay durations ranging from 10 to 21 days have been reported elsewhere.6,20 As long as an explant assay has been designed to allow the system to reach the SOFT endpoint, SOFT will be identical irrespective of the duration of the assay beyond that point. Cumulative p24 (CUM) is the sum of p24 across assay days so that the cumulative p24 will increase with increasing length of the assay assuming measurable virus is found at all time points. For example, a mean cumulative p24 of 1567.34 pg/ml would have been reduced to 712.35 pg/ml if the assays presented here had extended to only 10 days instead of 14 (p<0.001; paired t-test). As one of the aims of this study was to present a cut-point that could be used to compare drug efficacy across laboratories using a variety of explant protocols (e.g., assay durations between 6 and 16 days), CUM was not used in the logistic regression analyses. SOFT is reached at a time point after exponential virus growth has been achieved and before cell death occurs, so providing an endpoint that is, theoretically, less affected by assay duration assuming that the explant protocol captures the kinetics of HIV virus growth.
SOFT “infected/noninfected” categorization
For the Boolean categorization, the SOFT endpoint was used and provided 12 cut-points ranging from 200 to 1300 p24 pg/ml, increasing in increments of 100. Explant assay SOFT values at or lower than each cut-point level were categorized as “noninfected” and explant assay SOFT values higher than the cut-point were categorized as “infected.”
Calculation of in vivo tissue concentrations correlating with 50, 90, and 95% suppression of rectal biopsy infectibility ex vivo (EC50,90,95)
Explant assays at V3 and V5, following the 104 titer inoculation and categorized using each cut-point, were entered into a series of logistical regression (LR) analyses, one LR per cut-point. The p24 (SOFT) cut-points are shown in Fig. 3a and b and Table 4. Tissue UC781 concentrations were used to predict the infected/noninfected explant outcome, that is “infected” or “noninfected” based on each cut-point, by LR. The results of these analyses are shown in Fig. 3a and b and Table 4. EC50, EC90, and EC95 tissue UC781 concentrations were interpolated from each LR curve to calculate the tissue drug concentration (ng/g) predicted to provide 50, 90, and 95% “noninfected” biopsies. The area under the ROC (receiver operator characteristic) curve is referred to as “C” and is a measure of the fit of each model where a C value of 1 indicates a perfectly predicting model (i.e., zero false positives and negatives). The LR at the cut-point of 200 p24 pg/ml provided an EC50 of 3.33 log10 ng/g UC781 (first arrow from the left, Fig. 3a; EC50=3.33 log10 ng/g Table 4) and a relatively low fit (C=0.78; “C” Table 4). In contrast, a cut-point of 1,100 p24 (third arrow from the left; Fig. 3a) provided a lower EC50 of 2.00 log10 ng/g UC781 (Table 4) and a better fit (C=0.911; Table 4).
FIG. 3.

Logistic regression results where rectal tissue (PK) UC781 concentrations predicted infected/noninfected (PD) status of HIV-1-infected rectal tissue explants. The data presented include only those rectal biopsies infected with 104 TCID50 HIV and with detectable UC781 levels. The infected/noninfected categorization was based on p24 (pg/ml) levels at the soft endpoint (SOFT), where an explant assay with a p24 SOFT greater than or equal to the p24 cut-point was classified as “infected” and an explant assay with a p24 SOFT lower than the p24 cut-off was “noninfected.” A range of p24 cut-point levels was tested (200–1300 p24 pg/ml). (a) Shows that for each cut-point p24 level there is a calculated EC50 (dashed line), which is the concentration of UC781 predicted to result in a 50% HIV inhibition (noninfected) rate, and a calculated EC90 (gray line) and EC95 (black line), which are the concentrations of UC781 predicted to result in a 90% and 95% explant HIV inhibition (noninfected) rate. (b) Identifies the area under the receiver operator characteristic (ROC) curve (“C”: dotted line). C is a measure of the goodness of fit of each logistic regression model where a value of 1 indicates a perfectly predicting logistic curve (i.e., zero false positives and negatives).
Table 4.
Results from a Series of Logistic Regression Analyses Correlating Tissue UC781 Levels with Ex Vivo Biopsy Infection
| |
Biopsy UC781 (log10 ng/g) |
|
||||
|---|---|---|---|---|---|---|
| p24 (pg/ml) SOFT cut-point | EC50 | EC90 | EC90–EC50 | EC95 | EC95–EC50 | C |
| 200 | 3.33 | n/ca | n/c | n/c | n/c | 0.778 |
| 300 | 3.09 | 4.88 | 1.80 | n/c | n/c | 0.767 |
| 400 | 2.89 | 4.88 | 1.99 | n/c | n/c | 0.743 |
| 500 | 2.69 | 4.88 | 2.19 | n/c | n/c | 0.717 |
| 600 | 2.50 | 4.73 | 2.24 | n/c | n/c | 0.707 |
| 700 | 2.40 | 4.56 | 2.17 | n/c | n/c | 0.742 |
| 800 | 2.13 | 4.15 | 2.02 | 4.69 | 2.56 | 0.785 |
| 900 | 2.13 | 4.15 | 2.02 | 4.69 | 2.56 | 0.785 |
| 1000 | 2.13 | 3.90 | 1.77 | 4.39 | 2.26 | 0.833 |
| 1100 | 2.00 | 3.52 | 1.52 | 3.79 | 1.78 | 0.911 |
| 1200 | 1.72 | 3.57 | 1.85 | 3.96 | 2.24 | 0.882 |
| 1300 | 1.18 | 3.20 | 2.03 | 3.67 | 2.49 | 0.86 |
n/c, nonconverged, noncalculable.
Biopsy infection was determined based on progressively increasing p24 (pg/ml) SOFT cut-points where an “uninfected” assay was a biopsy result equal/less than the cut-point and an “infected” biopsy result was greater than the cut-point. EC50, EC90, and EC95 are interpolated at the points on the logistic regression curve to predict the tissue UC781 concentration necessary for 50%, 90%, and 95% of biopsy infections to be categorized as uninfected. Biopsy results were entered into this analysis as the SOFT averaged across two replicate biopsy assays (104 TCID50 HIV), for subjects in the 0.1% (n=12) and 0.25% (n=12) treatment groups at each location (10 and 30 cm) and at each visit where this treatment was applied (V3 and V5). Detectable tissue UC781 (i.e., ≥5ng/g; n=22/24 at V3; 7/24 at V5) concentrations were correlated with the infection results. C is the area under the receiver operator curve and is a measure of the goodness of fit of each logistic regression (a value of 1 indicates a perfectly predicting logistic curve, i.e., zero false positives and negatives).
Using this approach, a UC781 tissue concentration of 2.00 log10 ng/g was predicted to hold 50% of rectal biopsy p24 infections at 1,100 pg/ml p24 SOFT or less (using a 104 TCID50 HIV titer). However, a UC781 tissue concentration of 3.33 log10 ng/g was predicted to keep infections at 200 pg/ml p24 or less 50% of the time, consistent with the expectation of more drug associated with more suppression of tissue infectibility for an efficacious product. To hold ex vivo HIV tissue infection to at or below 800 pg/ml p24 (SOFT) in at least 90% (EC90) of explants, a UC781 tissue concentration of at least 4.15 log10 ng/g was predicted and for the stricter outcome of finding a ≤800 p24 pg/ml in 95% of explants at least 4.69 log10 tissue ng/g UC781 would be required (Table 4).
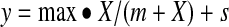
To estimate the gel concentration of UC781 that would be needed to provide tissue concentrations in the range of 4.15–4.69 log10 ng/g (Table 4; cut-point 800 p24 pg/ml) using the average tissue levels found at V3 (following the clinician applied gel, at 10 cm) a nonlinear mixed effect model (Eq. 3) was fit to the tissue UC781 results at V3 (Fig. 4).
 |
(3) |
FIG. 4.

Nonlinear mixed effect model of UC781 gel concentration and rectal tissue (PK) UC781 concentrations at V3 (10 cm location). Open circles represent UC781 tissue concentrations and the solid line represents a nonlinear mixed effect model [y=max • x/(m+x)+s] where y=tissue UC781 concentration, x=gel UC781 concentration, max=maximum drug tissue concentration, m=gel concentration necessary to reach the half maximal drug tissue concentration, and s=subject error term,±95% confidence interval (dashed lines).
where max=maximum drug tissue concentration, m=gel concentration necessary to reach a half maximal drug tissue concentration, x=UC781 gel concentration at V2, and s=normally distributed subject random factor.
Using this formula, a maximum drug tissue concentration of 4.77 log ng/g was predicted where 0.03% gel (m) was the gel concentration necessary to reach a half maximal drug tissue concentration. The model predicted that 0.22% UC781 in a gel would deliver 4.15 (3.77–4.57; 95% CI) UC781 log10 tissue ng/g and a 0.88% gel would deliver a tissue drug level of 4.60 UC781 log10 tissue ng/g (3.77–5.42; Fig. 4). The highest concentration used in the clinical trial was 0.25%, which did show significant suppression of tissue infectibility and approaches the modeled EC90.
Both EC50 and EC90 UC781 biopsy concentrations decreased with increasing p24 SOFT cut-point levels (Fig. 3a). The use of a range of different cut-points in the logistic regression analysis provided a measure of internal reliability where the EC90 was consistently ≈2 logs higher than the EC50, and the EC95 was ≈2.5 logs higher than the EC50 across the cut-points tested, where these endpoints were calculable (Table 4). Note that the EC90 was noncalculable for the strictest cut-point tested of 200 pg/ml and the EC95 was calculable only for cut-points ≥800 p24 pg/ml. Higher p24 cut-points provided more accurately predicting models where the fit of the model (“C”) tended to increase with increasing p24 cut-point level (Fig. 3b). The logistical regression models using between 1000 and 1200 p24 pg/ml cut-points provided the best fit for these data (Fig. 3b).
Discussion
Four virus growth endpoints (CUM, SOFT, AUC, and SLOPE) were correlated with UC781 tissue drug concentrations from a Phase 1 rectal microbicide trial, and provided evidence of PK-PD dose-response relationships, correlating in vivo drug exposure (PK) and inhibition of ex vivo tissue infectibility by HIV-1 (PD). Explant assay precision, reproducibility, and PK:PD relationships with tissue drug concentrations depended upon the endpoint used to characterize the virus growth curve. A categorical definition of a tissue/explant either being “infected” or “noninfected” provided a means to correlate explant infection status directly with tissue drug concentrations, so providing a measure of drug efficacy. This categorization was applied where there was a clear, strong, linear relationship between drug dose and inhibitory response with relatively high measurement precision and reproducibility over time.
There is currently no consensus on the optimal/preferred virological endpoint for characterizing explant/tissue infectibility assays. Increased precision in quantifying HIV replication in tissue explants will increase the ability to evaluate PK:PD interactions. In this Phase 1 study, the intrasubject and intersubject reproducibility of four approaches to quantify virus growth endpoints was compared using two titers of HIV-1 virus to infect ex vivo freshly acquired tissue biopsies obtained at two different levels in the distal colon during the baseline (non-drug-exposed) visits. Each infection experiment quantified ongoing HIV infection over 14 days and four virus growth endpoints were calculated from the resulting virus growth curves. SLOPE provided poor precision and both SLOPE and AUC were heteroskedastic, that is, measurement variability was not constant. Heteroskadiscity is a major concern for least-squares regression analyses21 as unequal variability reduces the reliability of parameter estimates. TCID50 HIV titer had a considerable impact on both biopsy measurement precision and reproducibility results, where the 104 titer decreased both intersubject and intrasubject measurement variance. Further support for selecting the same batch/lot of a common laboratory R5 viral strain (HIVBaL) was based on published data22 where use of the same virus batch/lot is the single most impacting factor in tissue infectibility across research laboratories.13 SOFT and CUM measurements at the 104 titer were found to have relatively high reliability and provided evidence of between-visit reproducibility. SOFT was considered to provide an endpoint that was less directly affected by the duration of the explant assay than CUM as the latter, by definition, would increase for longer assay durations.
Given the tissue infectibility data from RMP-01 and statistically significant correlation with tissue UC781 drug concentrations, a Boolean cut-point method was applied to SOFT, a relatively reproducible endpoint that could be applied to interlaboratory comparisons of assays varying in duration. The binary infected/noninfected categorized explant results were entered into logistical regression analyses to correlate tissue drug levels with explant infectivity. Logistical regression analysis was used to calculate drug concentrations necessary to inhibit virus growth in 50, 90, and 95% of explants (i.e., EC50,90,95). This modeling approach enabled determination of the percent UC781 in a gel product necessary to provide a predicted percentage (e.g., 50, 90, and 95%) of tissues/explants “noninfected.”
The logistic regression approach used here allowed calculation of EC50,90,95 values that were found to be inversely related to SOFT p24 cut-point level. In this setting, a lower cut-point, which is a more stringent test of tissue infectibility, was associated with a higher EC50. When a stricter cut-point was used (e.g., 200 pg/ml p24 versus 1,100 pg/ml p24), a higher concentration of tissue UC781 was predicted to be required to achieve this noninfection status. Conversely, using a more liberal cut-point, 1,100 p24 for example, less UC781 in the tissue was predicted to be required to achieve a noninfection status.
Using this approach, investigators can project what drug tissue concentration might be needed to maintain the explant p24 below a certain level. In this rectal explant model, about 500 ng/g UC781 in rectal tissue was predicted to maintain 50% of explants as “noninfected” (where noninfected is an explant assay providing ≤500 pg/ml p24 at the SOFT endpoint). As only explants with detectable drug were used in this PK:PD analysis, baseline (and placebo) biopsy measurements were not used, so reducing this potential source of intrasubject variance from the resultant drug efficacy calculations. This experimental design and analysis approach allow for comparisons of microbicide efficacy (i.e., EC50,90,95) between drugs, HIV strain, HIV titer, physiological compartments, and application methods.
When using a nonlinear model, the mean tissue concentrations of the two UC781 gel doses from the participants correlated with the UC781 range of concentrations predicted within the EC90,95 ranges. The user-control in defining the desired cut-point provides a sliding scale where the final cut-point chosen may depend on the explant model used. This approach does not propose using a single p24 readout, a single drug metabolite, compartment measurement, or a single cut-point. These may vary with each tissue and each drug tested. What the approach does demonstrate is that with sufficient data points for both infectibility and tissue PK readouts, it is feasible to calculate EC50,90,95 ranges. The concentration of drug in the tissue is affected by many factors, especially subject adherence. Lack of adherence is the most likely explanation for the low and nondetectable tissue drug levels following the 7-day self-administration phase; a second possibility is the luminal elimination of the last dose due to physiological peristalsis, especially with a relatively nonabsorbable product.7
Measurements of both the degree of ex vivo suppression of HIV infection and in vivo UC781 concentrations in concurrently acquired rectal tissues biopsies in this Phase 1 trial provided the first opportunity to correlate the two, as a compartmental PK:PD model. These correlates permitted modeling of the predicted efficacy of both actual as well as “virtual” product formulations. In this trial, the predicted EC90 falls in the range of the 0.25% UC781 used. Intensification of Phase 1 trials to include the collection of direct (or proven correlates) tissue drug concentrations and suppression of tissue infectibility will enable more extensive use of PK:PD modeling where this approach may allow prioritization of pipeline microbicides and reduce the risk of ineffective later Phase trials.
Acknowledgments
Deep appreciation is due to the dedicated participants who enrolled in this intensive study as well as those individuals/authors of the original trial publication that provided the primary and derived data used herein. The primary RMP-01 UC761 Phase 1 trial was published with supplemental data, including the study protocol, and is registered at www.Clinical-Trials.gov (NCT00984971).
The original study as well as most of the work for this publication was funded by a U19 grant under the Integrated Preclinical-Clinical Program for HIV Topical Microbicides (IPCP-HTM), Division of AIDS (DAIDS), National Institute of Allergy and Infectious Diseases (NIAID), National Institutes of Health (NIH) (AI060614). Work was also supported, in part, by a subcontract with Advanced BioScience Laboratories, Inc., Rockville, MD through an NIH/NIAID/DAIDS contract: “Comprehensive Resources for HIV Microbicides and Biomedical Prevention” (#HHSN272201000001C). The opinions expressed herein do not represent opinions or statements made or expressed by the U.S. Department of Health and Human Services.
Author Disclosure Statement
No competing financial interests exist.
References
- 1.McGowan I. Microbicides for HIV prevention: Reality or hope? Curr Opin Infect Dis. 2010;23:26–31. doi: 10.1097/QCO.0b013e328334fe70. [DOI] [PubMed] [Google Scholar]
- 2.McGowan I. Rectal microbicides: Can we make them and will people use them? AIDS Behav. 2011;15(Suppl 1):S66–71. doi: 10.1007/s10461-011-9899-9. [DOI] [PMC free article] [PubMed] [Google Scholar]
- 3.Hendrix CW. Cao YJ. Fuchs EJ. Topical microbicides to prevent HIV: Clinical drug development challenges. Annu Rev Pharmacol Toxicol. 2009;49:349–375. doi: 10.1146/annurev.pharmtox.48.113006.094906. [DOI] [PubMed] [Google Scholar]
- 4.Patterson KB. Prince HA. Kraft E. Jenkins AJ. Shaheen NJ. Rooney JF, et al. Penetration of tenofovir and emtricitabine in mucosal tissues: Implications for prevention of HIV-1 transmission. Sci Transl Med. 2011;3:112re4. doi: 10.1126/scitranslmed.3003174. [DOI] [PMC free article] [PubMed] [Google Scholar]
- 5.Abner SR. Guenthner PC. Guarner J. Hancock KA. Cummins JE., Jr Fink A, et al. A human colorectal explant culture to evaluate topical microbicides for the prevention of HIV infection. J Infect Dis. 2005;192:1545–1556. doi: 10.1086/462424. [DOI] [PubMed] [Google Scholar]
- 6.Fletcher PS. Elliott J. Grivel JC. Margolis L. Anton P. McGowan I, et al. Ex vivo culture of human colorectal tissue for the evaluation of candidate microbicides. AIDS. 2006;20:1237–1245. doi: 10.1097/01.aids.0000232230.96134.80. [DOI] [PubMed] [Google Scholar]
- 7.Anton PA. Saunders T. Elliott J. Khanukhova E. Dennis R. Adler A, et al. First phase 1 double-blind, placebo-controlled, randomized rectal microbicide trial using UC781 gel with a novel index of ex vivo efficacy. PLoS One. 2011;6:e23243. doi: 10.1371/journal.pone.0023243. [DOI] [PMC free article] [PubMed] [Google Scholar]
- 8.Anton P. A phase 1 placebo-controlled trial of rectally applied 1% vaginal TFV gel with comparison to oral TDF [Abstract]; In 18th Conference on Retroviruses and Opportunistic Infections Boston 2011; Boston. 2011. [Google Scholar]
- 9.McGowan I. Elliott J. Cortina G. Tanner K. Siboliban C. Adler A, et al. Characterization of baseline intestinal mucosal indices of injury and inflammation in men for use in rectal microbicide trials (HIV Prevention Trials Network-056) J Acquir Immune Defic Syndr. 2007;46:417–425. doi: 10.1097/QAI.0b013e318156ef16. [DOI] [PubMed] [Google Scholar]
- 10.Shacklett BL. Yang O. Hausner MA. Elliott J. Hultin L. Price C, et al. Optimization of methods to assess human mucosal T-cell responses to HIV infection. J Immunol Methods. 2003;279:17–31. doi: 10.1016/s0022-1759(03)00255-2. [DOI] [PubMed] [Google Scholar]
- 11.Herrera C. Cranage M. McGowan I. Anton P. Shattock RJ. Reverse transcriptase inhibitors as potential colorectal microbicides. Antimicrob Agents Chemother. 2009;53:1797–1807. doi: 10.1128/AAC.01096-08. [DOI] [PMC free article] [PubMed] [Google Scholar]
- 12.Saba E. Grivel JC. Vanpouille C. Brichacek B. Fitzgerald W. Margolis L, et al. HIV-1 sexual transmission: early events of HIV-1 infection of human cervico-vaginal tissue in an optimized ex vivo model. Mucosal Immunol. 2010;3:280–290. doi: 10.1038/mi.2010.2. [DOI] [PMC free article] [PubMed] [Google Scholar]
- 13.Richardson-Harman N. Lackman-Smith C. Fletcher PS. Anton PA. Bremer JW. Dezzutti CS, et al. Multisite comparison of anti-human immunodeficiency virus microbicide activity in explant assays using a novel endpoint analysis. J Clin Microbiol. 2009;47:3530–3539. doi: 10.1128/JCM.00673-09. [DOI] [PMC free article] [PubMed] [Google Scholar]
- 14.Yeh SH. Using the trapezoidal rule for the area under the curve calculation. SAS® Users Group International. 1991;27:229–227. [Google Scholar]
- 15.Flint SJ. Enquist LW. Racaniello VR. Skalka AM. Principles of Virology: Molecular Biology, Pathogenesis, and Control of Animal Viruses. 2nd. ASM Press; Washington, DC: 2004. [Google Scholar]
- 16.Tsai WP. Conley SR. Kung HF. Garrity RR. Nara PL. Preliminary in vitro growth cycle and transmission studies of HIV-1 in an autologous primary cell assay of blood-derived macrophages and peripheral blood mononuclear cells. Virology. 1996;226:205–216. doi: 10.1006/viro.1996.0648. [DOI] [PubMed] [Google Scholar]
- 17.Tiwari GT. Bioanalytical method validation: An updated review. Pharmaceutical Methods. 2010;1:25–38. doi: 10.4103/2229-4708.72226. [DOI] [PMC free article] [PubMed] [Google Scholar]
- 18.Endrenyi L. Schulz M. Individual variation and the acceptance of average bioequivalence. Drug Inform J. 1993;27:195–201. [Google Scholar]
- 19.U.S. Department of Health and Human Services, FDA, Center for Drug Evaluation and Research: Guidance for Industry: Statistical Approaches to Establishing Bioequivalence. Edited by the Office of Training and Communications DoCM, Drug Information Branch, HFD-210. U.S. Department of Health and Human Services; Rockville, MD: 2001. [Google Scholar]
- 20.Dezzutti CS. Russo J. Rohan LC. Wang L. Swanson M. Chateau M. McGowan I. Rectal-specific 1% tenofovir (TFV) gel protects rectal biopsies from infection with HIV-1 transmitted/founder viruses [Abstract]; In International Conference of Microbicides; Sydney, Australia. 2012. [Google Scholar]
- 21.Wild D. The Immunoassay Handbook. 2nd. Nature Pub. Group; London: 2001. [Google Scholar]
- 22.Hladik F. Doncel GF. Preventing mucosal HIV transmission with topical microbicides: Challenges and opportunities. Antiviral Res. 2010;88(Suppl 1):S3–9. doi: 10.1016/j.antiviral.2010.09.011. [DOI] [PMC free article] [PubMed] [Google Scholar]