

Abstract
Whole-cell patch-clamp recordings and high-resolution 3D morphometric analyses of layer 3 pyramidal neurons in in vitro slices of monkey primary visual cortex (V1) and dorsolateral granular prefrontal cortex (dlPFC) revealed that neurons in these two brain areas possess highly distinctive structural and functional properties. Area V1 pyramidal neurons are much smaller than dlPFC neurons, with significantly less extensive dendritic arbors and far fewer dendritic spines. Relative to dlPFC neurons, V1 neurons have a significantly higher input resistance, depolarized resting membrane potential, and higher action potential (AP) firing rates. Most V1 neurons exhibit both phasic and regular-spiking tonic AP firing patterns, while dlPFC neurons exhibit only tonic firing. Spontaneous postsynaptic currents are lower in amplitude and have faster kinetics in V1 than in dlPFC neurons, but are no different in frequency. Three-dimensional reconstructions of V1 and dlPFC neurons were incorporated into computational models containing Hodgkin–Huxley and AMPA receptor and GABAA receptor gated channels. Morphology alone largely accounted for observed passive physiological properties, but led to AP firing rates that differed more than observed empirically, and to synaptic responses that opposed empirical results. Accordingly, modeling predicts that active channel conductances differ between V1 and dlPFC neurons. The unique features of V1 and dlPFC neurons are likely fundamental determinants of area-specific network behavior. The compact electrotonic arbor and increased excitability of V1 neurons support the rapid signal integration required for early processing of visual information. The greater connectivity and dendritic complexity of dlPFC neurons likely support higher level cognitive functions including working memory and planning.
Introduction
A fundamental but elusive goal of systems neuroscience is to determine precisely how different neocortical areas, such as the primary visual cortex (V1) and the dorsolateral granular prefrontal cortex (dlPFC), perform highly distinct and specialized functions in primates. It has long been known that cortical areas can be differentiated based on cytoarchitectural features and connectivity patterns, but relatively little information is available about key differences in the fundamental properties of pyramidal neurons that might contribute to the functional specificity of a given area. Pyramidal neurons form the basic building blocks of neocortical circuits, with sustained alterations in their action potential (AP) firing rates (FRs) representing a temporally precise encoding of information—about the visual field in the case of V1 (Hubel and Wiesel, 1963; Wiesel and Hubel, 1963; Desbordes et al., 2008; Chen et al., 2009), or information stored “on-line” during the execution of working memory tasks in the case of dlPFC (Fuster and Alexander, 1971; Funahashi et al., 1989, 1990; Miller, 2000; Cromer et al., 2010; Seger and Miller, 2010). Thus, a detailed understanding of the regional variations in pyramidal neuron morphological and physiological characteristics is a prerequisite for understanding how neurons operate within local circuits in distinct cortical areas.
Early studies established that morphological features of pyramidal neurons are not homogeneous across the neocortex, but vary widely from one cortical area to another (Ramón y Cajal, 1894; Conel, 1941, 1967). More recently, Elston and Rosa (1997, 1998) (for review, see Elston, 2003) have performed systematic studies demonstrating that layer 3 pyramidal neuron basal dendritic morphology varies significantly across the cortical neuraxis in the rhesus monkey, becoming increasingly complex in a caudal-to-rostral progression from V1 to PFC. Thus, the basal dendritic arbors of PFC neurons are significantly larger and more complex, and possess up to 16 times more dendritic spines compared with V1 neurons (Elston, 2000, 2002; Elston et al., 2001). Computational modeling studies predict that dendritic morphological parameters, including length, diameter, branching topology, and density of spines, play critical roles in determining neuronal firing patterns (Mainen and Sejnowski, 1996; Koch and Segev, 2000; Ascoli, 2003; London and Häusser, 2005; Weaver and Wearne, 2008). Recent simulations also show that the efficacy of AP backpropagation is largely determined by variations in dendritic morphology (Vetter et al., 2001; Tsay and Yuste, 2002; Acker and White, 2007).
In the present study, we used both empirical and computational approaches to assess, for the first time, whether morphological differences between V1 and dlPFC neurons in the monkey brain are associated with distinctive electrophysiological properties. Whole-cell patch-clamp recordings and highly accurate 3D neuronal reconstructions revealed marked electrophysiological and structural differences between V1 and dlPFC pyramidal neurons. Computational modeling of these data revealed that structural differences can, in large part, account for differences in passive properties but not in AP firing or synaptic response properties. Such differences in functional properties at the single-neuron level undoubtedly contribute to differences in network behavior and the capacity of these cortical areas to perform distinct and specialized tasks.
Materials and Methods
Experimental subjects.
Eight adult (5–11 years old, 6 male and 2 female) rhesus monkeys (Macaca mulatta) were used in this study; these animals were part of a larger cohort of monkeys used in a program of studies on normal aging in nonhuman primates. Monkeys were obtained from the Yerkes National Primate Research Center at Emory University (Atlanta, GA) and were housed individually in a colony room (under a 12 h light/dark cycle) in the Laboratory Animal Science Center (LASC) at Boston University School of Medicine (BUSM). Animal maintenance and research were conducted in strict accordance with the animal care guidelines outlined in the NIH Guide for the Care and Use of Laboratory Animals and the U.S. Public Health Service Policy on Humane Care and Use of Laboratory Animals. Both the BUSM LASC and the Yerkes National Primate Research Center are fully accredited by the Association for Assessment and Accreditation of Laboratory Animal Care and approved all procedures described in this study.
Preparation of slices.
Monkeys were sedated with ketamine hydrochloride (10 mg/ml), then deeply anesthetized with sodium pentobarbital (to effect, 15 mg/kg, i.v.), and a craniotomy was then performed. Following a thoracotomy, monkeys were killed by exsanguination while being perfused through the ascending aorta with ice-cold Krebs-Henseleit buffer [concentrations (in mm): 6.4 Na2HPO4, 1.4 Na2PO4, 137 NaCl, 2.7 KCl, 5 glucose, 0.3 CaCl2, 1 MgCl2, pH 7.4; Sigma-Aldrich]. During perfusion, 10 mm3 blocks of V1 and dlPFC were removed from the left hemisphere. As shown in Figure 1A the V1 (area 17, striate cortex) block was obtained from the operculum of the primary visual cortex and the dlPFC (area 46) block was obtained from the middle of the sulcus principalis, with recordings restricted to the middle of the ventral bank of the sulcus. Tissue blocks were sectioned into 300-μm-thick coronal slices in ice-cold Ringer's solution [concentrations (in mm): 26 NaHCO3, 124 NaCl, 2 KCl, 3 KH2PO4, 10 glucose, 1.3 MgCl2, pH 7.4; Sigma-Aldrich] with a vibrating microtome. Slices were then immediately placed into room temperature, oxygenated (95% oxygen, 5% CO2) Ringer's solution. Following equilibration for ∼1 h, individual slices were placed in submersion-type recording chambers (Harvard Apparatus) mounted on the stages of Nikon E600 infrared-differential interference contrast (IR-DIC) microscopes (Micro Video Instruments). During recording (∼15 min), slices were continuously superfused with room temperature, oxygenated Ringer's solution (2–2.5 ml/min).
Figure 1.
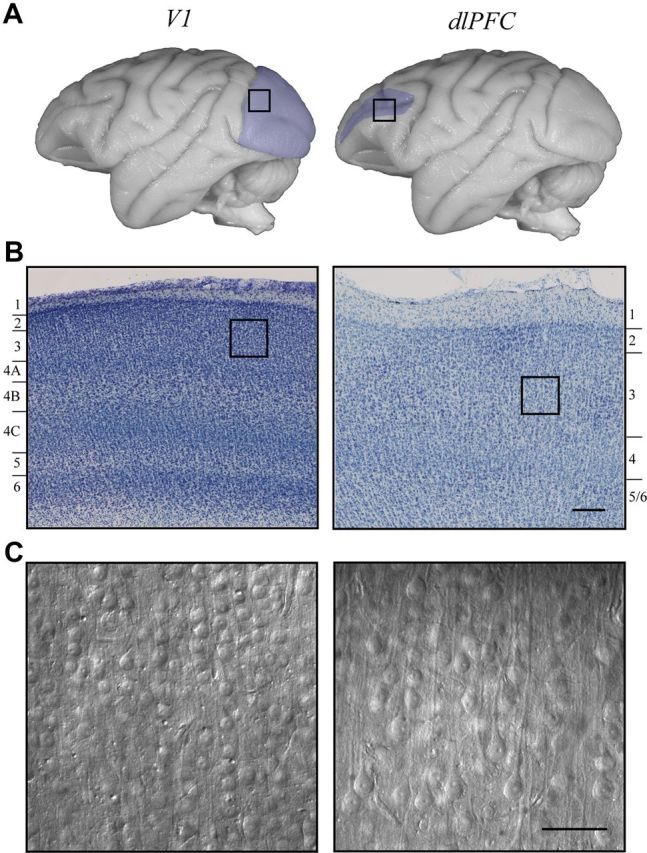
Representative V1 and dlPFC cytoarchitecture. A, Photomicrographs of the rhesus monkey brain with black boxes indicating areas from which V1 (left, shaded in blue) or dlPFC (right, shaded in blue) blocks were taken. B, Nissl-stained 60 μm-thick sections of V1 (left) and dlPFC (right). Note the difference in thickness of layers 1–3, as well as the overall difference in layering pattern between the two brain areas. C, Photomicrographs of in vitro slices of V1 and dlPFC visualized under IR-DIC optics. Note the difference in size and density of neuronal somata in the two areas. Scale bars: B, 200 μm; C, 100 μm.
Whole-cell patch-clamp recordings.
Layer 3 pyramidal neurons in V1 and dlPFC slices were visually identified under IR-DIC optics (Fig. 1C). For assessment of electrophysiological properties and for cell filling, standard tight-seal, whole-cell patch-clamp recordings were performed as previously described (Luebke and Chang, 2007; Luebke and Amatrudo, 2012). Electrodes were fabricated on a horizontal Flaming and Brown micropipette puller (model P-87, Sutter Instruments) and filled with potassium methanesulfonate-based internal solution [concentrations (in mm): 122 KCH3SO3, 2 MgCl2, 5 EGTA, 10 NaHEPES, 1% biocytin, pH 7.4; Sigma-Aldrich]. In external (Ringer's) solution, electrodes had resistances of 3–6 MΩ. Data were acquired with PatchMaster acquisition software on EPC-9 or EPC-10 patch-clamp amplifiers (HEKA Elektronik). Signals were low-pass filtered at 10 kHz, and access resistance was monitored for the duration of each experiment.
Passive membrane properties and AP firing properties.
A series of 200 ms hyperpolarizing and depolarizing current pulses (10 pA steps, −40 to +40 pA) were used for determination of passive membrane properties (resting membrane potential, input resistance, and membrane time constant) as well as single AP properties (threshold, amplitude, duration at half-maximal amplitude, rise time, and fall time). Resting membrane potential was measured as the membrane voltage in the absence of current injection. Input resistance was determined by the slope of a best-fit line through the linear portion of a current–voltage (I–V) plot. Membrane time constant was assessed by fitting a single-exponential function to the membrane potential response to the −10 pA hyperpolarizing current step. The first AP elicited in the current-clamp series was used for the assessment of single AP properties, which were measured on an expanded timescale using the FitMaster software linear measurement function (HEKA Elektronik). Threshold was measured as the sharp, upward deflection in the voltage trace. Amplitude was assessed as the difference in voltage between AP threshold and the peak amplitude. Duration was measured at half maximal amplitude. Rise and fall times were defined as the duration from threshold to peak amplitude during the upward and downward voltage deflection, respectively. Rheobase was assessed as the current required to evoke a single AP during a 10 s depolarizing current ramp (0–200 pA). Repetitive AP firing was assessed using a series of 2 s hyperpolarizing and depolarizing current steps (−170 to +380 pA using either 20 or 50 pA increments).
Spontaneous EPSCs and IPSCs.
Spontaneous EPSCs (sEPSCs) and spontaneous IPSCs (sIPSCs) were recorded for 2 min from holding potentials of −80 and −40 mV, respectively. Synaptic current data were analyzed using the MiniAnalysis software program (Synaptosoft). The event detection threshold was set at the maximum root mean squared noise level (5 pA). The postsynaptic current (PSC) properties assessed were as follows: frequency, amplitude, area, and kinetics (rise time constant, decay time constant, half-width).
Slice processing.
During recording, neurons were simultaneously filled with biocytin. Slices containing filled neurons were then fixed in 4% paraformaldehyde in 0.1 m PBS solution, pH 7.4, at 4°C for 2 d. Following rinsing with PBS, slices were placed in 1% Triton X-100/PBS at room temperature for 2 h and were subsequently incubated with streptavidin-Alexa Fluor 488 (1:500; Invitrogen) at 4°C for 2 d. Following incubation, slices were mounted on slides with Prolong Gold mounting medium (Invitrogen) and coverslipped.
Confocal imaging and preprocessing of image stacks.
Fluorescently labeled neurons were imaged using a Zeiss 510 confocal laser-scanning microscope. Fluorescence emitted by Alexa Fluor 488 (argon laser excitation) was collected using a 505 nm long-pass filter. For assessment of dendritic morphology and total spine counts, 40× (1.5 digital zoom) image stacks were acquired using a Plan-Apochromat 40×/1.3 numerical aperture (NA) oil-immersion objective lens (210 μm working distance) at a resolution of 0.1 × 0.1 × 0.2 μm per voxel (153 μm2 field of view). For measurement of dendritic diameter and for spine subtyping analyses, 100× (2.0 digital zoom) image stacks were acquired using a UPlan-FL 100x/1.3 NA oil-immersion objective lens (100 μm working distance) from one basal dendritic branch (∼100 μm in length), the middle third of the main apical trunk (∼45 μm in length) and from one distal–apical dendritic branch (∼140 μm in length) at a resolution of 0.022 × 0.022 × 0.1 μm per voxel (45 μm2 field of view). Image stacks were deconvolved using Autodeblur Classic software (Media Cybernetics) to remove spherical aberrations due to the point-spread function and to reduce signal blurring in the z-plane. For each neuron, Volume Integration and Alignment System (VIAS) software (Fig. 2A,B, left panels) (Rodriguez et al., 2003) was used to align deconvolved stacks and to integrate them together into a single, volumetric dataset.
Figure 2.
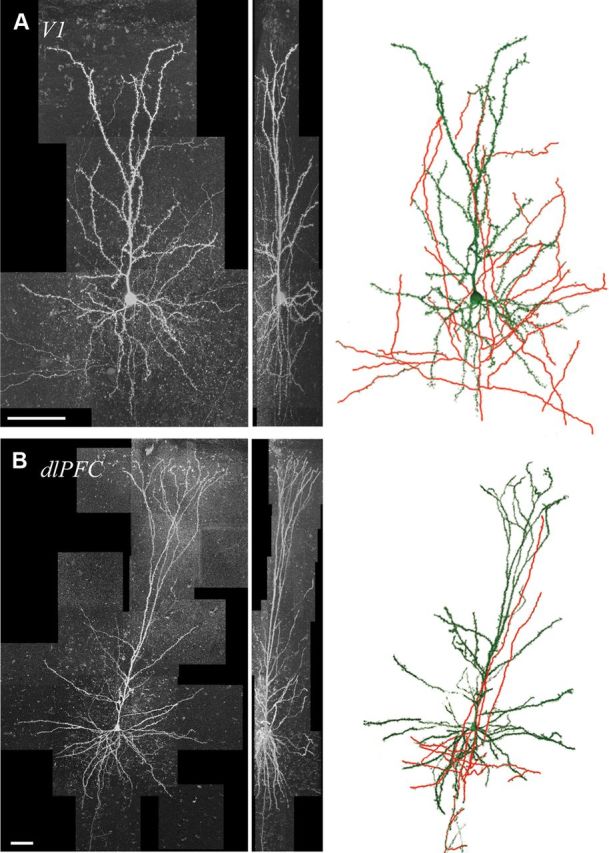
Imaging and reconstruction of V1 and dlPFC pyramidal neurons. A, B, The xy- and yz-projections of tiled 40× confocal microscopy image stacks of typical V1 (A) and dlPFC (B) neurons. At right, NeuronStudio reconstructions of the same neurons. Dendrites are shown in green; axons in red. Scale bars: A, B, 50 μm.
Morphometric analyses of dendrites and somata.
Mean pyramidal neuron soma diameters were assessed from 40× IR-DIC images of V1 and dlPFC slices using Reconstruct software (available at http://www.bu.edu/neural/Reconstruct.html) (Fiala, 2005). For automatic 3D reconstruction of neurons, datasets generated by VIAS were imported into AutoNeuron software (MBF Bioscience). Neuron reconstruction data were imported into NeuroExplorer software (MBF Bioscience) for assessment of dendritic length and complexity (number of intersections and bifurcation nodes) of both apical and basal arbors. These reconstructions are available at NeuroMorpho.Org (http://neuromorpho.org/neuroMorpho). For Sholl analyses of apical and basal dendritic arbors, 20 μm concentric rings originating from the soma were used (Sholl, 1953). For dendritic diameter assessments, integrated single volumetric datasets were imported into the 64-bit version of NeuronStudio (available at http://www.mssm.edu/cnic) (Wearne et al., 2005; Rodriguez et al., 2006). Using a Rayburst-based algorithm analysis method, NeuronStudio automatically traced dendritic segments thereby generating a .swc file (Fig. 2A,B, right panels). Dendritic diameter data were extracted from .swc files using L-Measure software (Scorcioni et al., 2008). Volumes of the 3D convex hulls (CHs) spanned by the apical and basal arbors and the mean arbor density of each neuron were computed using the TREES toolbox (available at http://www.treestoolbox.org) (Cuntz et al., 2010) from within MATLAB (The MathWorks).
Dendritic spine analyses.
For spine counts and densities, integrated volumetric datasets were first imported into NeuronStudio. Next, NeuronStudio was used to detect spines automatically on previously generated dendritic .swc files (Rodriguez et al., 2008). Finally, an operator using the NeuronStudio interface manually corrected both dendritic reconstructions and spine detections. Spine count and dendritic length data were extracted from NeuronStudio as .txt and .swc files, respectively. Spine densities were calculated as the number of spines along a given length of dendrite (number of spines/μm). Spine subtype analyses were conducted on one complete distal apical branch, a dendritic segment sampled from the mid-apical trunk, and one complete basal dendritic branch per cell. Spines were classified as stubby, mushroom, thin, or filopodia subtypes based on spine neck and head morphometrics (Jones and Powell, 1969; Peters and Kaiserman-Abramof, 1970; Harris et al., 1992). Spines without a neck were classified as “stubby.” Spines with necks were classified as “mushroom” if the head diameter was > 0.6 μm, and as “thin” or “filopodia” if the head diameter was ≤0.6 μm. Filopodia were distinguished from thin spines by having a neck length of >3 μm (see Fig. 5B1).
Figure 5.

V1 neurons have fewer dendritic spines and a lower proportion of thin spines than dlPFC neurons. A1, 100× confocal image stacks of distal apical, mid-apical, and basal dendritic branches (black and white inverted). A2, Bar graph of mean dendritic spine density in apical and basal dendritic arbors of V1 versus dlPFC neurons. B1, Schematic diagram indicating dendritic spine subtype parameters. B2, 100× confocal images showing representative spine subtypes (t, thin; m, mushroom; s, stubby; and f, filopodia). B3, Pie charts showing relative proportions of each subtype in the entire population of spines for all V1 and dlPFC neurons. C, Line graphs showing the mean percentage composition of spine subtypes in distal apical (1), mid-apical (2), and basal (3) dendrites of V1 versus dlPFC neurons. Scale bars: A1, 5 μm; B2, 2 μm. *p < 0.05; **p < 0.01.
Neuron inclusion criteria.
For inclusion in electrophysiological analyses, neurons were required to have a resting membrane potential less than or equal to −55 mV, stable access resistance, an AP overshoot (>0 mV), and the ability to fire repetitive APs in response to prolonged depolarizing current steps. For inclusion in morphological analyses, neurons were required to have an intact soma, a completely filled dendritic arbor and no cut dendrites in the proximal third of the apical dendritic arbor.
Data used to constrain modeling.
The NEURON 7.1 simulation environment (Carnevale and Hines, 2006) was used for all computational modeling. The morphology of one representative neuron each from V1 and dlPFC was chosen (Fig. 3A), and their .swc files were imported into NEURON using its Import3D tool. Model dendrites were checked manually for connection and reconstruction errors, but were not altered otherwise. Physiological data from representative neurons from each brain region were chosen to tune the models. To fit passive membrane parameters, voltage traces from five 200 ms subthreshold somatic current injections in which the neuron's I–V relation was approximately linear were used, with magnitudes ranging from −100 to 0 pA in steps of 20 pA. To fit Hodgkin–Huxley conductances and kinetics, voltage traces from 2 s suprathreshold somatic current injections were used, varying in magnitude from +30 to +380 pA in steps of 50 pA.
Figure 3.

V1 pyramidal neuron dendritic arbors are smaller than those of dlPFC pyramidal neurons but have a similar arbor density. A, Reconstructions of neurons used for morphological analyses. Arrowheads indicate the cells used for computational modeling. B, CHs of the apical and basal arbors of a V1 neuron (marked with an arrowhead in A), in red and gray, respectively. C, Bar graphs of mean CH volumes (top) and mean arbor densities (bottom) of apical and basal arbors of V1 and dlPFC neurons. D, Scatter plot of log10-transformed CH volumes and arbor densities of neurons reconstructed in this study. Open and closed symbols denote V1 and dlPFC neurons, respectively. Each neuron is represented by a single symbol. Measurements of the apical (red), basal (black), and combined arbors (green) are shown separately. Scale bars: A, 100 μm; B, 50 μm. **p < 0.01.
Importing morphology into NEURON.
The dlPFC soma was represented as a single cylindrical compartment with equal length and diameter, and surface area equaling that of a typical reconstructed dlPFC neuron (surface area, 878 μm2). The V1 soma dimensions were scaled to two-thirds the dlPFC soma size, consistent with the empirical measures of soma size reported below. A synthetic axon was added (Mainen et al., 1995), including an axon hillock, initial segment, and five sections each of myelin sheath and nodes of Ranvier.
The NeuronStudio analysis detected 5891 apical and 4014 basal spines on the dlPFC neuron, and 1153 apical and 874 basal spines on the V1 neuron. The total surface area of dendritic spines of each neuron was estimated by multiplying the number of spines by the average surface area measured in a previous study (apical, 1.31 μm2; basal, 1.71 μm2) (Hao et al., 2006). This added surface area was then distributed uniformly through the dendrites, using a standard algorithm (Stratford et al., 1989) that adds surface area to each compartment by scaling the length and diameter of each compartment while keeping the passive axial resistance constant. No spines were added to the soma or axon. The size of each compartment was chosen to be less than one-tenth of the electrotonic length constant at 100 Hz (972 compartments for dlPFC; 315 compartments for V1).
Mathematical model.
The models presented here are available for public download on ModelDB (http://senselab.med.yale.edu/ModelDB) (Hines et al., 2004). The multicompartment model included passive leak conductance plus Hodgkin–Huxley fast sodium (Na+) and delayed-rectifier potassium (K+) currents, described mathematically as in previous studies (Mainen and Sejnowski, 1996; Vetter et al., 2001). The Na+ channel kinetics were shifted by −0.5 mV relative to the previous studies; otherwise, channel kinetics were unchanged. These channels were inserted into the soma and dendrites at uniform densities, as given in Table 1. Specific capacitance (Cm) was 1 μF/cm2, and axial resistivity (Ra) was 150 Ω · cm. Specific membrane resistance (Rm) was uniform in the soma and dendrites at the values given in Table 1. Parameters in the axon were identical to parameters in the rest of the model, except Cm = 0.04 μF/cm2 in the myelin sheath, Rm = 50 kΩ · cm2 in the nodes of Ranvier, and ḡNa and ḡK were scaled relative to their soma values by factors of 1000 and 16.67, respectively, in the axon hillock, initial segment, and nodes of Ranvier sections (Mainen et al., 1995; Mainen and Sejnowski, 1996; Vetter et al., 2001). A time step of 0.05 ms was used; reducing the time step further had a negligible effect on the results.
Table 1.
Model parameters
| Tuned to dlPFC data | Tuned to V1 data | |
|---|---|---|
| Cm (μF/cm2) | 1 | 1 |
| Ra (Ω · cm) | 150 | 150 |
| Rm (Ω · cm2) | 26,316 | 20,833 |
| EL (mV) | −69 | −72 |
| ḡNa(mS/cm2) | 105 | 25 |
| ḡK (mS/cm2) | 115 | 65 |
| ḡAMPA (nS) | 0.54 | 0.17 |
| AMPA rise time (ms) | 0.15 | 0.15 |
| AMPA decay time (ms) | 4.0 | 4.0 |
| ḡGABA(nS) | 1.15 | 0.67 |
| GABA rise time (ms) | 2.5 | 2.5 |
| GABA decay time (ms) | 7.5 | 7.5 |
As dlPFC pyramidal neurons have been the central focus of our studies over the last few years (Luebke et al., 2010a,b; Yadav et al., 2012), the dlPFC model was constructed and tuned before the V1 model was. The passive input resistance and resting potential of the model neurons were calculated by a linear fit of the steady-state I–V relation in response to 200 ms current steps from −100 to 0 pA (see Fig. 6A). Passive parameters Rm and leak conductance reversal potential (EL) of the dlPFC model were tuned manually until the input resistance and resting potential of the model matched the dlPFC empirical data. Similarly, Rm and EL were selected so that the input resistance and resting potential of the “tuned V1 model” matched those of the V1 empirical data (Table 1).
Figure 6.
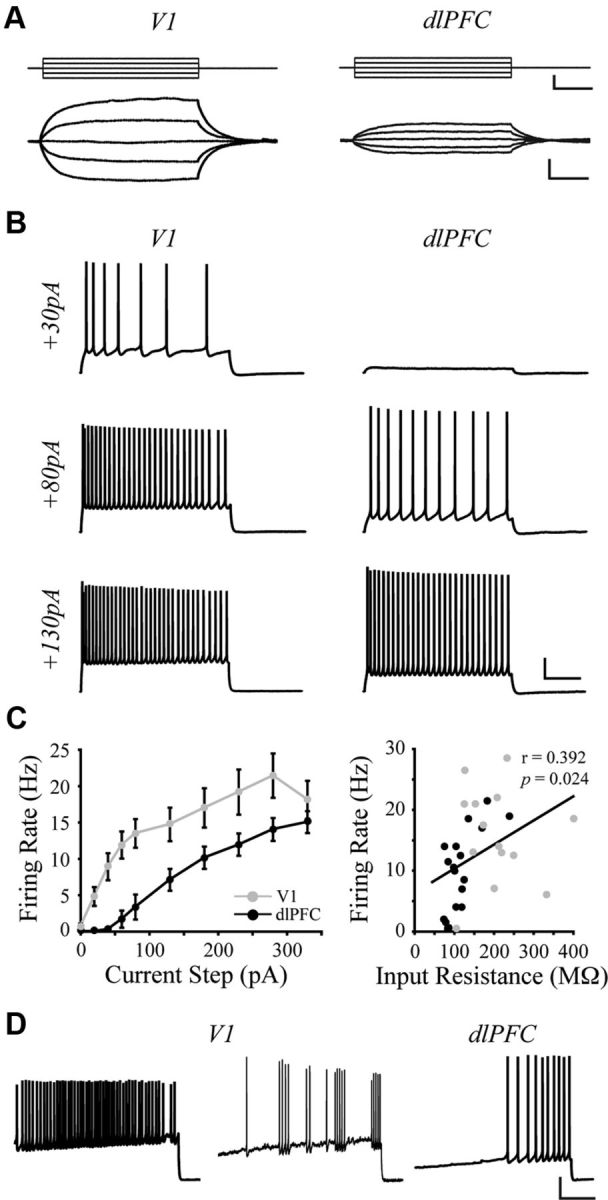
V1 neurons have higher input resistance and action potential firing rates than dlPFC neurons. A, Voltage responses (bottom) of representative V1 and dlPFC neurons to 200 ms current pulses (top, −40 to +40 pA). B, Voltage responses of representative neurons to 2 s current steps of +30, +80, and +130 pA. C, Left, Mean firing rates of V1 versus dlPFC neurons in response to a series of depolarizing current steps. V1 was significantly different from dlPFC at steps +20 to +280 pA (p < 0.05; asterisks omitted for the sake of clarity). Right, Relationship between input resistance and firing rate in response to a +130 pA current step for all V1 and dlPFC neurons. Linear regression (black line) demonstrates a significant positive correlation. D, Firing patterns observed in response to a current ramp protocol. All V1 neurons were capable of firing in a tonic pattern (left trace); most also were capable of firing in a phasic pattern (middle, different neuron from that shown at left). All dlPFC neurons fired tonically (right). Calibration: A, top, 60 pA/50 ms; A, bottom, 5 mV/50 ms; B, 20 mV/500 ms; D, 20 mV/1 s.
Values of the maximal conductance parameters (ḡNa, ḡK) of the dlPFC model were determined using a systematic sampling of the parameter space. A total of 1521 models were tested by varying (ḡNa, ḡK) pairs by 39 equally spaced conductance values in each direction, from 10 to 200 mS/cm2 (in increments of 5 mS/cm2). The mean AP firing rates (FRs) recorded empirically in response to 2 s current injections of +180, +230, and +380 pA were measured over the last 1.5 s of injected current, after FR adaptation had stabilized. A linear regression of FR versus injected current (I) of the empirical data gave a fit of FR = 60.08 · I − 5.89 (r = 0.99). Each model defined by a (ḡNa, ḡK) pair was simulated, and the mean FR over each current step was recorded. A linear fit of firing rate versus injected current was calculated for each model, and models with a fitted FR gain (slope) within 10% and baseline FR (intercept) within 50% of these empirical values were chosen for further study (16 out of 1521, 1.1% of those tested). The dlPFC model shown here (Table 1) was deemed the best overall fit to the empirical data, with a linear fit of FR = 66.09 · I − 3.55 (r = 0.98; 10% and −40% error relative to the empirical data, for the slope and intercept, respectively). The model that applied the parameters from the dlPFC model to the V1 morphologic data is called the “baseline V1 model” below.
The V1 model was tuned to V1 empirical data, using +130, +180, and +230 pA somatic current injections. For direct comparison, we tested the same 1521 (ḡNa, ḡK) pairs as in the dlPFC model. Of these models, 81 of them (5.3%) had a fitted FR gain within 10% and a baseline FR within 50% of the empirical values. The linear fit of FR versus injected current of the empirical data was FR = 124.40 · I − 5.38 (r = 0.99); the firing rate of the best-fitting V1 model (Table 1) was described by FR = 131.86 · I − 4.74 (r = 0.98; errors of 6% and −12%, respectively, for the slope and intercept). This model is called the “tuned V1 model” below.
Electrotonic analyses.
NEURON′s Electrotonic Workbench was used to calculate the log attenuation of voltage for transfer of signals propagating outward from the soma to the dendrites (Lout), and propagating inward from the dendrites toward the soma (Lin). These measures, described elsewhere (Brown et al., 1992; Tsai et al., 1994; Carnevale et al., 1997), are a frequency-dependent generalization of the classical electrotonic distance measure (Rall, 1969). The mean outward and inward attenuations, averaged over all paths throughout the dendritic arbor and represented by L̄out and L̄in, respectively, were calculated as described by Kabaso et al. (2009). Fourier analysis can be used to decompose any signal into a sum of sinusoids at varying frequencies (Gabbiani and Cox, 2010). Since action potentials include components at frequencies ranging from 0 Hz to as high as 500 Hz (Kabaso et al., 2009), L̄out and L̄in were calculated over the same range here. Electrotonic analyses of both neurons were performed with the passive membrane parameters tuned to the dlPFC neuron (i.e., the dlPFC and baseline V1 model), without including Hodgkin–Huxley channels. Electrotonic analyses were repeated using the tuned V1 model and including Hodgkin–Huxley channels, with only minimal effects on the results (data not shown).
Simulating postsynaptic currents.
The model assumed that excitatory synaptic currents were due to AMPA receptor-gated channels and that inhibitory synapses were due to GABAA receptor-gated channels. PSCs were modeled as a sum of two exponentials using NEURON′s Exp2Syn, NetCon, and NetStim mechanisms (Carnevale and Hines, 2006), with reversal potentials of 0 and −81 mV, respectively, for excitatory and inhibitory currents (Traub et al., 2005). A representative number of excitatory synapses, totaling 1–1.5% of the number of spines detected with NeuronStudio, were inserted uniformly across the dendritic arbors (dlPFC neuron: 59 apical and 40 basal synapses; V1 neuron: 14 apical and 13 basal). Increasing the density of synapses by a factor of 10 had no noticeable effect on the mean shape measurements and cumulative amplitude distributions of either EPSCs or IPSCs.
A recent study of layer 3 pyramidal neurons of the visual cortex reported that the density of inhibitory GABAergic synapses, including spine synapses, was slightly lower in the soma and proximal dendrites (<125 μm) than in distal dendrites (Chen et al., 2012). Since spines were not modeled explicitly here, inhibitory synapses were placed uniformly on the soma/proximal and distal regions. Equal densities were assumed for V1 and dlPFC neurons, at ∼2% of those reported by Chen et al. (2012), resulting in 33 proximal and 58 distal synapses for the dlPFC model, and 18 proximal and 6 distal synapses for the V1 model.
While clamping the soma voltage (−70 mV for simulating excitatory inputs; −50 mV for inhibitory inputs), each synapse was activated once and the somatic current was recorded. Synaptic summation was not studied here; to prevent summation, synapse activations occurred at 200 ms intervals. Parameters for the maximal conductance and rise and decay time constants of the receptor-gated channels (Table 1) were determined by fitting the statistics of the mean simulated somatic PSCs to those recorded empirically.
Statistical analyses.
A two-tailed Student's t test was used for between-group comparisons. Relationships between variables were determined using a Pearson product-moment correlation. Cumulative histograms were compared using a Kolmogorov–Smirnov test. Simulated PSC amplitudes varying with distance from the soma were analyzed with semi-linear multiple regression. Significance was defined as p ≤ 0.05 for all statistical tests. All data are reported as the mean ± SEM.
Results
Qualitative cytoarchitectural features of V1 versus dlPFC
All cells included in electrophysiological and morphological analyses were located in layer 3. The vertical laminar boundaries are very different in V1 compared with dlPFC; in the rhesus monkey, layer 2/3 is ∼400 μm thick in V1 (O'Kusky and Colonnier, 1982), and ∼700 μm thick in dlPFC (Dombrowski et al., 2001). This difference, which has obvious implications for the vertical extent of layer 3 pyramidal neurons in the two areas, is apparent in the Nissl-stained sections in Figure 1B. Therefore, the mean soma-to-pia distance for layer 3 pyramidal neurons was significantly less in V1 compared with dlPFC (268.1 ± 17.5 vs 567.1 ± 41.2 μm; p < 0.001). Figure 1C demonstrates qualitatively the notably smaller neuronal soma size and greater cell packing density of neurons in V1 compared with dlPFC. Indeed, the mean soma diameter of V1 pyramidal neurons was significantly smaller than dlPFC neurons (18.1 ± 0.7 vs 25.1 ± 0.4 μm; p < 0.001). Figure 2 shows 2D projections of confocal image stacks (left) and NeuronStudio reconstructions (right) of representative V1 and dlPFC pyramidal neurons. The difference in the size of these neurons is striking: only 4 stacks were required to capture the V1 neuron compared with 21 stacks for the dlPFC neuron.
Dendritic arbors are smaller and less complex in V1 than in dlPFC neurons
Detailed morphological analyses were performed on the entire dendritic arbors of five V1 and five dlPFC well filled pyramidal neurons (Fig. 3A). The mean total dendritic length of V1 neurons was approximately one-third that of dlPFC neurons (p < 0.001; Table 2), as were the total lengths of apical and basal dendritic arbors (p < 0.001 for both; Table 2). The total 3D volume spanned by each of the arbors was quantified by the volume of its convex hull (CH) (Fig. 3B); the mean arbor density was quantified by dividing the total length of each arbor by its CH volume (Teeter and Stevens, 2011). The mean spanning volume of V1 neurons was less than that of dlPFC neurons for both the apical and basal arbors (p < 0.001 for both; Fig. 3C). Yet interestingly, the mean arbor density of V1 versus dlPFC neurons did not differ, in either apical or basal arbors (p = 0.21 and p = 0.60, respectively; Fig. 3C). Teeter and Stevens (2011) identified a power law relationship between the branch density and CH volume, visualized as a strong linear relationship on a log–log plot, of hundreds of neurons from several animals and brain areas. No such linear trend was evident in our data (r = 0.08, df = 17, p = 0.76; Fig. 3D), even when the outlier at the bottom left of the plot was omitted (r = −0.23, df = 16, p = 0.35).
Table 2.
Dendritic properties
| V1 | dlPFC | p valuea | |
|---|---|---|---|
| Total | |||
| Dendritic length (μm) | 3194 ± 86 | 10,583 ± 1074 | <0.001 |
| Vertical extent (μm) | 371 ± 13 | 769 ± 35 | <0.001 |
| Apical | |||
| Dendritic length (μm) | 1718 ± 120 | 6454 ± 700 | <0.001 |
| Vertical extent (μm) | 268 ± 18 | 567 ± 41 | <0.001 |
| Horizontal extent (μm) | 139 ± 15 | 425 ± 76 | 0.003 |
| Basal | |||
| Dendritic length (μm) | 1476 ± 80 | 4129 ± 401 | <0.001 |
| Vertical extent (μm) | 147 ± 11 | 335 ± 34 | <0.001 |
| Horizontal extent (μm) | 194 ± 15 | 377 ± 39 | <0.001 |
| Apical nodes | |||
| Proximal | 8.2 ± 1.4 | 20.2 ± 1.9 | <0.001 |
| Middle | 2.8 ± 0.7 | 8.6 ± 1.8 | 0.009 |
| Distal | 3.6 ± 0.8 | 7.2 ± 2.0 | 0.094 |
| Basal nodes | |||
| Proximal | 6.4 ± 0.8 | 8.3 ± 4.1 | 0.58 |
| Middle | 6.8 ± 1.2 | 9.5 ± 2.0 | 0.21 |
| Distal | 1.5 ± 0.6 | 4.8 ± 1.4 | 0.044 |
aItalics signifies significant difference.
Sholl analyses revealed that V1 neurons had less complex dendritic branching patterns, with significantly fewer dendritic intersections in both apical and basal dendritic arbors (p < 0.02; Fig. 4A,B). Further, the horizontal and vertical extents of both the apical and basal arbors were significantly shorter in the V1 group (p < 0.01; Table 2). To normalize for differences in the total vertical and horizontal extents of dendritic arbors between V1 and dlPFC neurons, a second Sholl analysis was conducted in which apical and basal arbors were subdivided into proximal, middle, and distal thirds. V1 neurons had fewer intersections in both apical and basal arbors in the proximal, middle, and distal divisions (p < 0.05; Fig. 4A,B). As a further assessment of dendritic complexity, the number of branch points (bifurcation nodes) was assessed. Apical arbors of V1 neurons had significantly fewer nodes in proximal and middle divisions (p < 0.001 proximal; p = 0.009 middle), but no difference in the number of nodes in the distal division (p = 0.094; Table 2) compared with dlPFC neurons. Basal arbors of V1 neurons had significantly fewer nodes in the distal division (p = 0.044), but not in the proximal and middle divisions (Table 2). Finally, while the mean diameter of distal and mid-apical segments was not different (p = 0.24; p = 0.053 respectively), basal dendrites were significantly thinner in V1 than dlPFC neurons (p < 0.001; Fig. 4C).
Figure 4.

V1 pyramidal neuron dendritic arbors are smaller and less complex than those of dlPFC pyramidal neurons. A, Sholl analysis of the apical tree, comparing the number of dendritic intersections in 20 μm increments (left), and in the proximal, middle, and distal thirds (right). B, Sholl analysis of the basal tree, comparing the number of dendritic intersections in 20 μm increments (left), and in the proximal, middle, and distal thirds (right). C, Bar graphs of mean diameters of distal apical, mid-apical, and basal dendrites of V1 and dlPFC neurons. *p < 0.05; **p < 0.01.
V1 neurons have fewer dendritic spines and a different proportion of spine subtypes than dlPFC neurons
Total dendritic spine number and density were quantified along the entire extent of apical and basal dendritic arbors of V1 and dlPFC neurons. Representative examples of dendritic segments are shown in Figure 5A1. V1 neurons had a significantly lower number of spines compared with dlPFC neurons along both apical (901 ± 160 vs 8213 ± 952 spines; p < 0.001) and basal dendritic arbors (609 ± 131 vs 5703 ± 1097 spines; p < 0.001). Spine density was also lower in V1 versus dlPFC in both apical (p = 0.0019) and basal dendritic arbors (p < 0.001; Fig. 5A2).
Spines were classified as thin, mushroom, stubby, or filopodia according to their head and neck morphology (Fig. 5B1,B2). V1 neurons had a significantly lower proportion of thin spines (52.8 ± 3.1 vs 64.9 ± 2.4%; p = 0.0034) and a higher proportion of stubby spines than did dlPFC neurons (18.8 ± 2.3 vs 11.1 ± 1.3%; p = 0.0049; Fig. 5B3). However, neurons from the two brain areas had the same relative proportion of mushroom spines (26.7 ± 2.6 vs 21.9 ± 1.5%; p = 0.11) and filopodia (1.7 ± 0.8 vs 2.1 ± 0.5%; p = 0.65; Fig. 5B3). We next assessed whether there was a difference in spine subtype distribution across different dendritic regions of V1 and dlPFC neurons. The relative proportion of spine subtypes along distal apical dendritic branches did not differ between the two groups, but there was a significantly higher proportion of stubby spines on mid-apical (p = 0.025) and basal (p = 0.045) dendritic segments, and a lower proportion of thin spines on the basal (p = 0.049) but not mid-apical (p = 0.086) dendritic segments of V1 versus dlPFC neurons. Mushroom spines and filopodia were present in the same relative proportions within each dendritic region between groups (Fig. 5C).
V1 neurons are more excitable than dlPFC neurons
Detailed electrophysiological analyses were performed on 18 V1 and 25 dlPFC pyramidal neurons. To assess passive membrane properties, a series of current steps was used to elicit linear voltage responses (Fig. 6A). Compared with dlPFC neurons, V1 neurons had a significantly depolarized mean resting membrane potential (p = 0.017) and a significantly higher mean input resistance (p < 0.001), but there was no difference in membrane time constant between the two groups (Table 3). Single APs of V1 neurons were significantly lower in amplitude and shorter in duration compared with those of dlPFC neurons (p < 0.001; p = 0.048 respectively; Table 3). Further, compared with dlPFC neurons APs in V1 neurons had shorter fall times (p = 0.020), but not rise times (Table 3). AP threshold did not differ between the two groups (p = 0.12), but the mean rheobase (amount of current required to elicit an AP) was significantly lower in V1 versus dlPFC neurons (p = 0.029; Table 3).
Table 3.
Electrophysiological properties
| V1 | dlPFC | p valuea | |
|---|---|---|---|
| Passive | |||
| Resting potential (mV) | −66.3 ± 0.9 | −69.2 ± 0.8 | 0.017 |
| Input resistance (MΩ) | 204.9 ± 33.3 | 102.4 ± 9.0 | <0.001 |
| Membrane time constant (ms) | 19.1 ± 3.6 | 18.1 ± 1.1 | 0.27 |
| Action potential | |||
| Threshold (mV) | −41.9 ± 0.9 | −39.8 ± 0.9 | 0.12 |
| Rheobase (pA) | 79.4 ± 14.4 | 130 ± 16 | 0.029 |
| Amplitude (mV) | 70.3 ± 2.1 | 82.5 ± 1.7 | <0.001 |
| Rise time (ms) | 0.88 ± 0.04 | 0.82 ± 0.02 | 0.13 |
| Duration (ms) | 1.38 ± 0.06 | 1.53 ± 0.05 | 0.048 |
| Fall time (ms) | 2.04 ± 0.07 | 2.35 ± 0.10 | 0.020 |
aItalics signifies significant difference.
Mean AP firing rates in response to increasing depolarizing current steps were significantly higher at each step in V1 versus dlPFC neurons, and the maximal rate attainable was also higher in V1 neurons (p < 0.05; Fig. 6B,C, left). There was a significant, positive relationship between input resistance and firing rates across all neurons in both groups (+130 pA step; r = 0.4; df = 30; p = 0.024; Fig. 6C, right). All dlPFC neurons (25/25) fired in a tonic, regular-spiking repetitive AP firing pattern as shown in Figure 6, B and D. By contrast, while all V1 neurons also fired in a tonic, regular-spiking pattern, the majority of these neurons (15/18) additionally exhibited sporadic phasic firing at some point during the family of current steps or during the ramp depolarizing protocol. There was no clear dependence of the occurrence of phasic firing on the magnitude of the current step. This phasic pattern, which is somewhat reminiscent of the chattering pattern of some V1 cells seen in vivo (Nowak et al., 2003), is exhibited by the representative cell in Figure 6D (middle) during application of a current ramp protocol.
Spontaneous EPSCs are faster and lower in amplitude in V1 than in dlPFC neurons
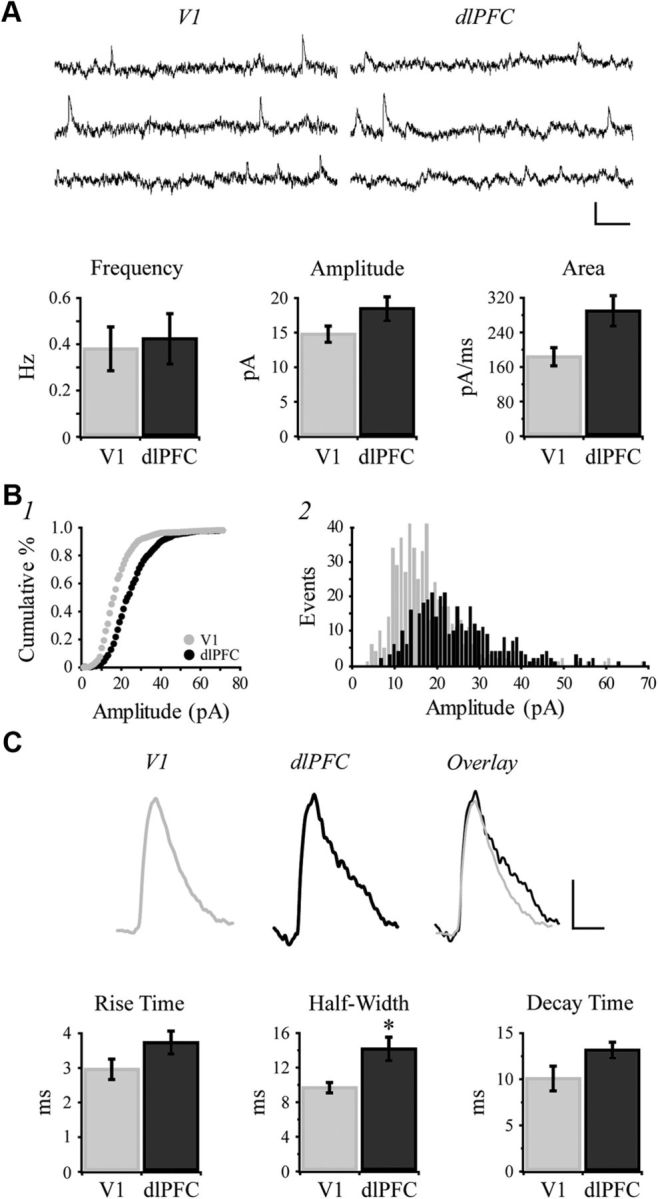
Representative traces of sEPSCs are shown in the top of Figure 7A. While the mean frequency of sEPSCs did not differ, the mean amplitude of sEPSCs was significantly lower in V1 versus dlPFC neurons (p = 0.0037; Fig. 7A). The mean area of sEPSCs was significantly smaller in V1 compared with dlPFC neurons (p = 0.013; Fig. 7A). Amplitudes of sEPSCs were plotted as a cumulative distribution histogram, which revealed a significantly higher proportion of low-amplitude sEPSCs in V1 neurons (Kolmogorov–Smirnov test, p < 0.001; Fig. 7B1). Frequency distribution histograms of sEPSC amplitudes also demonstrated an increased number of smaller amplitude events in V1 versus dlPFC neurons (Fig. 7B2). Averaged waveforms show the overall smaller amplitude and faster kinetics of sEPSCs in V1 neurons (Fig. 7C, top). While the differences in rise and decay time constants were not statistically significant (p = 0.086 and p = 0.086, respectively; Fig. 7C), the half-width (duration) of sEPSCs was significantly lower in V1 compared with dlPFC neurons (p = 0.0095). Collectively, these results suggest that sEPSCs are faster in V1 versus dlPFC neurons.
Figure 7.
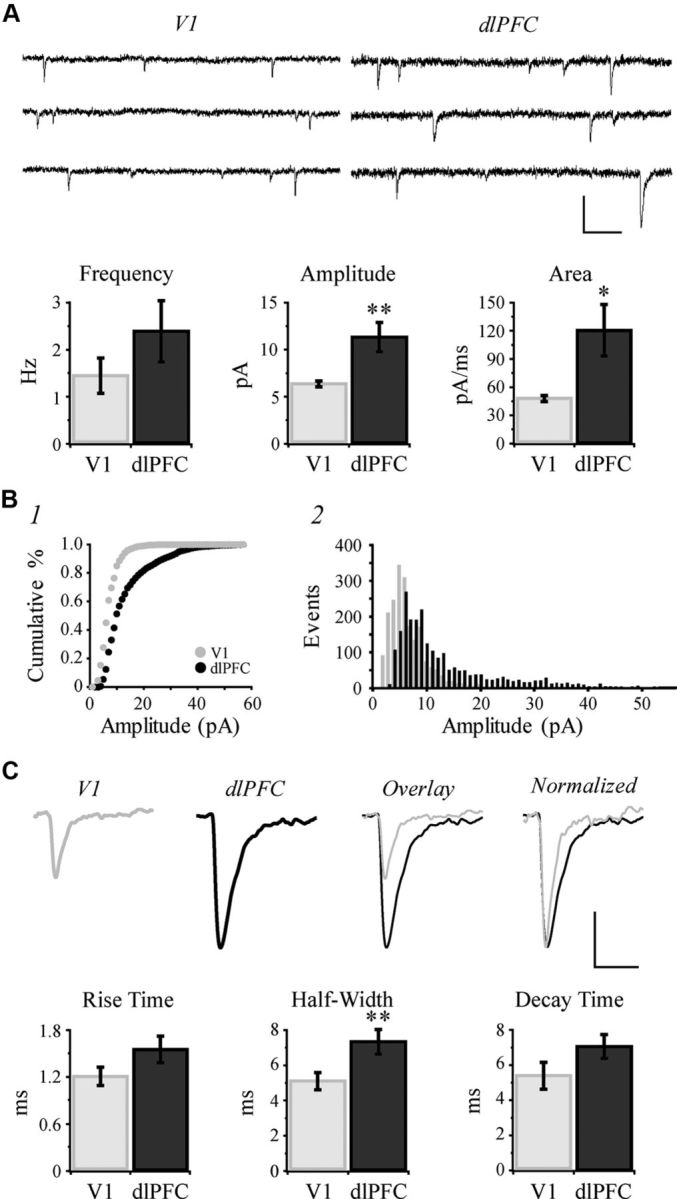
Spontaneous EPSCs are faster and lower in amplitude in V1 than in dlPFC neurons. A, Top, Representative traces of sEPSCs recorded from V1 and dlPFC neurons held at −80 mV. Bottom, Bar graphs comparing mean frequency, amplitude and area of sEPSCs in V1 versus dlPFC neurons. B1, Cumulative frequency histograms of sEPSC amplitudes in V1 versus dlPFC neurons (1 pA bins). B2, Amplitude frequency histogram, showing the number of events at each amplitude for V1 versus dlPFC neurons (1 pA bins). C, Top, Averaged waveforms from exemplar neurons. The waveform obtained from the V1 neuron was first overlaid onto the dlPFC waveform then normalized to the peak of the dlPFC waveform. Bottom, Bar graphs comparing mean kinetics of sEPSCs in V1 versus dlPFC neurons. Calibration: A, 20 pA/100 ms; C, 5 pA/20 ms. *p < 0.05; **p < 0.01.
Spontaneous IPSCs are faster, and there is a higher proportion of low-amplitude events in V1 than in dlPFC neurons
Representative traces of sIPSCs are shown in Figure 8A, top. There was no difference in mean frequency, amplitude, or area of sIPSCs between the two groups (p = 0.75, p = 0.31 and p = 0.073, respectively; Fig. 8A). The cumulative distribution histogram of amplitudes of sIPSCs revealed that there is a higher proportion of low-amplitude sIPSCs in V1 versus dlPFC neurons (Kolmogorov–Smirnov test, p < 0.001; Fig. 8B1). The sIPSC amplitudes were plotted as a frequency distribution histogram showing a higher proportion of low-amplitude events in V1 compared with dlPFC neurons (Fig. 8B2). Average sIPSC waveforms were generated for both neuron groups (Fig. 8C, top). The sIPSCs of V1 neurons had a significantly shorter half-width (p = 0.027), but did not differ in rise time or decay time compared with those of dlPFC neurons (p = 0.16 and p = 0.066, respectively; Fig. 8C).
Figure 8.
Spontaneous IPSCs are lower in amplitude in V1 than in dlPFC neurons. A, Top, Representative traces of sIPSCs recorded from V1 and dlPFC neurons held at −40 mV. Bottom, Bar graphs comparing mean frequency, amplitude and area of sIPSCs in V1 versus dlPFC neurons. B1, Cumulative frequency histograms of sIPSC amplitudes in V1 versus dlPFC neurons (1 pA bins). B2, Amplitude frequency histogram, showing the number of events at each amplitude for V1 versus dlPFC neurons (1 pA bins). C, Top, Averaged waveforms from exemplar neurons. The waveform obtained from the V1 neuron was overlaid onto the dlPFC waveform. Bottom, Bar graphs comparing mean kinetics of sIPSCs in V1 versus dlPFC neurons. Calibration: A, 25 pA/100 ms; C, 5 pA/10 ms. *p < 0.05.
Modeling predicts lower dendritic voltage attenuation in V1 than in dlPFC neurons
It stands to reason that the smaller size of V1 pyramidal neurons could account largely, if not entirely, for the increased excitability of V1 neurons compared with dlPFC neurons. For example, it is expected that electrical signals would attenuate less in V1 dendrites than they would in dlPFC dendrites. Computational modeling is an effective means for evaluating the extent to which such claims are true. First, electrotonic analysis was performed on a representative neuron from each brain region to examine the effect of morphology on passive voltage spread in these two kinds of neurons. Figure 9, A and B, compares the morphologic reconstructions of the V1 and dlPFC neurons to their morphoelectrotonic transforms of outward and inward electrical signals (Lout and Lin at DC, 0 Hz). These transforms predict that the morphologic differences between V1 and dlPFC neurons have a profound effect on the attenuation of signals throughout the dendrites, both propagating away from the soma (outward) and propagating in toward it (inward).
Figure 9.
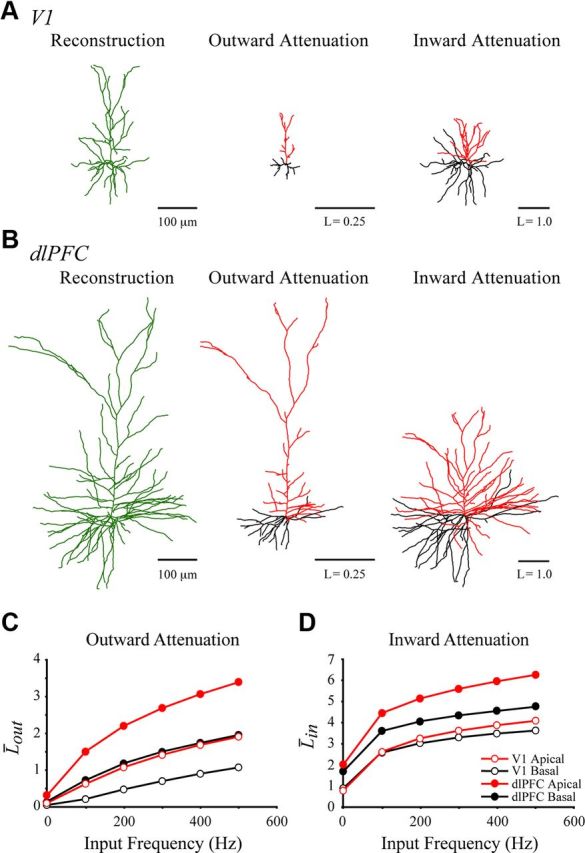
Electrotonic analyses of representative V1 and dlPFC neurons. A, B, Morphologic reconstructions, and outward and inward morphoelectrotonic transforms of the V1 (A) and dlPFC (B) neurons. Scale bars represent one-fourth an attenuation unit in the outward transforms, and one attenuation unit in the inward transforms. C, D, Effect of increasing frequency (0–500 Hz) on L̄out (C) and L̄in (D) of the V1 (open circles) and dlPFC (closed circles) neurons. Apical and basal arbors were analyzed separately, shown as red and black lines, respectively.
Figure 9, C and D, shows the mean attenuation lengths L̄out and L̄in of the apical and basal arbors of the two neurons, for input frequencies ranging from 0 to 500 Hz. These graphs illustrate that, in the absence of active dendritic conductances, rapid voltage deflections (e.g., the rising phase of an action potential) would attenuate more as they propagate through the dendrites than would slower events (e.g., a slow afterhyperpolarization). Moreover, the figures demonstrate that the mean attenuation lengths of the V1 neuron are one-half to one-third the size of those of the dlPFC neuron, for both the apical and basal arbors. If passive membrane parameters were equal in V1 and dlPFC neurons, these findings imply that a signal of equal size would attenuate much less due to passive voltage decay in the V1 neuron than in the dlPFC neuron.
Input resistance is higher in the model V1 neuron than in the model dlPFC neuron
Also due to its smaller size, the model V1 neuron would be expected to have a higher input resistance than the dlPFC model would. To test this hypothesis, the values of Rm and EL were chosen to fit the subthreshold responses of the dlPFC morphologic compartment model to the dlPFC physiological data. With these parameters, the input resistance of the dlPFC model was 69.1 MΩ (Fig. 10A, solid red line), close to the 72.5 MΩ value for the empirical dlPFC neuron (Fig. 10A, dashed black line). The resting potential of the model neuron was −69.8 mV, compared with −69.6 mV for the empirical neuron. Using the V1 morphology and holding passive membrane parameters constant at the dlPFC model values, the input resistance and resting membrane potential of the V1 model neuron were 189.5 MΩ and −69.2 mV (Fig. 10A, solid green line, baseline V1 model). This represents a 174% increase in input resistance over the dlPFC model values, but less than a 1% increase in resting membrane potential. As predicted, then, changing from dlPFC to V1 morphology alone does increase input resistance substantially. However, both input resistance and resting membrane potential of the baseline V1 model were higher than those observed empirically (161.9 MΩ and −72.8 mV, respectively; Fig. 10A, dashed gray line). These results suggest that morphology alone cannot account fully for the difference in input resistance and resting potential between V1 and dlPFC neurons. Next, the passive membrane parameters of the V1 model were tuned to fit the empirical subthreshold responses of the V1 neuron. Resimulating the V1 model, after decreasing Rm by 20% and EL by 4%, resulted in a good fit to the empirical V1 data (Table 1; Fig. 10A, solid blue line, tuned V1 model).
Figure 10.

Computational modeling of passive and active properties of V1 and dlPFC neurons. A, Steady-state membrane potential versus injected subthreshold current for empirical (dashed lines) and model neurons (solid lines). Shown are output of the dlPFC model (red), the baseline V1 model using the same membrane parameters as in the dlPFC model (green), and the tuned V1 model (blue), tuned directly to the V1 empirical data. Lines indicate best linear fit to the corresponding data. B, Steady-state firing rate versus injected current of the empirical data and models. C, Top, Voltage traces of the empirical dlPFC and V1 neurons in response to a +230 pA somatic current injection, in black and gray, respectively. Bottom, Voltage traces of the models in response to a +230 pA somatic current injection. Left, The dlPFC model (red trace); middle, the baseline V1 model (green trace); right, the tuned V1 model (blue trace). Arrowheads indicate the afterhyperpolarizations of the dlPFC data and model, which account for most of the difference between the model and empirical traces. Calibration: C, 20 mV/50 ms.
Firing rates are higher in the model V1 neuron than in the model dlPFC neuron
The higher input resistance of the tuned V1 model neuron predicts that its evoked firing rates would be greater than those of the model dlPFC neuron. To test this prediction, fast sodium (Na+) and delayed-rectifier potassium (K+) channels were added to the model cells. Maximal conductances (ḡNa, ḡK) were chosen using a systematic sampling of parameter space, so that the slope and intercept of the firing rate versus injected current (FI curves) of the model closely fit those of the dlPFC empirical data (Table 1). Figure 10B compares the dlPFC model and empirical firing rates for somatic current injections up to +380 pA (solid red and dashed black lines, respectively). The initial slope of the dlPFC model FI curve was steeper than that of the empirical data, but the slopes were very similar from the +280 pA current step on. This suggests that, even without mechanisms for spike frequency adaptation, the model captured the overall excitability of the recorded dlPFC neuron in the range relevant to the present study.
Holding passive and active membrane parameters constant, the baseline V1 model was much more excitable than the dlPFC model (Fig. 10B, solid green line). Relative to the dlPFC model, the FI curve of the baseline V1 model was shifted to the left by 150 pA and had a steeper slope. As predicted, this result was consistent with the increased input resistance of the V1 model (Fig. 10A, solid green line). Interestingly, as with the input resistance, the firing rates of the baseline V1 model were also higher than those of the empirical V1 neuron (Fig. 10B, dashed gray line). This further suggested that morphology alone does not fully account for the observed physiological differences between V1 and dlPFC neurons. To obtain a better fit to the V1 empirical data, the passive parameters Rm and EL were set to the values optimized to the V1 data above, and new values of ḡNa and ḡK were chosen using another systematic sampling. The output of the best-fitting model identified is shown in Figure 10B as a solid blue line (tuned V1 model). The parameters ḡNa and ḡK were reduced substantially, by 76% and 43%, respectively, fitting the V1 data much better than the baseline model (green line), though the fit deviated more from empirical data with increasing current steps.
The voltage traces of the empirical and model data are shown in Figure 10C. The APs were greater in amplitude for the baseline V1 model than for the dlPFC model (Fig. 10C, bottom, green and red lines, respectively). This was an expected finding, as the baseline V1 model had both higher input resistance and reduced dendritic attenuation predicted by the electrotonic analysis. Importantly, in the tuned V1 model (Fig. 10C, bottom, blue line) AP heights were 15% lower, even though AP height was not a criterion of the parameter fitting. Due to the relative simplicity of the model, afterhyperpolarizations did not match those recorded empirically (Fig. 10C, arrowhead). Yet, as observed experimentally, the AP heights of the tuned V1 model were less than those of the dlPFC model.
Modeling of EPSCs predicts lower synaptic channel conductance in V1 than in dlPFC neurons
To investigate the effect of morphology on synaptic input, excitatory synapses were added uniformly across the dendritic arbor of the two model neurons. Synapses were activated individually under somatic voltage-clamp, and the resulting somatic EPSCs were recorded. Parameters controlling the conductance and kinetics of AMPA receptor-gated channels were tuned manually to fit the mean EPSC of the dlPFC model to empirical data. Figure 11A1 superimposes the mean model EPSC and empirical data (thin red vs thick black lines, respectively). Holding channel parameters constant for excitatory synapses uniformly distributed across the tuned V1 model neuron (Fig. 11A2, dotted blue line), simulations produced a mean EPSC with greater amplitude than the dlPFC model (21.12 ± 0.90 vs 14.06 ± 0.65 pA; p < 0.001). This is the opposite of the empirical finding (Fig. 7A). A suitable fit to V1 data was found by reducing the conductance of the AMPA receptor-gated channel (ḡAMPA), as shown in Figure 11A2 and described below. First, the results when holding synaptic parameters constant are explored further.
Figure 11.
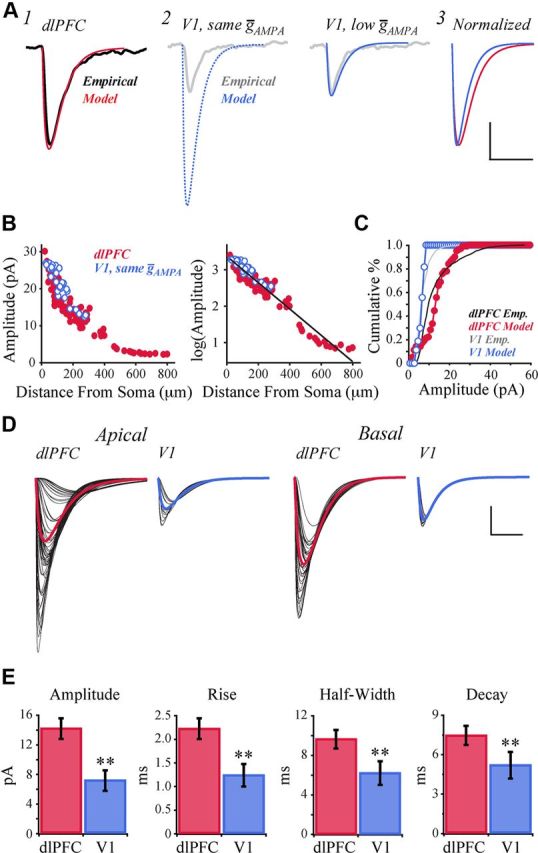
EPSC simulations predict reduced conductance of AMPA receptor-gated channels in V1 versus dlPFC. A1, Mean EPSC of the dlPFC model (red), overlaying the representative EPSC recorded empirically from dlPFC neurons (black, from Fig. 7C). A2, Mean EPSC of the V1 model, using the same ḡAMPA as the dlPFC model (left, blue dotted line), and when reducing ḡAMPA by 69% (right, blue solid line). Model traces overlay the representative EPSC recorded empirically from V1 neurons (gray, from Fig. 7C). A3, Normalized overlay of mean EPSC traces of the dlPFC and low ḡAMPA V1 models. B, Left, EPSC amplitude versus synaptic distance from the soma in the dlPFC model (red filled circles) and V1 model (blue open circles), assuming equal values of ḡAMPA. Right, Log-transformed EPSC amplitudes versus synaptic distance from the soma. The best-fit linear regression of log(amplitude) versus distance is shown in black. C, Cumulative frequency histograms of EPSC amplitudes in the dlPFC and low-ḡAMPA V1 models (1 pA bins; filled red circles and open blue circles, respectively). Cumulative frequency histograms of the dlPFC (black line) and V1 (gray line) empirical data are superimposed. D, EPSCs evoked by activation of each individual synapse on the apical and basal arbors, for the dlPFC and low-ḡAMPA V1 models. Individual EPSCs shown in black; mean EPSC traces shown in color. E, Bar graphs comparing kinetics of EPSCs in dlPFC versus low-ḡAMPA V1 model neurons. Calibration: A, 5 pA/20 ms; D, 5 pA/10 ms. **p < 0.01.
When holding synaptic parameters constant, peak EPSC amplitude decayed approximately exponentially with distance from the soma in both models (Fig. 11B, left). Semi-linear regression revealed that distance from the soma accounted for 94% of the variation of the natural logarithm of EPSC amplitude in the two models combined (log(A) = 3.35 − 0.04D; r = −0.97; F(1,124) = 1800; p < 0.001; Fig. 11B, right, solid line). Adding a categorical variable to incorporate remaining differences between the two models improved the regression a small but significant amount (log(A) = 3.39 − 0.04D − 0.16M; r = −0.97; F(2,123) = 1060; p < 0.001), but only increased the variance for which the regression accounts by <1%. Including an interaction between the distance and model variables did not improve the regression (F(3,122) = 0.20, p = 0.65). Thus, while all intrinsic properties and morphologic features contributed to filtering of synaptic inputs, these results demonstrated that the higher EPSC amplitude in the V1 model observed here was explained almost entirely by its shorter dendrites.
An effective way to generate EPSCs in the V1 model that were closer in amplitude to those observed empirically was to reduce the maximal conductance of the AMPA receptor-gated channel (ḡAMPA), to just 31% of its value in the dlPFC model (Fig. 11A2; Table 1). After making this change, the model results paralleled those found empirically; hereafter, only V1 results with the reduced ḡAMPA value are discussed. Plotting EPSC amplitudes as a cumulative distribution histogram revealed a significantly higher proportion of low-amplitude EPSCs in the V1 model than in dlPFC (Kolmogorov–Smirnov test, p < 0.001) and fit the empirically observed cumulative distributions remarkably well (Fig. 11C, circles vs solid lines). The amplitude difference is evident in Figure 11D, which overlays all EPSCs generated in the two models in both apical (left) and basal (right) arbors. Individual EPSCs are shown in black, with the mean of each group shown in color. In both model neurons, the traversed distance from synapse to soma varied more across the apical arbors than the basal. Accordingly, there was more variability in EPSC shape across the apical arbors than the basal in both models. Figure 11E illustrates significant differences in EPSC shape statistics for the V1 versus dlPFC models, consistent with the empirical results. The mean amplitude of EPSCs was significantly smaller in the V1 versus dlPFC models (p < 0.001). Both rise time and decay time constants of EPSCs were significantly shorter in the V1 model (p < 0.001), and the half-widths of EPSCs were significantly smaller (p < 0.001).
Modeling of IPSCs parallels the EPSC modeling results
Simulation of IPSCs proceeded similarly as was done for the EPSCs, with analogous results. Inhibitory synapses were added across the dendritic arbor of both model neurons, at densities similar to those reported by Chen et al. (2012), then activated individually. Synaptic parameters were tuned manually to fit the mean IPSC of the dlPFC model to empirical data (Fig. 12A1). Holding synaptic parameters constant and stimulating inhibitory synapses across the tuned V1 model neuron (Fig. 12A2; dotted blue line) produced a mean IPSC with greater amplitude than the dlPFC model (22.56 ± 1.16 vs 15.58 ± 0.85 pA; p < 0.001), contrary to the empirical finding (Fig. 8A). When holding synaptic parameters constant in the two models, semi-linear regression demonstrated that distance from the soma accounted for 97% of the variation of the natural logarithm of IPSC amplitude (log(A) = 3.57 − 0.04D; r = −0.99; F(1,115) = 4280; p < 0.001; Fig. 12B, right, solid line). Adding an interaction between distance (D) and a categorical variable that incorporated remaining differences between the two models (M) improved the regression a small but statistically significant amount (log(A) = 3.59 − 0.004D − 0.13M − 0.001M × D; r = −0.99; F(3,113) = 9.62; p < 0.0024). These results indicated that higher IPSC amplitudes in the V1 model were explained almost entirely by dendrite length.
Figure 12.
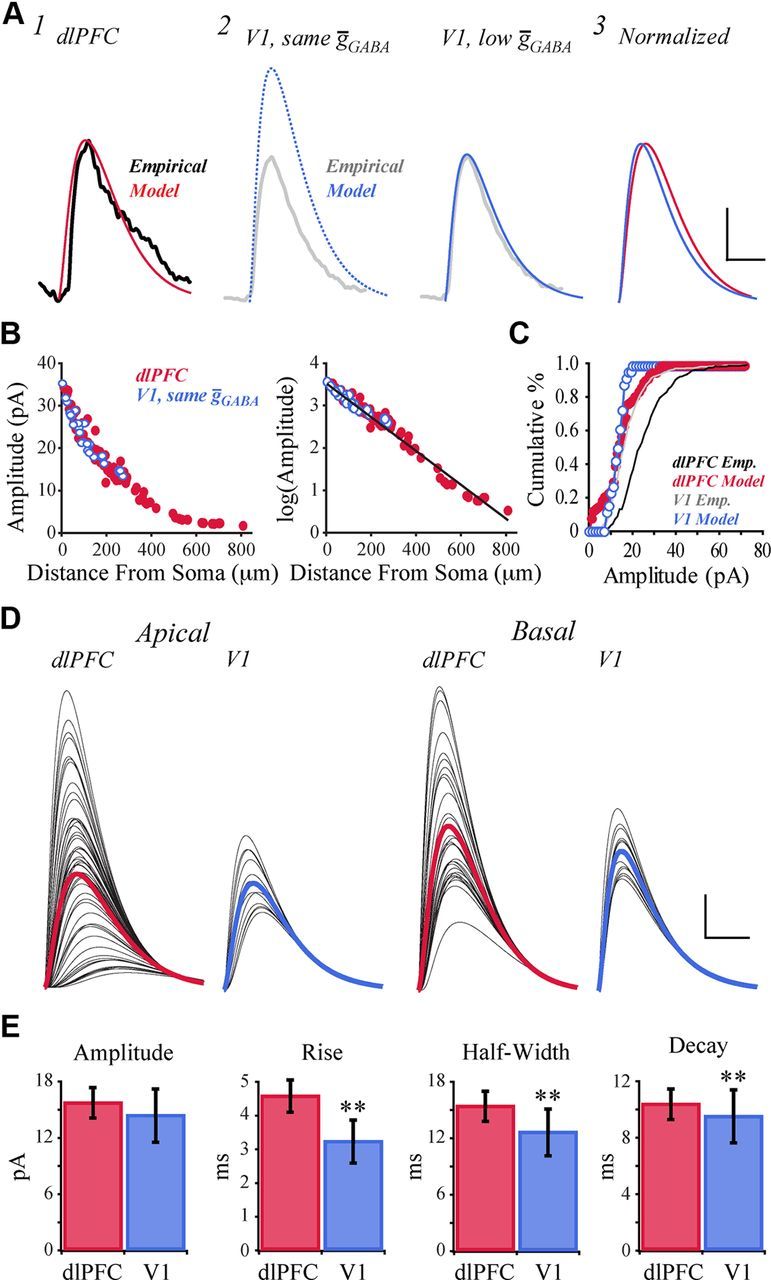
IPSC simulations predict reduced conductance of GABAA receptor-gated channels in V1 versus dlPFC. A1, Mean IPSC of the dlPFC model (red), overlaying the representative IPSC recorded empirically from dlPFC neurons (black, from Fig. 8C). A2, Mean IPSC of the V1 model, using the same ḡGABA as the dlPFC model (left, blue dotted line), and when reducing ḡGABA by 42% (right, blue solid line). Model traces overlay the representative IPSC recorded empirically from V1 neurons (gray, from Fig. 8C). A3, Normalized overlay of mean IPSC traces of the dlPFC and low-ḡGABA V1 models. B, Left, IPSC amplitude versus synaptic distance from the soma in the dlPFC model (red filled circles) and V1 model (blue open circles), assuming equal values of ḡGABA. Right, Log-transformed IPSC amplitudes versus synaptic distance from the soma. The best-fit linear regression of log(amplitude) versus distance is shown in black. C, Cumulative frequency histograms of IPSC amplitudes in the dlPFC and low-ḡGABA V1 models (1 pA bins; filled red circles and open blue circles respectively). Cumulative frequency histograms of the dlPFC (black line) and V1 (gray line) empirical data are superimposed. D, IPSCs evoked by activation of each individual synapse on the apical and basal arbors, for the dlPFC and low-ḡGABA V1 models. Individual IPSCs shown in black; mean IPSC traces shown in color. E, Bar graphs comparing kinetics of IPSCs in dlPFC versus low-ḡGABA V1 model neurons. Calibration: A, D, 5 pA/10 ms. **p < 0.01.
As with the EPSCs, reducing the maximal conductance of the GABAA receptor-gated channel (ḡGABA) to 58% of the dlPFC value resulted in a good fit of the mean V1 model IPSC to that recorded empirically (Fig. 12A2; Table 1). After this conductance change, the cumulative distribution of IPSCs differed between the V1 and dlPFC models (Kolmogorov–Smirnov test, p < 0.001; Fig. 12C). However, both models had a higher proportion of low-amplitude events than observed empirically, illustrated in Figure 12C as a leftward shift of the model distributions relative to the empirical distributions.
The IPSCs generated by activating all inhibitory synapses in the two models are shown in Figure 12D. Variation in IPSC shape was greater across the apical arbors than the basal arbors. Consistent with the empirical results, Figure 12E demonstrates that there was no difference in IPSC amplitude between the V1 and dlPFC models (p = 0.20), but, unlike what was observed empirically, the rise time, half-width, and decay times were all significantly shorter in the V1 model than the dlPFC model (p < 0.001; Fig. 12E).
Discussion
This study was designed to compare both the structural and functional properties of layer 3 pyramidal neurons in V1 versus dlPFC of the rhesus monkey. We chose to examine these two areas because they represent distinct ends of the spectrum of neocortical complexity and specialization, from primary sensory processing by V1 to mediation of high-order cognitive processes by dlPFC. This interdisciplinary study marks the first time that empirical data on morphology and physiology have been combined with insights from computational modeling to understand the implications of structural differences between pyramidal neurons in functionally distinct cortical areas.
Structural differences between V1 and dlPFC neurons
In a series of elegant studies, Elston and Rosa (1997, 1998) have previously shown that the basal dendritic arbors of layer 3 pyramidal neurons become increasingly complex along processing streams that have increasingly complex response properties. In the present study, fabulous neuron filling obtained during recordings, ultra-high-resolution confocal microscopy, and 3D morphologic reconstructions enabled us to confirm and extend (to the entire dendritic arbor) previous reports that PFC neurons possess much larger and more complex dendritic arbors, with a much higher density of dendritic spines, compared with V1 neurons (Elston, 2000, 2003; Elston and Rosa, 2000; Elston et al., 2001). Major differences in dendritic arborization and spine density between V1 and dlPFC neurons likely reflect differences in the relative complexity of information processing within each region (Jacobs and Scheibel, 2002; Elston, 2007; Spruston, 2008). As evidenced by their far higher number and density of dendritic spines, dlPFC neurons integrate much more abundant and diverse afferent input than do V1 neurons. The dlPFC receives input from visual, premotor, auditory, somatosensory, and cingulate association cortices, as well as from the mediodorsal and ventral-anterior thalamic nuclei (for review, see Barbas, 1992; Luebke et al., 2010a); V1 receives input almost exclusively from visual association cortices and from the lateral geniculate nucleus (Peters et al., 1994; Budd, 1998; Latawiec et al., 2000) (for review, see Casagrande and Kaas, 1994). Interestingly, the proportion of spine subtypes in V1 and dlPFC, compared here for the first time, was largely similar. In summary, by virtue of their much more complex dendritic arbors, dlPFC neurons have a greater potential for electrical compartmentalization than do the relatively simple V1 neurons and hence a greater capacity for complex integration of information.
Electrophysiological differences between V1 and dlPFC neurons
Cable theory and modeling studies predict that structural differences in V1 versus dlPFC neurons lead to differences in electrophysiological properties, and here we provide the first direct empirical evidence supporting this prediction. Mean input resistance was twice as high in the much smaller V1 neurons; this, together with a modestly depolarized resting potential and lower rheobase led to significantly higher action potential firing rates in V1 compared with dlPFC neurons. Importantly, V1 neurons had the capacity to fire in both a tonic and a phasic manner, while dlPFC neurons never exhibited phasic firing. Previous studies have suggested that phasic activity of V1 neurons likely facilitates visually driven synchronous cortical activity (Gray and McCormick, 1996; Nowak et al., 2003), whereas sustained tonic activation of dlPFC neurons likely facilitates temporal information-storage processes during delayed-response tasks (Goldman-Rakic, 1987; Fuster, 1997; Miller, 1999; Funahashi, 2001). Future modeling and empirical studies will address the mechanisms underlying this difference in repetitive firing patterns. AMPA receptor-mediated sEPSCs and GABAA receptor-mediated sIPSCs in V1 neurons were significantly faster and of lower amplitude compared with those in dlPFC neurons. Differences in kinetics and amplitude likely reflect significant differences in spatial summation and local signal attenuation that occur in the distinctly different dendritic arbors of V1 and dlPFC neurons. Another possibility, predicted by our modeling studies (discussed below), is a difference in the conductance of AMPA and/or GABAA channels. While layer 3 pyramidal neurons of dlPFC receive many more synaptic inputs, this was not associated with an increased frequency of synaptic events. This might be because the majority of afferent inputs, particularly from distant sites, are cut in the in vitro slice preparation, effectively “normalizing” synaptic inputs in the two slice preparations.
Modeling insights for V1 versus dlPFC neurons
To gain insight into the relationship between morphological and physiological properties, reconstructed V1 and dlPFC neurons were incorporated into realistic compartment models. Past studies have compared how model output changes when applied to different neuron morphologies (Mainen and Sejnowski, 1996; Vetter et al., 2001; Krichmar et al., 2002; Schaefer et al., 2003), and how systematic morphologic perturbations affect neuronal output (Stiefel and Sejnowski, 2007; Torben-Nielsen and Stiefel, 2009, 2010; van Elburg and van Ooyen, 2010). Morphoelectrotonic analyses have quantified how signals are attenuated throughout dendritic arbors (Zador et al., 1995; Carnevale et al., 1997; Jaffe and Carnevale, 1999; Kabaso et al., 2009). In the present study, when model parameters were held constant, signals in the electrotonically compact V1 neuron attenuated less than in the larger dlPFC neuron. Likewise, holding model parameters constant, the input resistance, firing rates, and PSC amplitudes were higher in the V1 model neuron than in the dlPFC neuron, in agreement with previous modeling studies. Thus, if the model assumptions hold, action potentials are likely to backpropagate further into the V1 dendritic tree than in dlPFC (Kabaso et al., 2009).
The most fascinating insights lay in comparing the modeling results to the empirical physiological data of V1 and dlPFC neurons. In particular, morphologic differences alone increased the input resistance and firing rates more than what was observed experimentally. Reducing passive membrane resistance and maximal conductances of both Hodgkin–Huxley channels allowed the V1 model to fit the V1 empirical data much better. Despite the differing passive and membrane conductance parameters, when synaptic parameters were equal, the mean EPSC and IPSC amplitudes were larger in the model V1 neuron than in dlPFC, in opposition to the empirical results. Reducing the conductance of AMPA channels was sufficient to fit the model V1 to the empirical V1 data. Consistent with this idea, there is evidence that in the human cortex V1 neurons possess a higher proportion of low-conductance GluR2 subunit-containing AMPARs than do dlPFC neurons (Dracheva et al., 2005). It is not known whether differences exist in the expression of GABAA receptor subunits conferring different conductances in the two brain areas in primates, but this suggests a fertile field for future investigation. Indeed, our findings underscore the interplay of modeling and empirical experiments that is essential to understanding neuronal signaling.
Limitations of the model
For this study, we deliberately chose a standard compartmental model with the fewest channel types necessary to generate action potentials (Mainen and Sejnowski, 1996; Vetter et al., 2001). As a result, the model exhibited no firing rate adaptation (Faber and Sah, 2003), phasic activity, or depolarizing “sag” potentials (Santoro and Baram, 2003), as are observed experimentally. For simplicity, we assumed a uniform distribution of ion channels through the soma and dendrites in both model neurons. Dendritic spines were included in the model using a well established algorithm (Stratford et al., 1989), but were not modeled explicitly. As such, the prediction that V1 neurons have lower densities of Na+ and K+ channels and lower AMPA and GABAA channel conductances than dlPFC is only preliminary, and requires empirical validation. In the future, automated parameter optimization and sensitivity analysis techniques (Weaver and Wearne, 2006, 2008) will be used to develop and explore models with a diversity of ion channels for neurons from each brain region.
Implications for network function of V1 and dlPFC
In summary, we have confirmed and extended previous studies demonstrating marked structural differences in V1 and dlPFC pyramidal neurons and have further shown that these neurons differ distinctly in their basic electrophysiological properties. The greater excitability of V1 neurons likely reflects that these neurons need to integrate continuously changing inputs more rapidly than dlPFC neurons. Strong backpropagation predicted by model V1 neurons could contribute to this increased excitability: a backpropagating action potential that coincides with a distal synaptic input would generate a calcium spike, which in turn could quickly generate multiple spikes in the soma (for review, see London and Häusser, 2005). Since dlPFC neurons have much more complex dendritic arbors and receive many more inputs than do V1 neurons, they would be predicted to perform a wider range of local dendritic computations than would V1 neurons (Poirazi et al., 2003). This increased complexity at a single-neuron level will be magnified exponentially in cortical networks containing hundreds or thousands of neurons and might, at a fundamental level, underlie the ability of the dlPFC to perform much more complex computations than does V1.
Footnotes
This work was supported by NIH/NIA Grants P01 AG00001, R01 AG035071, and R01 AG035071, and NIH/NCRR Grant RR00165. We thank Drs. Anne Rocher, Doron Kabaso, and Patrick Coskren for help with data acquisition; and Dr. Maria Medalla for careful reading of the manuscript. We are deeply indebted to Dr. Susan Wearne (1955–2009) for her gracious mentorship and scientific creativity, which served as the initial impetus for this collaborative work.
The authors declare no competing financial interests.
References
- Acker CD, White JA. Roles of IA and morphology in action potential propagation in CA1 pyramidal cell dendrites. J Comput Neurosci. 2007;23:201–216. doi: 10.1007/s10827-007-0028-8. [DOI] [PubMed] [Google Scholar]
- Ascoli GA. Passive dendritic integration heavily affects spiking dynamics of recurrent networks. Neural Netw. 2003;16:657–663. doi: 10.1016/S0893-6080(03)00090-X. [DOI] [PubMed] [Google Scholar]
- Barbas H. Architecture and cortical connections of the prefrontal cortex in the rhesus monkey. Adv Neurol. 1992;57:91–115. [PubMed] [Google Scholar]
- Brown TH, Zador A, Mainen ZF, Claiborne BJ. Hebbian computations in hippocampal dendrites and spines. In: McKenna T, Davis J, Zornetzer SF, editors. Single neuron computation. San Diego: Academic; 1992. pp. 81–116. [Google Scholar]
- Budd JM. Extrastriate feedback to primary visual cortex in primates: a quantitative analysis of connectivity. Proc Biol Sci. 1998;265:1037–1044. doi: 10.1098/rspb.1998.0396. [DOI] [PMC free article] [PubMed] [Google Scholar]
- Carnevale NT, Hines ML. The NEURON book. Cambridge, UK: Cambridge UP; 2006. [Google Scholar]
- Carnevale NT, Tsai KY, Claiborne BJ, Brown TH. Comparative electrotonic analysis of three classes of rat hippocampal neurons. J Neurophysiol. 1997;78:703–720. doi: 10.1152/jn.1997.78.2.703. [DOI] [PubMed] [Google Scholar]
- Casagrande VA, Kaas JH. The afferent, intrinsic and efferent connections of primary visual cortex in primates. In: Peters A, Rockland KS, editors. Cerebral cortex. New York: Plenum; 1994. pp. 201–259. [Google Scholar]
- Chen JL, Villa KL, Cha JW, So PT, Kubota Y, Nedivi E. Clustered dynamics of inhibitory synapses and dendritic spines in the adult neocortex. Neuron. 2012;74:361–373. doi: 10.1016/j.neuron.2012.02.030. [DOI] [PMC free article] [PubMed] [Google Scholar]
- Chen Y, Anand S, Martinez-Conde S, Macknik SL, Bereshpolova Y, Swadlow HA, Alonso JM. The linearity and selectivity of neuronal responses in awake visual cortex. J Vis. 2009;9:12.1–17. doi: 10.1167/9.9.12. [DOI] [PMC free article] [PubMed] [Google Scholar]
- Conel JL. The post natal development of the human cerebral cortex. Cambridge, MA: Harvard UP; 1941. The cortex of a one month old infant. [Google Scholar]
- Conel JL. The post natal development of the human cerebral cortex. Cambridge, MA: Harvard UP; 1967. The cortex of a six year old child. [Google Scholar]
- Cromer JA, Roy JE, Miller EK. Representation of multiple, independent categories in the primate prefrontal cortex. Neuron. 2010;66:796–807. doi: 10.1016/j.neuron.2010.05.005. [DOI] [PMC free article] [PubMed] [Google Scholar]
- Cuntz H, Forstner F, Borst A, Häusser M. One rule to grow them all: a general theory of neuronal branching and its practical application. PLoS Comput Biol. 2010;6:e1000877. doi: 10.1371/journal.pcbi.1000877. [DOI] [PMC free article] [PubMed] [Google Scholar]
- Desbordes G, Jin J, Weng C, Lesica NA, Stanley GB, Alonso JM. Timing precision in population coding of natural scenes in the early visual system. PLoS Biol. 2008;6:e324. doi: 10.1371/journal.pbio.0060324. [DOI] [PMC free article] [PubMed] [Google Scholar]
- Dombrowski SM, Hilgetag CC, Barbas H. Quantitative architecture distinguishes prefrontal cortical systems in the rhesus monkey. Cereb Cortex. 2001;11:975–988. doi: 10.1093/cercor/11.10.975. [DOI] [PubMed] [Google Scholar]
- Dracheva S, McGurk SR, Haroutunian V. mRNA expression of AMPA receptors and AMPA receptor binding proteins in the cerebral cortex of elderly schizophrenics. J Neurosci Res. 2005;79:868–878. doi: 10.1002/jnr.20423. [DOI] [PubMed] [Google Scholar]
- Elston GN. Pyramidal cells of the frontal lobe: all the more spinous to think with. J Neurosci. 2000;20:RC95. doi: 10.1523/JNEUROSCI.20-18-j0002.2000. [DOI] [PMC free article] [PubMed] [Google Scholar]
- Elston GN. Cortical heterogeneity: implications for visual processing and polysensory integration. J Neurocytol. 2002;31:317–335. doi: 10.1023/a:1024182228103. [DOI] [PubMed] [Google Scholar]
- Elston GN. Cortex, cognition and the cell: new insights into the pyramidal neuron and prefrontal function. Cereb Cortex. 2003;13:1124–1138. doi: 10.1093/cercor/bhg093. [DOI] [PubMed] [Google Scholar]
- Elston GN. Specialization of the neocortical pyramidal cell during primate evolution. In: Kaas JH, Preuss TM, editors. Evolution of nervous systems. Oxford: Academic; 2007. pp. 191–242. [Google Scholar]
- Elston GN, Rosa MG. The occipitoparietal pathway of the macaque monkey: comparison of pyramidal cell morphology in layer III of functionally related cortical visual areas. Cereb Cortex. 1997;7:432–452. doi: 10.1093/cercor/7.5.432. [DOI] [PubMed] [Google Scholar]
- Elston GN, Rosa MG. Morphological variation of layer III pyramidal neurones in the occipitotemporal pathway of the macaque monkey visual cortex. Cereb Cortex. 1998;8:278–294. doi: 10.1093/cercor/8.3.278. [DOI] [PubMed] [Google Scholar]
- Elston GN, Rosa MG. Pyramidal cells, patches, and cortical columns: a comparative study of infragranular neurons in TEO, TE, and the superior temporal polysensory area of the macaque monkey. J Neurosci. 2000;20:RC117. doi: 10.1523/JNEUROSCI.20-24-j0003.2000. [DOI] [PMC free article] [PubMed] [Google Scholar]
- Elston GN, Benavides-Piccione R, DeFelipe J. The pyramidal cell in cognition: a comparative study in human and monkey. J Neurosci. 2001;21:RC163. doi: 10.1523/JNEUROSCI.21-17-j0002.2001. [DOI] [PMC free article] [PubMed] [Google Scholar]
- Faber ES, Sah P. Calcium-activated potassium channels: multiple contributions to neuronal function. Neuroscientist. 2003;9:181–194. doi: 10.1177/1073858403009003011. [DOI] [PubMed] [Google Scholar]
- Fiala JC. Reconstruct: a free editor for serial section microscopy. J Microsc. 2005;218:52–61. doi: 10.1111/j.1365-2818.2005.01466.x. [DOI] [PubMed] [Google Scholar]
- Funahashi S. Neuronal mechanisms of executive control by the prefrontal cortex. Neurosci Res. 2001;39:147–165. doi: 10.1016/s0168-0102(00)00224-8. [DOI] [PubMed] [Google Scholar]
- Funahashi S, Bruce CJ, Goldman-Rakic PS. Mnemonic coding of visual space in the monkey's dorsolateral prefrontal cortex. J Neurophysiol. 1989;61:331–349. doi: 10.1152/jn.1989.61.2.331. [DOI] [PubMed] [Google Scholar]
- Funahashi S, Bruce CJ, Goldman-Rakic PS. Visuospatial coding in primate prefrontal neurons revealed by oculomotor paradigms. J Neurophysiol. 1990;63:814–831. doi: 10.1152/jn.1990.63.4.814. [DOI] [PubMed] [Google Scholar]
- Fuster JM. The prefrontal cortex: anatomy, physiology and neuropsychology of the frontal lobe. Ed 3. Philadelphia: Lippincott-Raven; 1997. [Google Scholar]
- Fuster JM, Alexander GE. Neuron activity related to short-term memory. Science. 1971;173:652–654. doi: 10.1126/science.173.3997.652. [DOI] [PubMed] [Google Scholar]
- Gabbiani F, Cox SJ. Mathematics for neuroscientists. London, UK: Academic; 2010. [Google Scholar]
- Goldman-Rakic PS. Circuitry of primate prefrontal cortex and regulation of behavior by representational memory. In: Plum F, editor. Higher functions of the brain, Pt 1, Handbook of physiology, Sec 1, The nervous system. Vol V. Bethesda, MD: American Physiological Society; 1987. pp. 373–417. [Google Scholar]
- Gray CM, McCormick DA. Chattering cells: superficial pyramidal neurons contributing to the generation of synchronous oscillations in the visual cortex. Science. 1996;274:109–113. doi: 10.1126/science.274.5284.109. [DOI] [PubMed] [Google Scholar]
- Hao J, Rapp PR, Leffler AE, Leffler SR, Janssen WG, Lou W, McKay H, Roberts JA, Wearne SL, Hof PR, Morrison JH. Estrogen alters spine number and morphology in prefrontal cortex of aged female rhesus monkeys. J Neurosci. 2006;26:2571–2578. doi: 10.1523/JNEUROSCI.3440-05.2006. [DOI] [PMC free article] [PubMed] [Google Scholar]
- Harris KM, Jensen FE, Tsao B. Three-dimensional structure of dendritic spines and synapses in rat hippocampus (CA1) at postnatal day 15 and adult ages: implications for the maturation of synaptic physiology and long-term potentiation. J Neurosci. 1992;12:2685–2705. doi: 10.1523/JNEUROSCI.12-07-02685.1992. [DOI] [PMC free article] [PubMed] [Google Scholar]
- Hines ML, Morse T, Migliore M, Carnevale NT, Shepherd GM. ModelDB: a database to support computational neuroscience. J Comput Neurosci. 2004;17:7–11. doi: 10.1023/B:JCNS.0000023869.22017.2e. [DOI] [PMC free article] [PubMed] [Google Scholar]
- Hubel DH, Wiesel TN. Receptive fields of cells in striate cortex of very young, visually inexperienced kittens. J Neurophysiol. 1963;26:994–1002. doi: 10.1152/jn.1963.26.6.994. [DOI] [PubMed] [Google Scholar]
- Jacobs B, Scheibel AB. Unity and diversity. In: Schüz A, Miller R, editors. Cortical areas. London: Taylor and Francis; 2002. pp. 111–131. [Google Scholar]
- Jaffe DB, Carnevale NT. Passive normalization of synaptic integration influenced by dendritic architecture. J Neurophysiol. 1999;82:3268–3285. doi: 10.1152/jn.1999.82.6.3268. [DOI] [PubMed] [Google Scholar]
- Jones EG, Powell TP. Morphological variations in the dendritic spines of the neocortex. J Cell Sci. 1969;5:509–529. doi: 10.1242/jcs.5.2.509. [DOI] [PubMed] [Google Scholar]
- Kabaso D, Coskren PJ, Henry BI, Hof PR, Wearne SL. The electrotonic structure of pyramidal neurons contributing to prefrontal cortical circuits in macaque monkeys is significantly altered in aging. Cereb Cortex. 2009;19:2248–2268. doi: 10.1093/cercor/bhn242. [DOI] [PMC free article] [PubMed] [Google Scholar]
- Koch C, Segev I. The role of single neurons in information processing. Nat Neurosci. 2000;3:1171–1177. doi: 10.1038/81444. [DOI] [PubMed] [Google Scholar]
- Krichmar JL, Nasuto SJ, Scorcioni R, Washington SD, Ascoli GA. Effects of dendritic morphology on CA3 pyramidal cell electrophysiology: a simulation study. Brain Res. 2002;941:11–28. doi: 10.1016/s0006-8993(02)02488-5. [DOI] [PubMed] [Google Scholar]
- Latawiec D, Martin KA, Meskenaite V. Termination of the geniculocortical projection in the striate cortex of macaque monkey: a quantitative immunoelectron microscopic study. J Comp Neurol. 2000;419:306–319. doi: 10.1002/(sici)1096-9861(20000410)419:3<306::aid-cne4>3.0.co;2-2. [DOI] [PubMed] [Google Scholar]
- London M, Häusser M. Dendritic computation. Annu Rev Neurosci. 2005;28:503–532. doi: 10.1146/annurev.neuro.28.061604.135703. &. [DOI] [PubMed] [Google Scholar]
- Luebke JI, Amatrudo JM. Age-related increase of sI(AHP) in prefrontal pyramidal cells of monkeys: relationship to cognition. Neurobiol Aging. 2012;33:1085–1095. doi: 10.1016/j.neurobiolaging.2010.07.002. [DOI] [PMC free article] [PubMed] [Google Scholar]
- Luebke JI, Chang YM. Effects of aging on the electrophysiological properties of layer 5 pyramidal cells in the monkey prefrontal cortex. Neuroscience. 2007;150:556–562. doi: 10.1016/j.neuroscience.2007.09.042. [DOI] [PMC free article] [PubMed] [Google Scholar]
- Luebke J, Barbas H, Peters A. Effects of normal aging on prefrontal area 46 in the rhesus monkey. Brain Res Rev. 2010a;62:212–232. doi: 10.1016/j.brainresrev.2009.12.002. [DOI] [PMC free article] [PubMed] [Google Scholar]
- Luebke JI, Weaver CM, Rocher AB, Rodriguez A, Crimins JL, Dickstein DL, Wearne SL, Hof PR. Dendritic vulnerability in neurodegenerative disease: insights from analyses of cortical pyramidal neurons in transgenic mouse models. Brain Struct Funct. 2010b;214:181–199. doi: 10.1007/s00429-010-0244-2. [DOI] [PMC free article] [PubMed] [Google Scholar]
- Mainen ZF, Sejnowski TJ. Influence of dendritic structure on firing pattern in model neocortical neurons. Nature. 1996;382:363–366. doi: 10.1038/382363a0. [DOI] [PubMed] [Google Scholar]
- Mainen ZF, Joerges J, Huguenard JR, Sejnowski TJ. A model of spike initiation in neocortical pyramidal neurons. Neuron. 1995;15:1427–1439. doi: 10.1016/0896-6273(95)90020-9. [DOI] [PubMed] [Google Scholar]
- Miller EK. The prefrontal cortex: complex neural properties for complex behavior. Neuron. 1999;22:15–17. doi: 10.1016/s0896-6273(00)80673-x. [DOI] [PubMed] [Google Scholar]
- Miller EK. The prefrontal cortex and cognitive control. Nat Rev Neurosci. 2000;1:59–65. doi: 10.1038/35036228. [DOI] [PubMed] [Google Scholar]
- Nowak LG, Azouz R, Sanchez-Vives MV, Gray CM, McCormick DA. Electrophysiological classes of cat primary visual cortical neurons in vivo as revealed by quantitative analyses. J Neurophysiol. 2003;89:1541–1566. doi: 10.1152/jn.00580.2002. [DOI] [PubMed] [Google Scholar]
- O'Kusky J, Colonnier M. A laminar analysis of the number of neurons, glia, and synapses in the adult cortex (area 17) of adult macaque monkeys. J Comp Neurol. 1982;210:278–290. doi: 10.1002/cne.902100307. [DOI] [PubMed] [Google Scholar]
- Peters A, Kaiserman-Abramof IR. The small pyramidal neuron of the rat cerebral cortex. The perikaryon, dendrites and spines. Am J Anat. 1970;127:321–355. doi: 10.1002/aja.1001270402. [DOI] [PubMed] [Google Scholar]
- Peters A, Payne BR, Budd J. A numerical analysis of the geniculocortical input to striate cortex in the monkey. Cereb Cortex. 1994;4:215–229. doi: 10.1093/cercor/4.3.215. [DOI] [PubMed] [Google Scholar]
- Poirazi P, Brannon T, Mel BW. Pyramidal neuron as a two-layer neural network. Neuron. 2003;37:989–999. doi: 10.1016/s0896-6273(03)00149-1. [DOI] [PubMed] [Google Scholar]
- Rall W. Time constants and electrotonic length of membrane cylinders and neurons. Biophys J. 1969;9:1483–1508. doi: 10.1016/S0006-3495(69)86467-2. [DOI] [PMC free article] [PubMed] [Google Scholar]
- Ramón y Cajal S. Estructura intima de los centros nerviosos. Rev Ciencias Med. 1894;20:145–160. [Google Scholar]
- Rodriguez A, Ehlenberger D, Kelliher K, Einstein M, Henderson SC, Morrison JH, Hof PR, Wearne SL. Automated reconstruction of three-dimensional neuronal morphology from laser scanning microscopy images. Methods. 2003;30:94–105. doi: 10.1016/s1046-2023(03)00011-2. [DOI] [PubMed] [Google Scholar]
- Rodriguez A, Ehlenberger DB, Hof PR, Wearne SL. Rayburst sampling, an algorithm for automated three-dimensional shape analysis from laser scanning microscopy images. Nat Protoc. 2006;1:2152–2161. doi: 10.1038/nprot.2006.313. [DOI] [PubMed] [Google Scholar]
- Rodriguez A, Ehlenberger DB, Dickstein DL, Hof PR, Wearne SL. Automated three-dimensional detection and shape classification of dendritic spines from fluorescence microscopy images. PLoS One. 2008;3:e1997. doi: 10.1371/journal.pone.0001997. [DOI] [PMC free article] [PubMed] [Google Scholar]
- Santoro B, Baram TZ. The multiple personalities of h-channels. Trends Neurosci. 2003;26:550–554. doi: 10.1016/j.tins.2003.08.003. [DOI] [PMC free article] [PubMed] [Google Scholar]
- Schaefer AT, Larkum ME, Sakmann B, Roth A. Coincidence detection in pyramidal neurons is tuned by their dendritic branching pattern. J Neurophysiol. 2003;89:3143–3154. doi: 10.1152/jn.00046.2003. [DOI] [PubMed] [Google Scholar]
- Scorcioni R, Polavaram S, Ascoli GA. L-Measure: a web-accessible tool for the analysis, comparison and search of digital reconstructions of neuronal morphologies. Nat Protoc. 2008;3:866–876. doi: 10.1038/nprot.2008.51. [DOI] [PMC free article] [PubMed] [Google Scholar]
- Seger CA, Miller EK. Category learning in the brain. Annu Rev Neurosci. 2010;33:203–219. doi: 10.1146/annurev.neuro.051508.135546. [DOI] [PMC free article] [PubMed] [Google Scholar]
- Sholl DA. Dendritic organization in the neurons of the visual and motor cortices of the cat. J Anat. 1953;87:387–406. [PMC free article] [PubMed] [Google Scholar]
- Spruston N. Pyramidal neurons: dendritic structure and synaptic integration. Nat Rev Neurosci. 2008;9:206–221. doi: 10.1038/nrn2286. [DOI] [PubMed] [Google Scholar]
- Stiefel KM, Sejnowski TJ. Mapping function onto neuronal morphology. J Neurophysiol. 2007;98:513–526. doi: 10.1152/jn.00865.2006. [DOI] [PMC free article] [PubMed] [Google Scholar]
- Stratford K, Mason A, Larkman A, Major G, Jack J. The modeling of pyramidal neurons in the visual cortex. In: Durbin R, Miall C, Mitchison G, editors. The computing neuron. Boston: Addison-Wesley; 1989. pp. 296–321. [Google Scholar]
- Teeter CM, Stevens CF. A general principle of neural arbor branch density. Curr Biol. 2011;21:2105–2108. doi: 10.1016/j.cub.2011.11.013. [DOI] [PubMed] [Google Scholar]
- Torben-Nielsen B, Stiefel KM. Systematic mapping between dendritic function and structure. Network. 2009;20:69–105. doi: 10.1080/09548980902984833. [DOI] [PubMed] [Google Scholar]
- Torben-Nielsen B, Stiefel KM. An inverse approach for elucidating dendritic function. Front Comput Neurosci. 2010;4:128. doi: 10.3389/fncom.2010.00128. [DOI] [PMC free article] [PubMed] [Google Scholar]
- Traub RD, Contreras D, Cunningham MO, Murray H, LeBeau FE, Roopun A, Bibbig A, Wilent WB, Higley MJ, Whittington MA. Single-column thalamocortical network model exhibiting gamma oscillations, sleep spindles, and epileptogenic bursts. J Neurophysiol. 2005;93:2194–2232. doi: 10.1152/jn.00983.2004. [DOI] [PubMed] [Google Scholar]
- Tsai KY, Carnevale NT, Claiborne BJ, Brown TH. Efficient mapping from neuroanatomical to electrotonic space. Network. 1994;5:21–46. [Google Scholar]
- Tsay D, Yuste R. Role of dendritic spines in action potential backpropagation: a numerical simulation study. J Neurophysiol. 2002;88:2834–2845. doi: 10.1152/jn.00781.2001. [DOI] [PubMed] [Google Scholar]
- van Elburg RA, van Ooyen A. Impact of dendritic size and dendritic topology on burst firing in pyramidal cells. PLoS Comput Biol. 2010;6:e1000781. doi: 10.1371/journal.pcbi.1000781. [DOI] [PMC free article] [PubMed] [Google Scholar]
- Vetter P, Roth A, Häusser M. Propagation of action potentials in dendrites depends on dendritic morphology. J Neurophysiol. 2001;85:926–937. doi: 10.1152/jn.2001.85.2.926. [DOI] [PubMed] [Google Scholar]
- Wearne SL, Rodriguez A, Ehlenberger DB, Rocher AB, Henderson SC, Hof PR. New techniques for imaging, digitization and analysis of three-dimensional neural morphology on multiple scales. Neuroscience. 2005;136:661–680. doi: 10.1016/j.neuroscience.2005.05.053. [DOI] [PubMed] [Google Scholar]
- Weaver CM, Wearne SL. The role of action potential shape and parameter constraints in optimization of compartment models. Neurocomputing. 2006;69:1053–1057. [Google Scholar]
- Weaver CM, Wearne SL. Neuronal firing sensitivity to morphologic and active membrane parameters. PLoS Comput Biol. 2008;4:e11. doi: 10.1371/journal.pcbi.0040011. [DOI] [PMC free article] [PubMed] [Google Scholar]
- Wiesel TN, Hubel DH. Single-cell responses in striate cortex of kittens deprived of vision in one eye. J Neurophysiol. 1963;26:1003–1017. doi: 10.1152/jn.1963.26.6.1003. [DOI] [PubMed] [Google Scholar]
- Yadav A, Gao YZ, Rodriguez A, Dickstein DL, Wearne SL, Luebke JI, Hof PR, Weaver CM. Morphologic evidence for spatially clustered spines in apical dendrites of monkey neocortical pyramidal cells. J Comp Neurol. 2012;520:2888–2902. doi: 10.1002/cne.23070. [DOI] [PMC free article] [PubMed] [Google Scholar]
- Zador AM, Agmon-Snir H, Segev I. The morphoelectrotonic transform: a graphical approach to dendritic function. J Neurosci. 1995;15:1669–1682. doi: 10.1523/JNEUROSCI.15-03-01669.1995. [DOI] [PMC free article] [PubMed] [Google Scholar]