

Abstract
Clinical investigations designed to determine risk profiles for the development of cardiovascular disease (CVD) and type 2 diabetes mellitus (DM) are usually performed in homogenous populations and often focus on body mass index (BMI), waist circumference (WC), and fasting triglyceride (TG) levels. However, there are major ethnic differences in the relationship of these risk factors to outcomes. For example, the BMI risk threshold may be higher in blacks than in whites and higher in women than in men. Furthermore, a WC that predicts an obese BMI in white women only predicts a BMI in the overweight category in black women. In addition, overweight black men have a greater risk of developing type 2 DM than do overweight black women. Although TG levels are excellent predictors of insulin resistance in whites, they are not effective markers of insulin resistance in blacks. Among the criteria sets currently available to predict the development of CVD and type 2 DM, the most well known is the metabolic syndrome. The metabolic syndrome has 5 criteria: central obesity, hypertriglyceridemia, low high-density lipoprotein (HDL) levels, fasting hyperglycemia, and hypertension. To make the diagnosis of the metabolic syndrome, 3 of the 5 factors must be present. For central obesity and low HDL, the metabolic syndrome guidelines are sex specific. Diagnostic guidelines should also take ethnic differences into account, particularly in the diagnosis of central obesity and hypertriglyceridemia.
INTRODUCTION
To achieve effective prevention of cardiovascular disease (CVD) and type 2 diabetes mellitus (DM), evidence-based data on the high-risk metabolic profile are required. Most risk profiles that are currently available are based on studies of largely white populations. There is a paucity of data in other ethnic groups. Because of ethnic differences in the incidence and prevalence of CVD and type 2 DM, it cannot be assumed a priori that studies performed in whites are universally applicable.
For early diagnosis and effective prevention of cardiovascular disease and type 2 diabetes mellitus, evidence-based data on the high-risk metabolic profile are required.
One of the most important prospective studies on CVD risk factors is the Framingham Heart Study. In 1948, ~5000 residents from Framingham, Massachusetts, participated in a health survey. The Framingham Offspring Study now enrolls the original participants’ adult children.1 The Framingham cohort is white. Another rich source of information on risk factors for CVD is the Nurses’ Health Study. Instituted in 1976, the Nurses’ Health Study enrolled 120,000 female nurses aged 30 to 55 years, 94% of whom are white.2 In 1986, a third study, the Health Professionals Follow-Up, was initiated to complement the Nurses’ Health Study and enrolled more than 50,000 men in the health professions. Ninety-three percent of the participants in the Health Professionals Follow-Up Study are white.
If we are to achieve effective prevention of CVD and type 2 DM in all populations, we need to assess risk profiles not only in whites, but in other ethnic groups as well. This article will explore what is currently known about risk thresholds related to body mass index (BMI), waist circumference (WC), and triglyceride (TG) levels, and how these were established in whites. As an example of ethnic differences, the focus will shift to how well these thresholds identify blacks at high risk for CVD and type 2 DM.
BODY MASS INDEX
BMI is a valuable epidemiologic tool. It allows the evaluation of weight relative to height. Knowing the weight of an individual is not sufficient for classification into the categories of underweight, normal weight, overweight, or obese (Table I). For example, if a person weighs 70 kg (154 lbs) and has a height of 1.5 m (5 ft), then that person is considered to be obese (BMI = 31.1 kg/m2). In contrast, if a person weighs 70 kg (154 lbs) and has a height of 1.8 m (6 ft), then that person is considered to be of normal weight (BMI = 21.6 kg/m2).
Table I.
Body mass index (BMI) categories.3
| BMI Category | BMI Range (kg/m2) |
|---|---|
| Underweight | <18.5 |
| Normal weight | 18.5–24.9 |
| Overweight | 25.0–29.9 |
| Obese | >30.0 |
Body mass index = weight in kilograms/height in meters2.
Relationship of Body Mass Index to Mortality
Based on studies of minimum mortality, the National Heart, Lung, and Blood Institute and the World Health Organization together developed guidelines for the creation of BMI categories.3 In the formation of these guidelines, major consideration was given to a cancer prevention study of 60,000 white men and 240,000 white women.4 In this study, minimum mortality in men and women occurred when BMI was between 18.5 kg/m2 and 25 kg/m2 (ie, 18.5 kg/m2 ≤ BMI <25 kg/m2). The relationship between BMI and mortality was characterized by a J-shaped curve. Therefore, below a BMI of 18.5 kg/m2 or above a BMI of 25 kg/m2, mortality increased.
Compared with whites, data on the relationship of BMI to mortality in blacks are sparse. However, data on the association between BMI and mortality for black women exist in the Cancer Prevention Study I.5 Of the 200,000 female participants in that study, 3000, or less than 2%, were black. With the understanding that the percentage of black participants was small, the investigators calculated the death rate relative to BMI using 3 different statistical methods. By all 3 methods, mortality in white women rose with increasing BMI. In contrast, no relationship was observed between mortality and BMI in black women.
In a combined analysis of National Health and Nutrition Examination Survey (NHANES) data collected between 1970 and 1994, Fontaine et al6 found that years of life lost secondary to obesity alone occurred in white men at a BMI ≥26 kg/m2, and in white women at a BMI ≥28 kg/m2. In black men, the years of life lost secondary to obesity alone occurred at a BMI ≥32 kg/m2, a full 6 BMI units higher than in white men. For black women, years of life lost secondary to obesity alone occurred at a BMI threshold ≥38 kg/m2, or 10 BMI units higher than that in white women.6 Thus, NHANES data clearly indicate that there are significant differences by sex and ethnicity in the relationship between BMI and mortality.
Analyses of data from studies conducted, by the National Health and Nutrition Examination Survey have revealed both sex and ethnic differences in the relationship between body mass index and mortality.
Overall in whites, studies indicate that mortality increases if BMI is ≥25 kg/m2, whereas in blacks, the BMI of lowest mortality has yet to be determined.5–7
In black men, impaired glucose tolerance is frequently observed if the body mass index (BMI) is ≥25 kg/m2. In black women, impaired glucose tolerance does not usually occur until BMI is ≥30 kg/m2, indicating a sex difference in the relationship between BMI and glucose tolerance.
Relationship of Body Mass Index to Morbidity
Morbidity and mortality are not the same. Mortality is an end point without debate and therefore easy to categorize. In contrast, morbidity, or ill-health and a compromised quality of life secondary to increased BMI, is difficult to assess. Complications of increased BMI include type 2 DM, hypertension, CVD, arthritis, depression, discrimination, and economic hardship.
Three studies are actively working to identify the BMI of best health in blacks: the Triglyceride and Cardiovascular Risk in African Americans (TARA) study, the Jackson Heart Study, and the Black Women’s Health Study.8–11 I am the Principal Investigator of TARA, a cross-sectional investigation of 225 black men and women. The prevalence of obesity, hypertension, and glucose intolerance in TARA is similar to that observed in NHANES cohorts. By focusing on the relationship between BMI, WC, TG levels, and insulin resistance, the TARA study may help identify the most important risk factors for CVD and type 2 DM in blacks. The second of these investigations, the Jackson Heart Study, is a prospective study that began in 2000 with nearly 4000 black participants from Jackson, Mississippi.9 The Jackson Heart Study is expected to provide critical new information on obesity, hypertension, insulin resistance, dyslipidemia, CVD, and type 2 DM in blacks. The third investigation, the Black Women’s Health Study, was initiated in 1995 with more than 60,000 participants and is already providing important insights about diet, obesity, hypertension, CVD, type 2 DM, and breast cancer in black women.8 Thus, TARA, the Jackson Heart Study, and the Black Women’s Health Study may all provide a better understanding of the relationship between BMI and health in blacks.
In the TARA cohort, we observed that black men with glucose intolerance frequently have a BMI that exceeds 25 kg/m2, whereas in black women, glucose intolerance does not usually occur until BMI exceeds 30 kg/m2 (Figure 1). For example, we found no significant difference in BMI in black men with or without normal glucose tolerance (mean [SD] BMI: 29 [7] vs 31 [5] kg/m2). Altogether, 56% of black men with glucose intolerance had BMI levels in the overweight category (25 kg/m2 ≤ BMI <30 kg/m2).12 In contrast, black women with glucose intolerance had a much higher BMI than did normal glucose tolerant women (BMI: 40 [8] vs 29 [6] kg/m2; P < 0.001). Consequently, only 12% of glucose intolerant women had BMI in the overweight category. In other words, 88% of black women with glucose intolerance were obese (BMI ≥30 kg/m2). Hence, in blacks, there are marked sex differences in the relationship between BMI and glucose tolerance. Based on TARA data and a review of the literature, we believe that obesity (BMI ≥30 kg/m2) has clear adverse consequences for black women, but the overweight category (ie, 25 kg/m2 ≤ BMI <30 kg/m2) may not.
Figure 1.

Cumulative percent of glucose intolerance in blacks by sex and body mass index (BMI). Reproduced with permission.12
Obesity (body mass index [BMI] ≥30 kg/m2) has clear adverse consequences for black women, but the overweight category (ie, 25 kg/m2≤ BMI <30 kg/m2) may not.
WAIST CIRCUMFERENCE
Body Fat Distribution
There are distinct sex differences in body fat distribution. Men have more central obesity than do women. Additionally, at every level of WC, men have more visceral and less subcutaneous fat than do women (Figure 2). Increased visceral adiposity has significant metabolic consequences—it leads to the development of insulin resistance, glucose intolerance, and type 2 DM.13 Thus, sex differences in WC may have greater health implications than do sex differences in BMI.
Figure 2.

Man (upper panel) and woman (lower panel) with the same waist circumference (WC). The central white tissue in each panel depicts visceral adipose tissue (VAT). Even though the man and woman have the same WC, the man has twice as much VAT. The arrows indicate the waist perimeter. BMI = body mass index.
At every level of waist circumference, men have more visceral fat than women do. Consequently, when men and women both have central obesity, the men are at greater risk for developing glucose intolerance and type 2 diabetes mellitus.
Classification of Central Obesity
Central obesity is classified according to WC (Table II). Yet, the International Diabetes Federation (IDF) and the National Cholesterol Education Program-Adult Treatment Panel III (NCEP-ATPIII) do not use the same WC cutoffs to define central obesity.14,15 Even though both agencies agree that the guidelines should be sex specific, the WC cutoffs used by the IDF are lower than the WC cutoffs used by the NCEP-ATPIII. Another source of disagreement is that the NCEP-ATPIII uses only one set of WC guidelines for men and women worldwide. In contrast, the IDF recognizes ethnic differences in WC thresholds for whites, South Asians, Chinese, and Japanese. However, the IDF does not have sufficient data on people of African descent to make WC guideline recommendations for blacks. In the absence of data, the IDF uses WC determined from whites to diagnose central obesity in blacks. To begin to overcome this deficit, we have examined the association between WC and BMI and insulin resistance in the TARA cohort.11
Table II.
| f | WC in Men, cm | WC in Women, cm |
|---|---|---|
| National Cholesterol Education Program-Adult Treatment Panel III | ≥102 | ≥88 |
| International Diabetes Federation | ||
| Whites | ≥94 | ≥80 |
| South Asians | ≥90 | ≥80 |
| Chinese | ≥90 | ≥80 |
| Japanese | ≥85 | ≥90 |
The WC thresholds used by the IDF and the NCEP-ATPIII originate from a study in Scotland.16 Scottish men and women were measured to determine the WC (cm) that predicts either an overweight BMI (≥25 kg/m2) or an obese BMI (≥30 kg/m2). In men, a WC of ≥94 cm predicted a BMI of ≥25 kg/m2 and a WC of ≥102 cm predicted a BMI of ≥30 kg/m2. In women, a WC of ≥80 cm predicted a BMI of ≥25 kg/m2 and a WC of ≥88 cm predicted a BMI of ≥30 kg/m2. The difference between the IDF and NCEP-ATPIII classifications is that the IDF selected the WC that predicts an overweight BMI (≥25 kg/m2), whereas the NCEP-ATPIII chose the WC that predicts an obese BMI (≥30 kg/m2).14,15
Based on regression equations derived from TARA data, in black men a WC of ≥94 cm and ≥102 cm predicted a BMI of ≥28.4 kg/m2 and ≥31.2 kg/m2, respectively.11 For black women, a WC of 80 cm and 88 cm predicted a BMI of ≥24.6 kg/m2 and ≥27.9 kg/m2, respectively.11 Therefore, there are black–white differences in WC that predict both the overweight and obese categories. The most clinically relevant difference is that a WC of 88 cm predicts obesity in white women, but a WC of 88 cm in black women only predicts the overweight category.
Waist Circumference as a Predictor of Insulin Resistance
The guidelines for central obesity set by the IDF and the NCEP-ATPIII rely solely on the relationship between BMI and WC.14,15 However, BMI may not be the most important correlate of WC. It is possible that the relationship of WC to insulin resistance may have more physiological relevance than the WC, which predicts BMI category. Thus, we examined the relationship between WC and insulin resistance. In the TARA cohort, we found that insulin resistance in black men was best predicted by a WC ≥102 cm, whereas in black women, the WC that optimally predicted insulin resistance was ≥98 cm.11
The waist circumference (WC ≥98 cm) in black women that best predicts insulin resistance is 18 cm higher than the recommendation of the International Diabetes Federation and 10 cm higher than the recommendation of the National Cholesterol Education Program-Adult Treatment Panel III. Raising the WC threshold that is used to diagnose central obesity in black women should be considered.
The WC in black men that best predicts insulin resistance is identical to the NCEP-ATPIII guidelines (≥102 cm), and therefore may be superior to the recommendation of the IDF (≥94 cm). However, the WC (≥98 cm) in black women that best predicts insulin resistance is 18 cm higher than the IDF and 10 cm higher than the NCEP-ATPIII recommendations. Consideration should be given to raising the WC threshold that is used to diagnose central obesity in black women.
Fasting Triglyceride Levels
Fasting TG levels are used in the diagnosis of the metabolic syndrome, the abbreviated metabolic syndrome, and the hypertriglyceridemic waist. Of these syndromes, the metabolic syndrome is the oldest and most well known, but all 3 syndromes are used to predict the future development of CVD and type 2 DM.17–19 To diagnose the metabolic syndrome, 3 of 5 criteria have to be present. Elevated TG (≥150 mg/dL) is one of the possible criteria; thus, hypertriglyceridemia is an optional criterion.20 In contrast, for the diagnosis of the abbreviated metabolic syndrome and the hypertriglyceridemic waist, elevated TG is mandatory18,19 For the abbreviated metabolic syndrome, TG must be ≥150 mg/dL; for the hypertriglyceridemic waist, TG must be ≥177 mg/dL. However, blacks have lower TG levels than do whites (Figure 3).21 Even after adjustment for differences in BMI, blacks still have lower TG levels than do whites (Figure 4).21 Because these syndromes use hypertriglyceridemia as a diagnostic criterion, they may not be effective in identifying blacks at risk for the development of CVD or type 2 DM.
Figure 3.

Mean (SE) triglyceride (TG) concentration by ethnicity. Data from the National Health and Nutrition Examination Survey, 1999–2002.21 *P < 0.001, blacks versus whites and Hispanics.
Figure 4.

Mean (SE) triglyceride (TG) concentration by sex, ethnicity, and body mass index category. Data from the National Health and Nutrition Examination Survey, 1999–2002.21 *P < 0.001 and †P < 0.01, blacks versus whites and Hispanics.
Etiologically, insulin resistance is a key component of all 3 of these syndromes. Owing to the difficulty in measuring insulin resistance, TG levels have been used as a proxy measure of insulin resistance. It has been proposed that either a TG ≥130 mg/dL or a TG to high-density lipoprotein (HDL) ratio ≥3 indicates the presence of insulin resistance.22 However, using the TARA cohort, we found that neither TG nor TG:HDL ratios were predictors of insulin resistance in blacks (Figure 5).10 In addition, using NHANES data, we observed that compared with whites and Hispanics, blacks were more likely to be insulin resistant and have normal TG levels (Figure 6).21 Furthermore, by using the homeostasis model assessment to measure insulin resistance, we noted that the difference in the relationship between TG and insulin resistance was greater between black and white women than between black and white men (Figure 7).21 Therefore, TG thresholds identified as high risk in white women are not likely to optimally describe high-risk black women and vice versa. Our concern is that both CVD and type 2 DM risk may be occurring at lower TG levels in blacks than in whites. Alternatively, TG might not be the ideal risk factor to use to identify blacks at a time when early intervention would be most effective.
Figure 5.
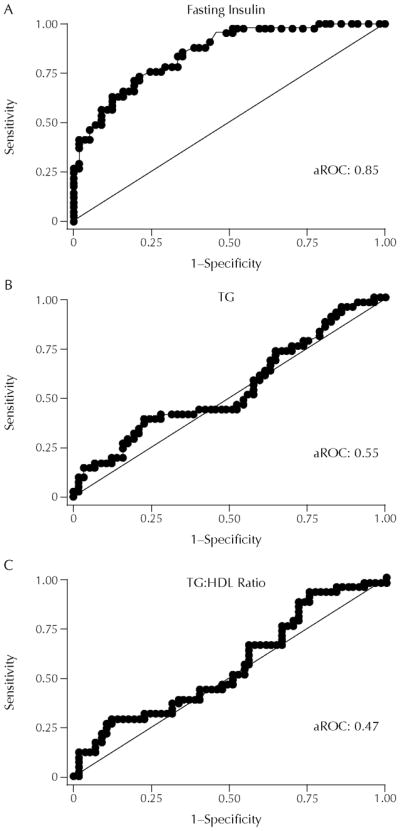
(A) Insulin, (B) triglyceride (TG), and (C) TG to high-density lipoprotein (HDL) ratio as predictors of insulin resistance determined by the area under the receiver operator characteristic curve (aROC). Adapted with permission.10
Figure 6.

By ethnicity, the percent of insulin-resistant individuals with triglyceride (TG) levels below threshold values. Data from the National Health and Nutrition Examination Survey, 1999–2002.21*P < 0.001, blacks versus whites and Hispanics.
Figure 7.
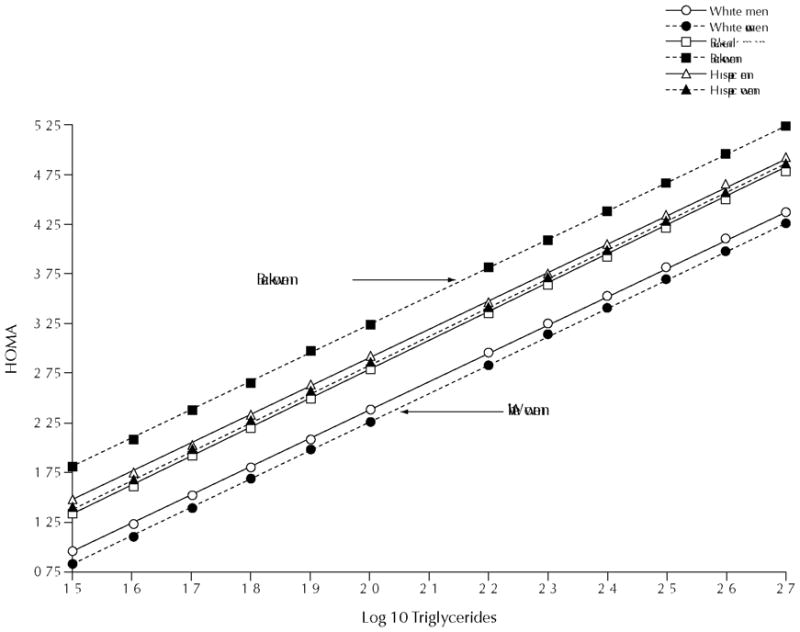
Regression of insulin resistance on triglycerides. Data from the National Health and Nutrition Examination Survey, 1999–2002.21 HOMA = homeostasis model assessment.
It is important to understand why ethnic differences in TG exist. It is well established that in the presence of insulin resistance, there is increased hepatic production and secretion of the TG-rich particles termed very low density lipoproteins (VLDL).13 Lipoprotein lipase (LPL) is the enzyme that clears VLDL particles from the circulation.23 In whites, LPL activity is impaired in the presence of insulin resistance.24 Therefore, in insulin-resistant whites, fasting TG levels are increased because of the combination of increased production and decreased clearance of VLDL.25 We have reported that LPL activity is not impaired in insulin-resistant blacks.26 Thus, one reason why TG levels may be normal in insulin-resistant blacks is that TG clearance is maintained.
CONCLUSIONS
Even as our common humanity unites us worldwide, there are sex and ethnic differences in body fat content, distribution, and metabolism. BMI, WC, and TG levels reflect these differences. As we explore the complex interaction between metabolism, culture, environment, and genetics, knowledge of sex and ethnic differences may lead to the development of more effective paradigms to recognize and prevent CVD and type 2 DM.
Acknowledgments
Dr. Sumner is supported by the intramural research program of the National Institute of Diabetes and Digestive and Kidney Diseases of the National Institutes of Health, Bethesda, Maryland.
Biography
Dr. Anne E. Sumner graduated with a BA in English literature from Brown University. She received her MD from the University of Pennsylvania School of Medicine and her residency training in internal medicine at the Reading Hospital and Medical Center in Reading, Pennsylvania. Dr. Sumner completed two fellowships. Her first fellowship was in nutrition and metabolism at the Hospital of the University of Pennsylvania. Her second fellowship was in endocrinology, diabetes, and metabolism at the Medical College of Pennsylvania. On completion of her endocrine fellowship, she joined the faculty in the Division of Endocrinology at the Medical College of Pennsylvania. Since 1998, Dr. Sumner has been a Clinical Investigator at the National Institute of Diabetes, Digestive and Kidney Diseases. Dr. Sumner has received many honors including the 2007 Herbert W. Nickens Award for Epidemiological Research from the Association of Black Cardiologists and the 2008 Outstanding Investigator Award from the International Society on Hypertension in Blacks. Dr. Sumner is a Fellow of both the American College of Physicians and the American Heart Association.
Footnotes
Based on a presentation to the Georgetown University Center for the Study of Sex Differences in Health, Aging and Disease (CSD), May 1, 2008.
References
- 1.Ingelsson E, Schaefer EJ, Contois JH, et al. Clinical utility of different lipid measures for prediction of coronary heart disease in men and women. JAMA. 2007;298:776–785. doi: 10.1001/jama.298.7.776. [DOI] [PubMed] [Google Scholar]
- 2.Field AE, Coakley EH, Must A, et al. Impact of overweight on the risk of developing common chronic diseases during a 10-year period. Arch Intern Med. 2001;161:1581–1586. doi: 10.1001/archinte.161.13.1581. [DOI] [PubMed] [Google Scholar]
- 3.Executive summary of the clinical guidelines on the identification, evaluation, and treatment of overweight and obesity in adults. Arch Intern Med. 1998;158:1855–1867. doi: 10.1001/archinte.158.17.1855. [DOI] [PubMed] [Google Scholar]
- 4.Stevens J, Cai J, Juhaeri, et al. Evaluation of WHO and NHANES II standards for overweight using mortality rates. J Am Diet Assoc. 2000;100:825–827. doi: 10.1016/s0002-8223(00)00238-8. [DOI] [PubMed] [Google Scholar]
- 5.Stevens J, Juhaeri, Cai J, Jones DW. The effect of decision rules on the choice of a body mass index cutoff for obesity: Examples from African American and white women. Am J Clin Nutr. 2002;75:986–992. doi: 10.1093/ajcn/75.6.986. [DOI] [PubMed] [Google Scholar]
- 6.Fontaine KR, Redden DT, Wang C, et al. Years of life lost due to obesity. JAMA. 2003;289:87–193. doi: 10.1001/jama.289.2.187. [DOI] [PubMed] [Google Scholar]
- 7.Manson JE, Willett WC, Stampfer MJ, et al. Body weight and mortality among women. N Engl J Med. 1995;333:677–685. doi: 10.1056/NEJM199509143331101. [DOI] [PubMed] [Google Scholar]
- 8.Palmer JR, Boggs DA, Krishnan S, et al. Sugar-sweetened beverages and incidence of type 2 diabetes mellitus in African American women. Arch Intern Med. 2008;168:1487–1492. doi: 10.1001/archinte.168.14.1487. [DOI] [PMC free article] [PubMed] [Google Scholar]
- 9.Sempos CT, Bild DE, Manolio TA. Overview of the Jackson Heart Study: A study of cardiovascular diseases in African American men and women. Am J Med Sci. 1999;317:142–146. doi: 10.1097/00000441-199903000-00002. [DOI] [PubMed] [Google Scholar]
- 10.Sumner AE, Finley KB, Cenovese DJ, et al. Fasting triglyceride and the triglyceride-HDL cholesterol ratio are not markers of insulin resistance in African Americans. Arch Intern Med. 2005;165:1395–1400. doi: 10.1001/archinte.165.12.1395. [DOI] [PubMed] [Google Scholar]
- 11.Sumner AE, Sen S, Ricks M, et al. Determining the waist circumference in African Americans which best predicts insulin resistance. Obesity. 2008;16:841–846. doi: 10.1038/oby.2008.11. [DOI] [PubMed] [Google Scholar]
- 12.Sumner AE, Ricks M, Sen S, Frempong BA. How current guidelines for obesity underestimate risk in certain ethnicities and overestimate risk in others. Curr Cardiovasc Risk Rep. 2007;1:97–101. [Google Scholar]
- 13.Despres JP, Lemieux I. Abdominal obesity and metabolic syndrome. Nature. 2006;444:881–887. doi: 10.1038/nature05488. [DOI] [PubMed] [Google Scholar]
- 14.Alberti KG, Zimmet P, Shaw J. The metabolic syndrome—a new worldwide definition. Lancet. 2005;366:1059–1062. doi: 10.1016/S0140-6736(05)67402-8. for the IDF Epidemiology Task Force Consensus Croup. [DOI] [PubMed] [Google Scholar]
- 15.Expert Panel on Detection, Evaluation, and Treatment of High Blood Cholesterol in Adults. Executive summary of the third report of the National Cholesterol Education Program (NCEP) Expert Panel on Detection, Evaluation, and Treatment of High Blood Cholesterol in Adults (Adult Treatment Panel III) JAMA. 2001;285:2486–2497. doi: 10.1001/jama.285.19.2486. [DOI] [PubMed] [Google Scholar]
- 16.Lean MEJ, Han TS, Morrison CE. Waist circumference as a measure for indicating need for weight management. BMJ. 1995;311:158–161. doi: 10.1136/bmj.311.6998.158. [DOI] [PMC free article] [PubMed] [Google Scholar]
- 17.Grundy SM. Does a diagnosis of metabolic syndrome have value in clinical practice? Am J Clin Nutr. 2006;83:1248–1251. doi: 10.1093/ajcn/83.6.1248. [DOI] [PubMed] [Google Scholar]
- 18.Meigs JB, Williams K, Sullivan LM, et al. Using metabolic syndrome traits for efficient detection of impaired glucose tolerance. Diabetes Care. 2004;27:1417–1426. doi: 10.2337/diacare.27.6.1417. [DOI] [PubMed] [Google Scholar]
- 19.St-Pierre J, Lemieux I, Perron P, et al. Relation of the “hypertriglyceridemic waist” phenotype to earlier manifestations of coronary artery disease in patients with glucose intolerance and type 2 diabetes mellitus. Am J Cardiol. 2007;99:369–373. doi: 10.1016/j.amjcard.2006.08.041. [DOI] [PubMed] [Google Scholar]
- 20.Grundy SM, Cleeman JI, Daniels SR, et al. Diagnosis and management of the metabolic syndrome: An American Heart Association/National Heart, Lung, and Blood Institute scientific statement. Curr Opin Cardiol. 2006;21:1–6. doi: 10.1097/01.hco.0000200416.65370.a0. [DOI] [PubMed] [Google Scholar]
- 21.Sumner AE, Cowie CC. Ethnic differences in the ability of triglyceride levels to identify insulin resistance. Atherosclerosis. 2008;196:696–703. doi: 10.1016/j.atherosclerosis.2006.12.018. [DOI] [PubMed] [Google Scholar]
- 22.McLaughlin T, Abbasi F, Cheal K, et al. Use of metabolic markers to identify overweight individuals who are insulin resistant. Ann Intern Med. 2003;139:802–809. doi: 10.7326/0003-4819-139-10-200311180-00007. [DOI] [PubMed] [Google Scholar]
- 23.Eckel RH. Lipoprotein lipase. A multifunctional enzyme relevant to common metabolic diseases. N Engl J Med. 1989;320:1060–1068. doi: 10.1056/NEJM198904203201607. [DOI] [PubMed] [Google Scholar]
- 24.Maheux P, Azhar S, Kern PA, et al. Relationship between insulin-mediated glucose disposal and regulation of plasma and adipose tissue lipoprotein lipase. Diabetologia. 1997;40:850–858. doi: 10.1007/s001250050759. [DOI] [PubMed] [Google Scholar]
- 25.Adiels M, Olofsson SO, Taskinen MR, Boren J. Overproduction of very low-density lipoproteins is the hallmark of the dsylipidemia in the metabolic syndrome. Arterioscler Thromb Vasc Biol. 2008;28:1225–1236. doi: 10.1161/ATVBAHA.107.160192. [DOI] [PubMed] [Google Scholar]
- 26.Sumner AE, Vega GL, Genovese DJ, et al. Normal triglyceride levels despite insulin resistance in African Americans: Role of lipoprotein lipase. Metabolism. 2005;54:902–909. doi: 10.1016/j.metabol.2005.03.001. [DOI] [PubMed] [Google Scholar]