Abstract
We test the robustness of a closed-loop treatment scheduling method to realistic HIV viral load measurement error. The purpose of the algorithm is to allow the accurate detection of an induced viral load minimum with a reduced number of samples. Therapy must be switched at or near the viral-load minimum to achieve optimal therapeutic benefit; therapeutic benefit decreases logarithmically with increased viral load at the switching time. The performance of the algorithm is characterized using a number of metrics. These include the number of samples saved vs. fixed-rate sampling, the risk-reduction achieved vs. the risk-reduction possible with frequent sampling, and the difference between the switching time vs. the theoretical optimal switching time. The algorithm is applied to simulated patient data generated from a family of data-driven patient models and corrupted by experimentally confirmed levels of log-normal noise.
I. INTRODUCTION
The Human Immunodeficiency Virus (HIV) is a retrovirus which infects CD4+ T helper cells. If the infection is untreated, the eventual result is chronic immunodeficiency. HIV replication is highly error-prone, and treatment with a single antiviral drug quickly leads to drug resistance. To overcome this problem Highly Active Anti-Retroviral Therapy (HAART) uses three antiviral drugs simultaneously to control HIV replication and increase the mutational barrier, decreasing the likelihood of drug resistance emergence. While this has been very successful, virological failure still occurs in 30–50% of patients starting any given antiviral regimen [1]. This failure necessitates a change in antiviral regimen.
Our previous work has demonstrated the possibility of reducing the likelihood of a second failure following the change in antiviral regimen. These methods employ either timed treatment interruptions or permuted antiviral regimens in order to induce a transient drop in the viral load. By switching to the new therapy at the minimum of this drop, we can reduce the magnitude of the failure risk due to pre-existing resistance by an order of magnitude [2], [3], [4].
In order to implement this method, it is necessary to have a method of determining the minimum viral load time. The viral dynamic parameters vary widely from patient to patient, so a priori estimation will not work. Frequent sampling of the viral load, weekly or twice-weekly, is sufficient to find the viral load minimum within an acceptable margin. However, sampling the viral load is expensive and invasive, motivating the development of a method yielding acceptable performance in finding the minimum that uses the fewest possible number of viral load measurements.
In previous papers we proposed a closed-loop sampling algorithm using recursive parameter estimation for a reduced-order viral load model which showed a 50% reduction in the number of required samples with no degradation in performance compared to fixed sampling on a 3-day interval [5], [6]. However, this previous analysis used a normally-distributed noise model with a standard deviation of 5% of the nominal measurement, and tested the performance only against a single nominal patient model. In this paper, we introduce a realistic model of viral-load measurement uncertainty, and use a recently developed library of patient models identified from experimental data to test the algorithms robustness to both measurement noise and model uncertainty using a Monte-Carlo approach.
II. REGIMEN SWITCHING
A. Competition Model
The virus dynamics among target cells, infected cells and free HIV virions during HAART, when only one previous therapy has failed, are described in the ordinary differential equations system presented in [1]:
| (1) |
This model describes the dynamics of infection for two strains of the virus, one of which is partially resistant to HAART. A simple description of reservoir dynamics is also included. This model’s states are defined as x, the CD4+ T cells that are susceptible to infection (target cells); yw, CD4+ T cells infected by wild-type virus vw; and yr, the CD4+ T cells infected by resistant virus vr.
The parameters are λ, the generation rate of the target cells; d, the natural death rate of target cells; βw and βr, the infection rates of wild-type and resistant virus respectively; aw and ar, the death rates of cells infected by wild-type and resistant-type virus respectively; λw and λr, the activation rate of long-lived quiescent infected cells for two virus types; u1 and u2 represent the application of two separate antiviral regimens; kw and kr, the number of viral particles emitted per cell infected by wild-type and resistant-type virus respectively (burst sizes). The values of u1, u2, may be applied between 0 and 1. Because of the excessive toxicity, we do not apply the both regimens at the same time.
The intervention proposed in [1], [2], [3], [4] involves switching from a failing regimen (u1(t ) = 1, u2(t ) = 0) to a successful regimen (u1(t ) = 0, u2(t ) = 1) in such a manner as to minimize the risk of a third strain virus emerging, resistant to the new antiviral regimen u2. The algorithm of this intervention is summarized in the next section.
B. Switching Strategy
The switching strategy proposed in [1], [2], [3], [4] consists in obtaining a drug application schedule in order to generate a total virus load decrease prior to introducing a new regimen to replace a failing regimen. In the case where only a single regimen has failed, this can only be accomplished through a schedule of treatment interruptions using the failing regimen. Specifically, based in interruptions, the strategy has the following steps:
Interrupt the failed therapy.
Then, when the virus load has reached a steady state, the failed regimen is reintroduced.
The reintroduction yields a decrease in the total virus load until the population of resistant virus is greater than the population of the wild type virus, hence, the total virus is at a minimum when the wild and resistant virus populations are equal; at this time we introduce the new antiviral regimen.
This can be implemented by sampling frequently on a fixed schedule; however, the time to minimum following reintroduction can vary from weeks to months, so the potential number of expensive and invasive measurements can be quite large. To find the minimal viral load time using the minimal number of samples, we propose to use a closed loop sampling algorithm which recursively estimates the minimum time, and uses these estimates to plan the next sample time. This sampling algorithm will be described in the next section.
III. CLOSED-LOOP VIRAL LOAD SAMPLING
A. Problem Definition
Equation 1 describes the HIV dynamics well across many different treatment conditions, but it is a nonlinear differential equation with 12 parameters and 5 states, which would require at least 17 measurements to begin system identification. Since the treatment schedule prior to implementing our closed-loop sampling algorithm always initiates the same basic behavior in the viral load (approximately exponential decay followed by approximately exponential rebound), we can use an approximation of the solution to the model described in 1 for the total virus load vw(t ) + vr(t ) after the failed regimen has been reintroduced given by the function:
| (2) |
where Θ = (vw(t0), γw, γr) are the parameters to be estimated (vr(t0) is omitted because v(t0, Θ) = vw(t0) + vr(t0) and v(t0, Θ) is known).
Thus, taking into account all the above, given:
a set of few samples of the viral load v̂ = v̂1, v̂2,…, v̂m with m small,
the time of each samples t̂ = t̂1,t̂2,…,t̂m,
an Objective Function f {v̂,v(t̂, Θ)} which defines the distance between the samples v̂ and the approximation solution v(t, Θ) in t = t̂,
and an approximation function of the viral load v(t, Θ),
the problem is design one algorithm to find the parameters Θ = vw(t0), γw, γr) such that,
| (3) |
subject to
| (4) |
using the minimum number m of samples (t̂i,t̂i). In this case the Nonlinear Least squares approach is used to define f {v̂,v(t̂i, Θ)} as
| (5) |
And the iterative simulated annealing stochastic method built in MATLAB is used to find Θ̂
B. Algorithm
Achieving a minimal number of samples require a closed-loop method [2], where for an initial value of m (i.e. m = 3), the parameters Θ are estimated and a time for the next sample between Tmin and Tmax, the minimal and maximal distance (days) of the last sample is calculated. To determine this time, the minimum of the v(t, Θ) curve is calculated. This step is repeated J times with a proportional gaussian random noise added to the sampled data from the model v̂(t̂i), with standard deviation equal to 5% of the nominal value. For each repetition j the minimal viral load time t j = arg min v(t ,Θ̂) j is calculated, and the earliest case tmin = inf j ∈J j is chosen as the time to take the next sample (See algorithm III-B).
The Algorithm is described below, using parameters defined in the table I. The algorithm terminates when it predicts that the minimum time is less that tmin in the future. (See algorithm III-B).
TABLE I.
Variables Definition
| Tmin | minimal sample interval distance |
| Tmax | maximal sample interval distance |
| (t̂i, v̂i) | the ith pair of measurements from the set of samples of the viral load (i = 1…m) |
| ts | time of the last sample |
| t0 | time of the reintroduction of the failed regimen |
| v(t, Θ) | an approximation of the viral load |
| tmin | time of the minimal viral load in the approximation v(t, Θ) |
Robustness to HIV RNA PCR Variance
We test the robustness of the algorithm described above to measurement noise. The variance which is common in standard Polymerase Chain Reaction HIV RNA quantification is log-normal, with a standard deviation for large samples of approximately ±0.07 log [7]. This measurement noise gets proportionally larger for smaller viral loads. In our simulated patient model, we corrupt the measurements using this noise model.
C. Monte-Carlo Testing
The experimental data is simulated by the model 1 using a set of 400.000 parameter values estimated by Bayesian techniques [8] from patient viral load data from two different patients[9]. The sets of parameter values reflect the natural uncertainty in the model parameters due to measurement noise, and the parameters from different patients represent the expected interpatient variation.
The algorithm is tested in a Monte-Carlo fashion by randomly choosing a parameter set from the 400,000 parameter sets described above and randomly varying the initial conditions for vw and vr. The differential equation of Equation 1 is then used to generate our simulated patient viral load measurements, which are corrupted in a log-normal fashion.
D. Experimental Protocol
In order to evaluate the robustness of the algorithm we repeat the following steps 300 times:
We generate the viral load data according to a randomly selected parameter set.
We add gaussian noise to the viral load data in a log10 scale with a standard deviation equal to 0.1 (also in a log10 scale).
For each row we run the closed loop algorithm to evaluate the minimal sampling algorithms performance.
We compute the number of samples needed for the algorithm to find the minimal time.
E. Results
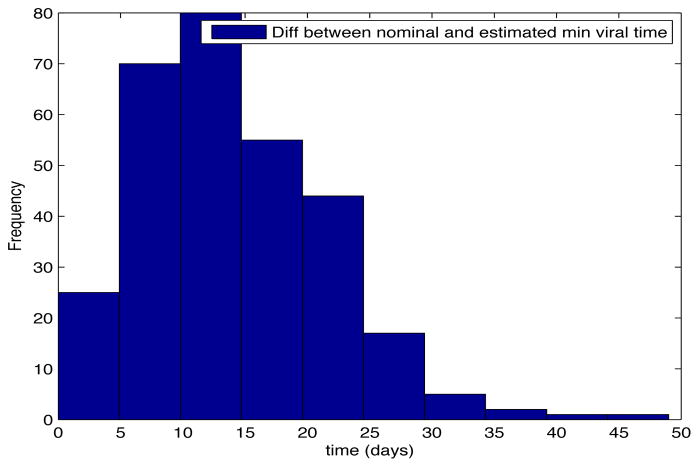
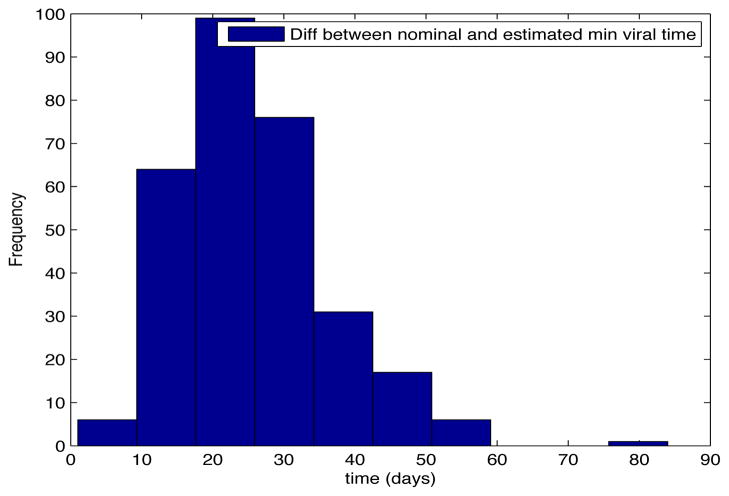
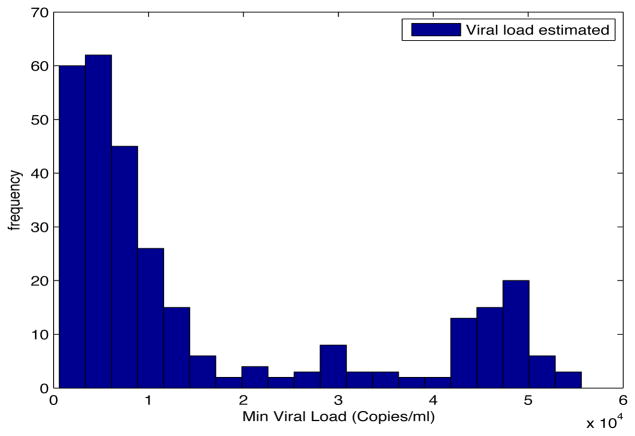
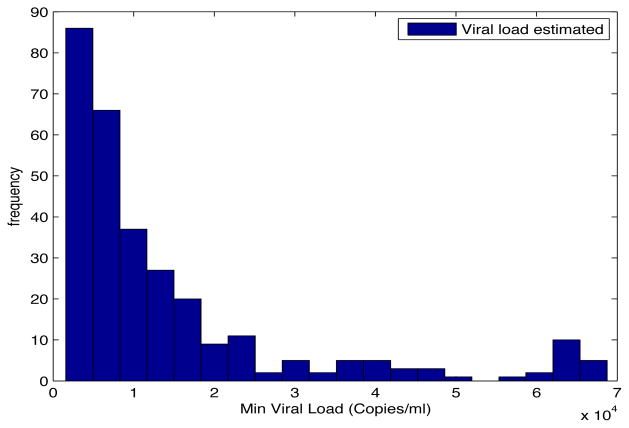
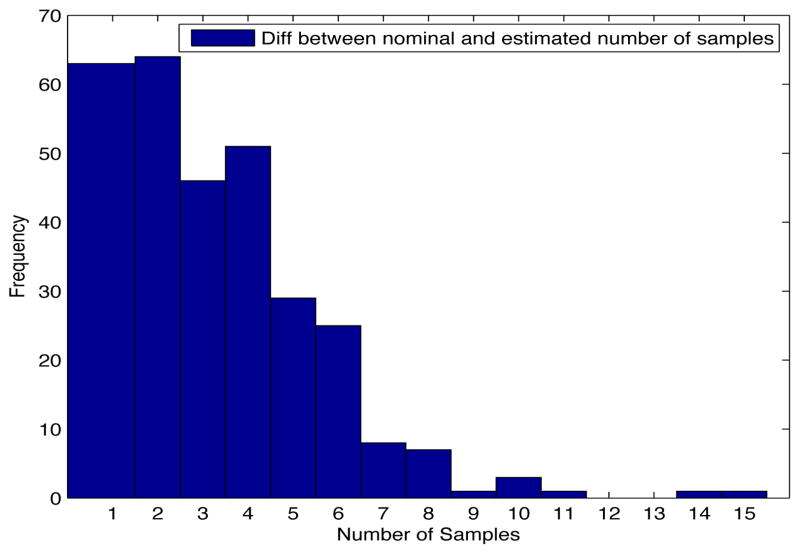
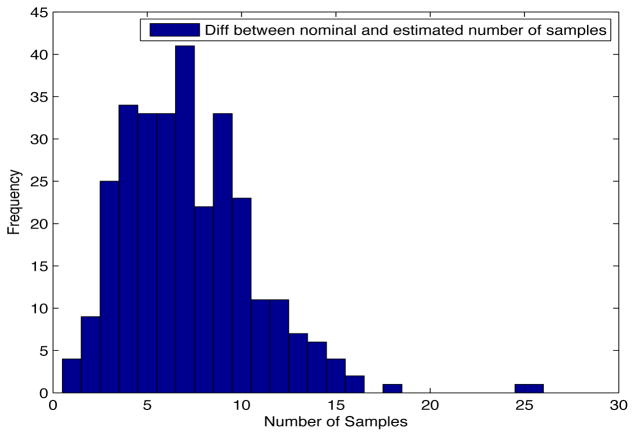
Despite the noise applied to the data, the minimum time estimated (see figures 1 and 2) is, for the most of the cases, ten days and two weeks early to the actual minimum time. The viral load at the time of switching is as close as 1000 copies/ml shown in figures 5 and 6. The number of samples saved compared to a frequent sampling method is shown in figures 3 and 4.
Fig. 1. Histogram Error Time.
Patient Parameter Set 1
Fig. 2. Histogram Error Time.
Patient Parameter Set 2
Fig. 5. Histogram Estimated Viral Load.
Patient Parameter Set 1
Fig. 6. Histogram Estimated Viral Load.
Patient Parameter Set 2
Fig. 3. Histogram diff number of samples.
Patient Parameter Set 1
Fig. 4. Histogram diff number of samples.
Patient Parameter Set 2
IV. CONCLUSIONS
In this paper we have implemented a Monte-Carlo approach to testing the robustness of a closed-loop sampling algorithm for HIV. The algorithm is designed to find the minimum of an induced transient crash in the viral load using a reduced number of samples. We generated viral load measurement data using randomly selected patient models from a table of models previously estimated from clinical data. We corrupted the data according to the observed log-normal variance of HIV PCR measurements.
The increased level of variation in this paper reduced the performance of algorithm compared with previously reported measurements. The average achieved risks are better than those obtained by relying on an open-loop estimate of the minimum time, but they are not sufficient for implementation. Our future work is focusing on improving this robust performance by modifying the internal variance model in the algorithm and improving the stop criterion. This should allow us to achieve better performance in real world conditions.
Algorithm 1.
Closed-Loop Sampling General Algorithm
| input : A set of samples (t̂i, v̂i) with (i = 1…3) |
| output: tmin, A number of samples m (with m ≥ 3) |
| repeat |
| find tmin = in f j ∈ J j; |
| if tmin − ts > Tmax then |
| ts = ts + Tmax; |
| else |
| if tmin − ts < Tmin then |
| ts = ts + Tmin; |
| else |
| ts = tmin; |
| end |
| end |
| Take a new sample at time ts; |
| until tmin > ts; |
Acknowledgments
The project described was supported by Award Number R21AI078842 from the National Institute Of Allergy And Infectious Diseases.
Contributor Information
E. Fabian Cardozo, Email: fabianc@udel.edu, Electrical and Computer Engineering, University of Delaware, Newark, DE 19716, USA.
Ryan Zurakowski, Email: sryanz@udel.edu, Electrical and Computer Engineering, University of Delaware, Newark, DE 19716, USA.
References
- 1.Luo R, Cannon L, Hernandez J, Piovoso MJ, Zurakowski R. Controlling the evolution of resistance. Journal of Process Control. 2011;21(3):367– 378. doi: 10.1016/j.jprocont.2010.11.010. [Online]. Available: http://www.sciencedirect.com/science/article/B6V4N-51PH81K-1/2/f3bebc3b84b714bae5f1477b2defd1d0. [DOI] [PMC free article] [PubMed] [Google Scholar]
- 2.Luo R, Piovoso MJ, Zurakowski R. A generalized multi-strain model of hiv evolution with implications for drug-resistance management. Proc Am Control Conf. 2009:2295–2300. [Google Scholar]
- 3.Luo R, Zurakowski R. A new strategy to decrease risk of resistance emerging during therapy switching in hiv treatment. Proc Am Control Conf. 2008:2112–2117. [Google Scholar]
- 4.Zurakowski R, Wodarz D. Treatment interruptions to decrease risk of resistance emerging during therapy switching in hiv treatment. Proc IEEE Conf. on Decision and Control. 2007:5174–5179. [Google Scholar]
- 5.Rosero-Garcia E, Zurakowski R. Closed-loop minimal sampling method for determining viral-load minima during switching. Proc Am Control Conf. 2010:460–461. doi: 10.1109/acc.2010.5530993. [DOI] [PMC free article] [PubMed] [Google Scholar]
- 6.Zurakowski R, Churgin M, Perez C, Rodriguez M. Approximate-model closed-loop minimal sampling method for HIV viral-load minima detection. Proc Am Control Conf; 2011. pp. 5418–5419. [DOI] [PMC free article] [PubMed] [Google Scholar]
- 7.Perrin L, Pawlotsky JM, Bouvier-Alias M, Sarrazin C, Zeuzem S, Colucci G. Multicenter performance evaluation of a new TaqMan PCR assay for monitoring human immunodeficiency virus RNA load. Journal of clinical microbiology. 2006 Dec;44(12):4371–4375. doi: 10.1128/JCM.00505-06. [DOI] [PMC free article] [PubMed] [Google Scholar]
- 8.Luo R, Piovoso MJ, Martinez-Picado J, Zurakowski R. HIV model parameter estimates from interruption trial data including drug efficacy and reservoir dynamics. PLoS One. 2012;7(7):e40198. doi: 10.1371/journal.pone.0040198. Epub 2012 Jul 16. [DOI] [PMC free article] [PubMed] [Google Scholar]
- 9.Ruiz L, Carcelain G, Martínez-Picado J, Frost S, Marfil S, Paredes R, Romeu J, Ferrer E, Morales-Lopetegi K, Autran B, Clotet B. HIV dynamics and T-cell immunity after three structured treatment interruptions in chronic HIV-1 infection. AIDS. 2001 Jun;15(9):F19–27. doi: 10.1097/00002030-200106150-00001. [DOI] [PubMed] [Google Scholar]


