Abstract
Aim
Anthropometry is an art and science used extensively for measuring the soft tissue proportions. While it is true that error is found in measurements of this kind, a great many trends of growth and development and therapy changes can be recorded with a significant degree of accuracy.
Objective
Facial proportion varies among the different ethnic groups and today, most of the available studies are done on western population. Hence an Anthropometric study was conducted in the local population.
Materials and Methods
The study was carried out with the aim of measuring the facial soft tissue proportion in the local population using anthropometry. Study was done using 100 subjects (50 males and 50 females) with Class I skeletal relationship and pleasing profile. Using standard anthropometric landmarks the various anthropometric measurements and facial proportional indices were determined (both horizontal and vertical) and were compared with that for North American Caucasians.
Results
The statistical analysis revealed significant differences in the facial proportion between the two populations.
Keywords: Facial proportions, Anthropometrics, Population study
Introduction
The concept of beauty has been periodically changing through ages and will continue to do so for the rest of the tenure of the human beings on earth. Eventhough tastes, fashion and standards of beauty change from time to time, there appears to be certain facial proportion and relationships that provide a basis for the diagnosis and planning for the improvement of facial form. A face is beautiful and shows harmonious features if the individual components are proportional. This is what is referred to as facial balance. A pleasant and harmonious face can be a great asset to ones social status and hence a therapist is held liable to shoulder the full responsibility of the overt alteration, desirable or undesirable, that may be produced because of aesthetic surgery. The term aesthetic maxillofacial surgery can be defined as a surgical practice that includes comprehensive evaluation, diagnosis and surgical treatment of the skeletal and soft tissue disharmonies of the maxillofacial region, in terms of beauty which provides happiness symbolized by beauty, morphologically and functionally.
Since it is impossible to quantify and attribute beauty, various linear and angular measurements for measuring facial proportions were thought of. Once the cephalometrics came into existence, more importance was given for the hard tissue relationship, and their correction. But soon it was realized that the correction of hard tissue alone does not bring about the desired results in many occasions. Soft tissue plays a major role in determining the final outcome of facial aesthetic surgical procedures [7].
Anthropometry is an art and science used extensively for measuring the soft tissue proportions. While it is true that error is found in measurements of this kind, a great many trends of growth & development and therapy changes can be recorded with a significant degree of accuracy [1]. It has been shown that the reproducibility of rating of facial aesthetics is good and also opinions between panels were almost similar [2].
Facial proportion varies among the different ethnic groups and today, most of the available studies are done on western population. Hence an anthropometric study was conducted in the local population with the following aims and objective
To study the facial proportions of the local population
To establish the norms for facial aesthetics for the population
To correlate the findings with clinical application.
To compare the anthropometric measurements and facial proportions of the local population with that of the North American Caucasians.
Materials and Methods
The study was conducted using 100 adult subjects both male and female belonging to the age group of 18–25 years.
Criteria far selection of subjects
Pleasing profile with competent lips.
No history of prior surgical or orthodontic treatment.
Class I occlusion with near normal dental arches.
Normal overjet and overbite.
Devoid of any obvious defect or deformity.
Subjects originally belonging to local area.
A total of 100 subjects (50 males and 50 females) with skeletal class I relationship were selected for the study.
Cephalometric Analysis
Lateral cephalogram was traced and the following measurements were made to determine the skletel relationships. All the measurements were made up to 0.5 degree and 0.5 mm accuracy. ∠SNA, ∠SNB, ∠ANB, Witt’s appraisal were determined. Subjects with class 1 skeletal relationship selected.
Anthropometric Measurements
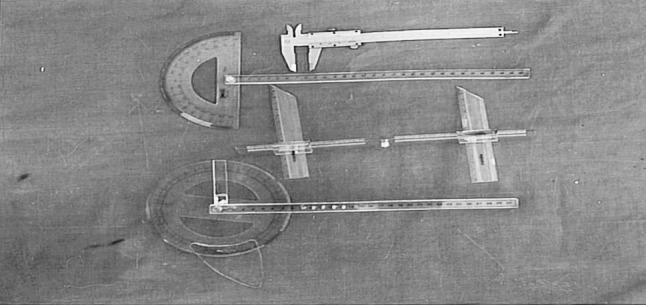
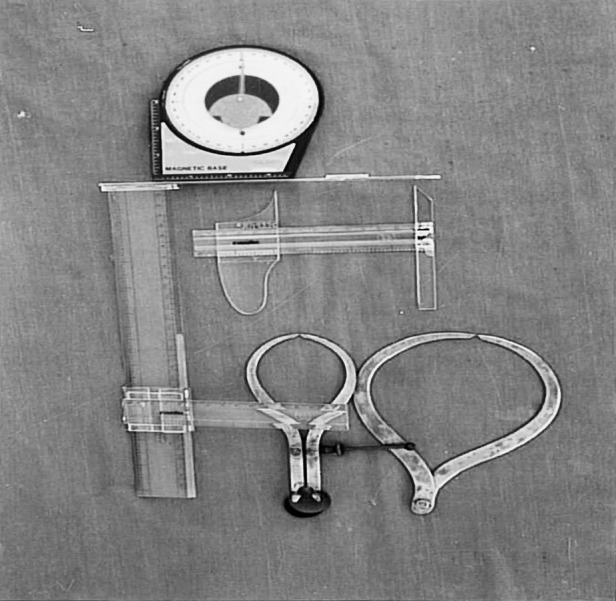
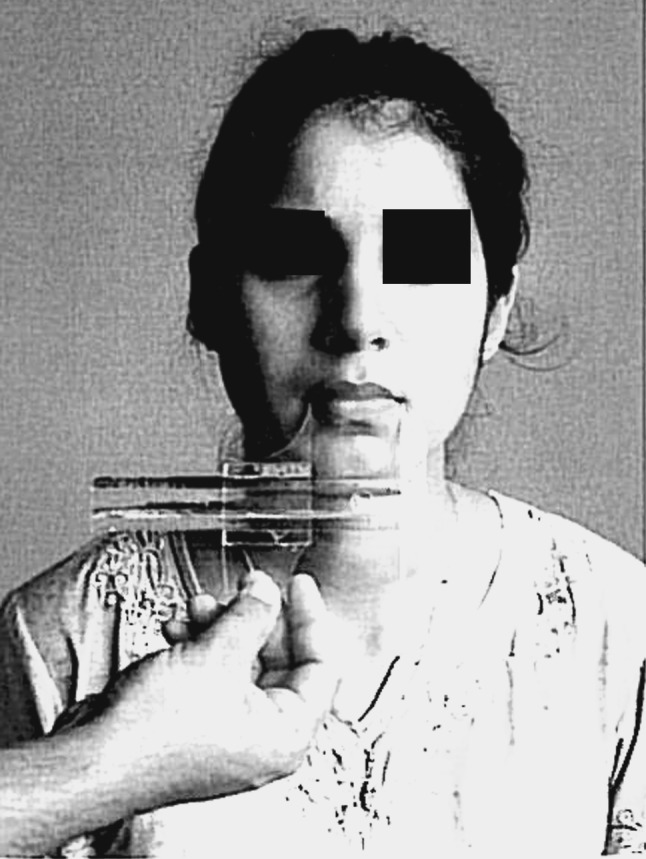
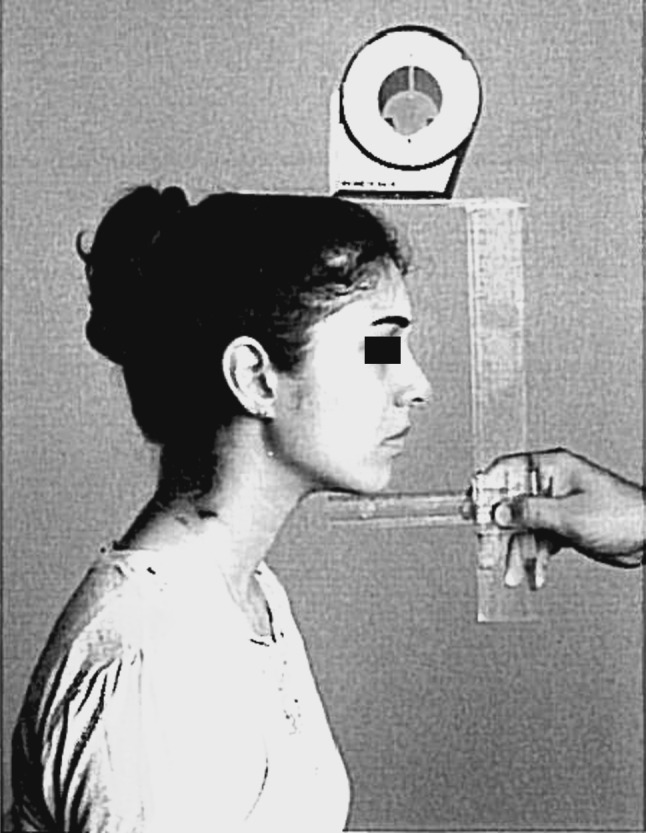
Direct anthropometric measurements were made keeping the head position parallel to the ground using magnetic level finder. Subjects were asked to sit in an upright relaxed position and made to look at a distant object Measurements were performed according to classical methods of physical anthropology using standard instruments (Figs. 1, 2) described by Farkas L. G. Facial proportions were determined, which were clinically significant (Figs. 3, 4).
Fig. 1.

Standard instruments used for measuring width of the mouth, lip, length of the nose and naso-labial angle
Fig. 2.

Standard instruments used for measuring height of the face, width of the head and mandibular arc
Fig. 3.

Sample measurement of width of the mouth
Fig. 4.

Sample measurement of height of the face
Various anthropometric landmarks used in the study:
Eurion (eu): most prominent lateral point on each side of the skull in the area of the parietal and temporal bones.
Zygion (zy): most lateral point of the zygomatic arch and is identified by trial measurement, not by anatomical relationship. It is identical to the bony zygion of the malar bones.
Gonion (go): most lateral point on the mandibular angle close to the bony gonion. It is identified by palpation. If the angle is flat or if there is rich soft tissue cover, determination of this point is very difficult.
Endocanthion (en): point at the inner commissure of the eye fissure. This soft endocanthion is located lateral to the bony landmark that is used in cephalometry.
Exocanthion (ex): point at the outer cornmissure of the eye fissure. The soft exocantion is slightly medial to the bony exocanthion.
Alare (al): most lateral point on each alar contour.
chelion (ch): point located at each labial commissure.
Tragion (t): notch on the upper margin of the tragus.
Stomion (sto): imaginary point at the crossing of the vertical facial midline and horizontal labial fissure between gently closed lips, with teeth shut in the natural position.
Nasion (n): point in the midline of the nasal root and the nasofrontal suture.The slight ridge on which it is situated is felt by the observer’s fingernail. This point is always above the line that connects the inner canthi. The soft nasion and the bony nasion are identical.
Subnasale (sn): mid point of the columella base at the apex of the angle where the lower border of the nasal septum and the upper lip meet. This point is not identical to the bony subnasion, or nasospinale (ns), which is the midpoint of the anterior margin of the apertura pyriformis at the base of the spina nasalis anterior.
Gnathion (gn): lowest median landmark on the lower border of the mandible which is identified by palpation and is identical to the bony gnathion.
Labiale superius (Is): mid point of upper vermilion line.
Labiale inferius (li): mid point of lower vermilion line.
Individual charts were made for each subject. The obtained data were statistically analyzed using “t” test and the following observations and results were drawn (Tables 1, 2, 3, 4).
Table 1.
Mean and standard deviation of anthropometric measurements for local and North American Caucasian population (male)
| Variable | Local population | North American Caucasians | T | P | ||
|---|---|---|---|---|---|---|
| Mean | Standard deviation | Mean | Standard deviation | |||
| Width of head | 151.32 | 7.40 | 151.1 | 5.8 | 0.166 | >0.05 |
| Width of face | 118.62 | 8.91 | 137.1 | 4.3 | 13.21 | <0.001 |
| Width of lower face | 115.72 | 8.51 | 97.1 | 5.8 | 11.578 | <0.001 |
| Inter ocular diameter | 33.16 | 2.71 | 32.9 | 2.7 | 0.53 | >0.05 |
| Binocular diameter | 101.10 | 8.61 | 89.4 | 3.6 | 16.47 | <0.001 |
| Width of nose | 37.00 | 2.75 | 34.7 | 2.6 | 4.291 | <0.001 |
| Width of mouth | 50.14 | 4.55 | 53.3 | 3.3 | 3.709 | <0.001 |
| Maxillary arc | 256.86 | 8.44 | 279.3 | 10.8 | 11.911 | <0.001 |
| Mandibular arc | 284.04 | 10.03 | 304.1 | 13.2 | 10.756 | <0.001 |
| Morphological height of face | 119.98 | 7.49 | 121.3 | 6.8 | 0.923 | >0.05 |
| Physiognomical height of upper face | 78.40 | 8.93 | 74.0 | 4.2 | 3.153 | <0.01 |
| Height of lower face | 54.54 | 11.24 | 71.9 | 6.0 | 9.634 | 0.00 |
| Length of nose | 56.82 | 3.81 | 53.0 | 3.5 | 5.221 | 0.00 |
| Medial Vertical upper lip length | 22.63 | 4.10 | 21.8 | 2.0 | 1.261 | >0.05 |
| Medial Vermilion height of upper lip | 8.31 | 3.81 | 8.9 | 1.5 | 0.065 | >0.05 |
| Medial vermilion height of lower lip | 11.27 | 2.09 | 10.4 | 1.9 | 2.08 | <0.05 |
| Naso-labial angle | 99.04 | 7.82 | 98.9 | 8 | 0.089 | >0.05 |
Table 2.
Mean and standard deviation of anthropometric measurements for local and North American Caucasian population (female)
| Variable | Local population | North American Caucasians | T | P | ||
|---|---|---|---|---|---|---|
| Mean | Standard deviation | Mean | Standard deviation | |||
| Width of head | 152.68 | 5.79 | 144.4 | 144.4 | 7.923 | <0.001 |
| Width of face | 112.38 | 9.06 | 129.9 | 5.3 | 11.35 | <0.001 |
| Width of lower face | 113.84 | 8.62 | 91.1 | 5.9 | 15.396 | <0.001 |
| Inter ocular diameter | 32.08 | 3.23 | 31.6 | 2.4 | 0.85 | >0.05 |
| Binocular diameter | 99.12 | 13.33 | 86.8 | 4.0 | 6.26 | <0.001 |
| Width of nose | 37.98 | 3.44 | 31.4 | 1.9 | 11.84 | <0.001 |
| Width of mouth | 49.44 | 4.96 | 49.8 | 3.2 | 0.432 | >0.05 |
| Maxillary arc | 256.70 | 22.96 | 267.5 | 11.3 | 8.542 | <0.001 |
| Mandibular arc | 272.16 | 10.63 | 284.7 | 11.3 | 6.157 | <0.001 |
| Morphological height of face | 119.95 | 7.47 | 111.8 | 5.2 | 6.255 | <0.001 |
| Physiognomical height of upper face | 80.72 | 5.80 | 68.1 | 3.4 | 11.312 | <0.001 |
| Height of lower face | 59.12 | 6.79 | 65.5 | 4.5 | 15.38 | <0.001 |
| Length of nose | 58.58 | 5.31 | 48.9 | 2.6 | 8.357 | <0.001 |
| Medial Vertical upper lip length | 22.92 | 2.75 | 19.6 | 2.4 | 1.357 | >0.05 |
| Medial Vermilion height of upper lip | 7.80 | 2.21 | 3.4 | 1.3 | 1.655 | >0.05 |
| Medial vermilion height of lower lip | 12.14 | 1.69 | 9.7 | 1.6 | 2.481 | <0.05 |
| Naso-labial angle | 102.66 | 8.60 | 99.1 | 8.7 | 1.12 | >0.05 |
Table 3.
Mean and standard deviation of facial indices for local population and North American Caucasian population (male)
| Variable | Local population | North American Caucasians | ||
|---|---|---|---|---|
| Mean | Standard deviation | Mean | Standard deviation | |
| Facial | 101.59 | 8.38 | 88.5 | 5.1 |
| Mandible face width | 98.17 | 10.72 | 70.8 | 3.8 |
| Upper face | 66.52 | 8.68 | 54.0 | 3.1 |
| Mandible width face height | 96.74 | 8.58 | 80.3 | 6.8 |
| Mouth-face width | 42.47 | 4.60 | 38.9 | 2.5 |
| Lower face height | 45.58 | 9.69 | 59.2 | 2.7 |
| Inter canthal | 32.95 | 2.63 | 36.8 | 1.8 |
| Intercanthal nasal width | 90.0 | 7.83 | 94.8 | 6.8 |
| Nasal index | 65.39 | 6.41 | 65.5 | 4.9 |
| Nose face height | 47.52 | 4.00 | 43.7 | 2.5 |
| Upperlip height mouth width | 45.50 | 9.56 | 40.9 | 3.9 |
| Mouth- face width | 42.47 | 4.60 | 38.9 | 3.2 |
| Upperlip-nose height | 40.06 | 8.56 | 41.1 | 3.1 |
Table 4.
Mean and standard deviation of facial indices for local population and North American Caucasian population (female)
| Variable | Local population | North American Caucasians | ||
|---|---|---|---|---|
| Mean | Standard deviation | Mean | Standard deviation | |
| Facial | 107.41 | 10.90 | 86.2 | 4.6 |
| Mandible face width | 101.78 | 9.23 | 70.1 | 4.2 |
| Upper face | 72.38 | 8.70 | 52.4 | 3.1 |
| Mandible width face height | 95.17 | 8.19 | 81.7 | 6.0 |
| Mouth-face width | 44.13 | 4.40 | 38.4 | 2.5 |
| Lower face height | 49.29 | 5.41 | 58.6 | 2.9 |
| Inter canthal | 33.93 | 14.56 | 36.4 | 1.5 |
| Intercanthal nasal width | 84.98 | 10.45 | 102.9 | 1.4 |
| Nasal index | 65.23 | 7.29 | 61.4 | 5.1 |
| Nose face height | 48.8 | 3.88 | 45.6 | 2.1 |
| Upperlip height mouth width | 47.01 | 8.64 | 39.4 | 2.7 |
| Mouth- face width | 44.13 | 4.40 | 39.5 | 2.5 |
| Upperlip-nose height | 39.38 | 5.50 | 39.5 | 3.4 |
Results and Discussion
The study was undertaken to record the facial anthropometric measurement in group of 100 healthy subjects (50 male and 50 female) of age group of 18–25 years belonging to similar ethenic background.
It has been shown that hard tissue repositioning by surgical treatment will not result in concurrent linear movement of the soft tissue. Hence understanding soft tissue is must, irrespective of hard tissue deformity. This is not to undermine the importance of harmonious skeletal relationships, but harmonious skeletal relationship alone without corresponding soft tissue drape will not achieve the desired proportional facial aesthetics. Hence hard tissue as well as soft tissue proportions are of paramount importance for the stability, function and aesthetics.
Anthropometric measurements that have important clinical applications and which are mostly affected by surgical or orthodontic treatment were selected for the study. A total of 18 measurements (both horizontal and vertical) were determined using the method and instruments as described by Farkas L. G.
The data obtained were statistically analyzed using “t” test and mean and standard deviation were obtained to establish the norms separately in males and females. An attempt has been made to correlate the findings with clinical application.
The mean values of the anthropometric measurements were compared with that of the North American Caucasian population (Tables 1, 2). It was observed that, width of the face, width of the lower face, bi-ocular diameter, width of the nose, width of the mouth, maxillary and mandibular arc, height of lower face, length of nose showed highly significant variation both in males and females. Females also showed very highly significant variation in morphological height of the face, height of upper face and length of nose [3]. Significant variations were seen in height of lower lip between the two populations. Non- significant variation were seen in morphological height of the face for males, inter-ocular diameter, medial vertical upper lip length, medial vertical height of upper lip and naso-labial angle. These indicate that the overall facial dimensions are more in local population than Caucasian population [4] Proportional indices for the, local population were compared with that of the American Caucasians. It was seen that overall proportions were greater for the local Population. Very highly significant variation were observed in, facial, mandibular—face width, upper face, mandibular width—face height, mouth—face width, lower face—face height proportions. Upper lip—nose height, nasal index showed non-significant variation. Overall the facial features were more pronounced in the local population than North American Caucasians [6] (Tables 3, 4).
Hence it is very essential to understand the facial norms and proportion for various population so that the changes in soft tissue pattern that could result due to the surgical repositioning of the corresponding hard tissue counterpart should be taken into consideration, should be critically evaluated during the stage of treatment planning itself to avoid any disappointments and undesirable facial esthetics [5]. For example in case of maxillary vertical excess, as decided by cephalometric analysis, the treatment plan of impacting the maxilla upwards without giving due importance to the width of the nose and the naso-labial angle would result in disproportionate and non-harmonious changes which in turn will result in a poor facial aesthetics.
Similarly, in a case of maxillary excess and normal face height, surgical procedure to reduce the maxillary excess will finally result in reduction in facial height, which may not be accepted aesthetically.
In case of facial disfigurement such as cleft lip and palate or craniofacial syndromes (Treacher Collins syndrome, Aperts Syndrome, Achondroplasia etc.), these proportions can be used as references to achieve near normal values for establishing the facial harmony and structural balance.
Summary and Conclusion
The study was carried out with the aim of measuring the facial soft tissue proportion in the local population using anthropometry. Study was done using 100 subjects (50 males and 50 females) with Class I skeletal relationship and pleasing profile. Using standard anthropometric landmarks the various anthropometric measurements and facial proportional indices were determined (both horizontal and vertical) and were compared with that for North American Caucasians. From the study the following conclusions were drawn.
When compared between the two populations, the local population had a wider lower face while North American Caucasians showed wider mid face.
Local population had overall greater values of proportional indices than North American Caucasian population.
Contributor Information
H. Jagadish Chandra, Phone: +0-0824-2224618, Phone: +09845150871, Email: jagadishmds@rediffmail.com
M. S. Ravi, Phone: +09845221386
References
- 1.Gosman SD, Vineland DDS. Anthopometric method of facial analysis in orthodontics. Am J Orthod. 1950;36:749. doi: 10.1016/0002-9416(50)90137-0. [DOI] [PubMed] [Google Scholar]
- 2.Bergman RT. Cephalometric soft tissue facial analysis. Am J Orthod. 1999;116(4):373. doi: 10.1016/s0889-5406(99)70222-2. [DOI] [PubMed] [Google Scholar]
- 3.Thomas CS, Nanda RS, et al. Perception of a balanced facial profile. Am J Orthod. 1993;104(2):180–187. doi: 10.1016/S0889-5406(05)81008-X. [DOI] [PubMed] [Google Scholar]
- 4.Ferrario VF, et al. Facial three dimensional morphometry. Am J Orthod Dentofacial Orthop. 1996;109(1):86. doi: 10.1016/S0889-5406(96)70167-1. [DOI] [PubMed] [Google Scholar]
- 5.William Arnett G, et al. Soft tissue cephalometric analysis, diagnosis and treatment planning of dentofacial deformity. Am J Orthod Dentofacial Orthop. 1999;116(3):239. doi: 10.1016/S0889-5406(99)70234-9. [DOI] [PubMed] [Google Scholar]
- 6.Farkas LG, Cheung G. Orbital measurements in the presence of epicanthi in healthy North American Caucasians. Ophthalmologic. 1979;179:309–315. doi: 10.1159/000308937. [DOI] [PubMed] [Google Scholar]
- 7.Dunlevy HA, White RP, et al. Professional and lay judgment of facial esthetic changes following orthognathic surgery. Int J Adult Orthod Orthognath Surg. 1987;3:151–158. [PubMed] [Google Scholar]


