

Abstract
Maze tasks have appealing properties as progress-monitoring tools, but there is a need for a thorough examination of the psychometric properties of Maze tasks among middle school students. We evaluated form effects, reliability, validity, and practice effects of Maze among students in Grades 6 through 8. We administered the same (familiar) and novel Maze passages for progress monitoring of a reading intervention among typical readers (n = 588), struggling readers receiving researcher-provided intervention (n = 471), and struggling readers not receiving intervention (n = 284). Form effects accounted for significant variance in Maze performance. Familiar passages had greater test–retest reliability than novel passages. Both administrative conditions had similar, moderate correlations (validity coefficients) with other measures of reading fluency and comprehension. There were also significant practice effects. Students who read the same passage showed steeper slopes in Maze performance than students who read different passages over time. Practice effects were influenced by beginning levels of reading comprehension and by intervention status.
Keywords: Maze, reading comprehension, measurement, middle school, progress monitoring
Maze tasks are commonly used as brief assessments of reading performance to measure students’ reading progress and evaluate the effectiveness of their instructional programs (National Center on Student Progress Monitoring, 2010). A Maze is a multiple-choice cloze task that students complete while silently reading a short passage (Shinn & Shinn, 2002). The first sentence of the passage is intact. Thereafter, every seventh word of the passage is replaced with three words inside parenthesis, two of which are distracters. The student’s score is typically the number of words chosen correctly in three minutes. Maze tasks are appealing as a progress-monitoring tool because they can yield multiple data points to chart growth across the school year and can be administered in a group format, thereby providing teachers with a means of assessing the reading proficiency of their entire class within minutes (Wayman, Wallace, Wiley, Ticha, & Espin, 2007). Maze tasks may also measure reading comprehension more directly because correct replacements are generated by means of language-based processes that help to build a mental model of the text (i.e., use of background knowledge, inference making, vocabulary, and comprehension-monitoring strategies), potentially providing greater face validity than oral reading fluency (ORF) probes for assessing processes related to reading comprehension (Fuchs, Fuchs, & Maxwell, 2002).
Psychometric Properties of Maze Tasks
Maze tasks are generally moderately to highly reliable across grades. Among middle school students, alternate form reliabilities range from .27 to .91, although in most pairwise comparisons, the correlations range from .70 to .91 with the outlier value (e.g., .27) due to a specific passage (Brown-Chidsey, Davis, & Maya, 2003; Shinn, Deno, & Espin, 2000; Ticha, Espin, & Wayman, 2009; Torgesen, Nettle, Howard, & Winterbottom, 2005). Validity coefficients are more variable. Among elementary-grade readers, convergent validity coefficients (i.e., correlations with other measures that jointly tap levels of reading fluency and comprehension) range from .51 to .72 and criterion validity coefficients (i.e., correlations with measures of reading comprehension) range from .31 to .86 (Ardoin et al., 2004; Deno, Mirkin, & Chiang, 1982; Guthrie, 1973; Jenkins & Jewell, 1993; Shinn, Good, Knutson, Tilly, & Collins, 1992; Torgesen et al., 2005). Among middle and high school students, convergent validity coefficients range from .00 to .79 and criterion validity coefficients range from .32 to .88 (Espin & Foegen, 1996; Fuchs, Fuchs, & Maxwell, 1988; Silberglitt, Burns, Madyun, & Lail, 2006; Ticha et al., 2009; Torgesen et al., 2005). The variability in validity coefficients may be due to the variability in grades across samples, variability in outcomes against which the Maze tasks are assessed, and/or differences in the construction of and administration of the Maze task. Middle school samples tend to be smaller than elementary school samples.
There are other psychometric issues that affect the reliability, validity, and utility of Maze tasks that are less frequently addressed, especially in middle-schoolers, including form equivalence, slope estimates, and practice effects.
Form Equivalence of Maze Passages
As a progress-monitoring tool, the Maze task is a standardized, longitudinal assessment of reading abilities. The same methods are used and equivalent but unique passages (i.e., alternate forms) are administered across measurement points (Reschly, Busch, Betts, Deno, & Long, 2009). This system of assessment assumes that alternate forms function as parallel probes within grade (Jenkins, Zumeta, Dupree, & Johnson, 2005). In addition, the system of assessment assumes that the elicited observed scores exist on a constant metric throughout the range of intended ability (Francis et al., 2008). If they are on a common scale, Maze scores should reflect changes in students’ true reading levels (Francis et al., 2008).
To ensure that alternate Maze passages function as parallel probes within grade, past research has primarily used readability formulae to estimate Maze passage difficulty and select Maze passages of equivalent difficulty (Espin, Wallace, Lembke, Campbell, & Long, 2010; Fuchs & Fuchs, 1992; Shinn et al., 2000; Ticha et al., 2009). Generalizing from research conducted on ORF probes, this practice is problematic because readability formulae imprecisely estimate passage difficulty (Francis et al., 2008). Consequently, past research that has used alternate Maze forms to quantify overall reading proficiency and growth over time likely provide inaccurate estimates of ability because differences in text difficulty across passages administered were not explicitly controlled through a score-equating process.
Individual Slopes and Standard Errors of Slopes (SEbi)
Few studies have examined whether Maze tasks adequately quantify students’ reading growth. Fuchs and Fuchs (1992) examined rates of reading growth among students in Grades 1 to 6 (n = 225). Results revealed that the weekly rate of growth was 0.39 correctly identified words across grades, with no relation between slope and grade level. Ticha et al. (2009) examined growth among eighth-grade students (n = 35) assessed weekly for 10 weeks. Students correctly identified 20 targets (i.e., correctly identified words) on average at the beginning of the study and growth was 1.29 targets per week. Growth rates differed among high- and low-achieving students, with high-achieving students improving at a rate of 1.33 targets per week and low-achieving students improving at a rate of 0.41 targets per week. These results suggest that the Maze task is adequate for evaluating group differences in growth. However, because few studies provide evidence that Maze tasks are sensitive to evaluating individual growth, more research is necessary to substantiate whether Maze tasks are in fact sensitive to growth and if growth varies by reader ability.
To obtain more precise estimates of ability, the standard error of estimate (SEE) should be considered when interpreting test scores (Christ, 2006; Francis et al., 2005). SEE refers to the standard deviation of test scores that would have been obtained if a student had repeatedly taken the same test. A confidence interval (CI), which is a multiple of the SEE, is inferred to include the student’s true ability with some prespecified probability. When slope is used to index change in students’ ability, measurement error is also implicit and is represented as the standard error of the slope (SEb). SEbi is used to estimate a confidence interval around a particular student’s slope. A large SEbi suggests that measurement error will play a significant role in any instructional decision made that is based on the estimated slope for student i (Hintze & Christ, 2004). No study has reported estimates of SEbi for the Maze task.
Practice Effects and Progress Monitoring
One method of ensuring passage equivalence is to use identical passages across measurement time points, which completely controls for form effects on gain scores (Jenkins et al., 2005). Using this method, Jenkins et al. (2005) examined the effects on ORF level from retesting with the same or familiar passages across three measurement time points among students with learning disabilities (n = 33) from Grades 2 to 10. There was substantial individual variation on concurrent ORF passages and smaller variation in gains measured with the familiar passages versus novel passages. Gain scores for familiar passages did not appear to be reliably inflated due to repeated exposure (i.e., familiar, 1.3 words/week; novel, 1.2 words/week). More recently, Griffith, VanDerHeyden, Skokut, and Lilles (2009) examined the effectiveness of using novel versus familiar ORF passages for evaluating response to intervention among fourth-grade students (n = 27). For students receiving the familiar passage, the average slope was 0.60 words correct per minute (WCPM) per week among students who responded to intervention and 0.81 WCPM for students who did not respond to intervention. For students receiving the novel passage, the average slope was 0.53 WCPM per week among students who responded to intervention and −6.25 WCPM for students who did not respond to intervention. Slope was not used to evaluate response to intervention; consequently, these measures of slope were provided for descriptive purposes only. It is not possible to determine from this study the precision or the sensitivity of the different administrative methods to measuring individual growth or group differences in growth.
In summary, both familiar and novel passages may be used to determine if groups of students differ in reading growth. However, the use of familiar passages does not control for learning that is “form specific” (i.e., unique to the form that is repeatedly presented). As a consequence, estimates of reading growth based on progress monitoring with familiar passages may be inflated as measures of generalized growth in reading ability.
Practice effects, the impact of repeated exposures without corrective feedback or instruction on test performance, are well documented in contexts other than progress monitoring (i.e., for IQ, cognitive ability, and general achievement tests such as the SAT). Performance improves across the first few measurement time points, especially when the same test form is used (Hausknecht, Halpert, DiPaolo, & Gerrard, 2007). These practice effects have been shown with regularity in organizational, educational, and research settings (Hausknecht, Trevor, & Farr, 2002; Powers & Rock, 1999; Woehlke & Wilder, 1963). In addition, assessments that are timed and require performance outcomes based on what is accomplished within a specified rather brief time period (e.g., 1–3 min) have been found to be more susceptible to practice effects than other assessments (Dodrill & Troupin, 1975; Lezak, 1995; Slade et al., 2008). Generalizing from this body of literature, we would expect that retesting students with familiar passages would in effect inflate students’ gains. Thus, a familiar-passage measurement design might succeed in reducing measurement error caused by using passages that vary in difficulty (i.e., form effects) but may introduce a second type of measurement bias (i.e., practice effects) caused by using the same passages to measure performance over time (Jenkins et al., 2005).
Research Questions
Although there is evidence that Maze tasks are reliable and valid measures of reading performance, little research has thoroughly examined the fundamental psychometric characteristic of Maze tasks among middle school students. In particular, form and practice effects have not been evaluated for Maze. To more fully understand the technical adequacy of Maze, we examined the effects of using familiar- and novel-passage probes to measure reading progress in a Maze system. We sought to answer two broad questions:
What are the psychometric properties of Maze CBM among middle school students in terms of (a) form effects, (b) reliability and validity of Familiar versus Novel passages, and (c) individual-level slopes and standard errors of slopes of Familiar versus Novel passages?
Does the use of Familiar forms lead to test-specific learning (practice effects) that vary based on reader characteristics (i.e., prior reading ability and intervention participation)?
Method
Participants
This study was conducted in seven middle schools in two large urban cities in the Southwestern United States. Students qualifying for reduced-price or free lunch ranged from 40% to 86%. Of the seven schools, two were rated as recognized, four were rated as acceptable, and one school was rated academically unacceptable according to the state accountability system. Ratings are based on a variety of criteria including student performance on state achievement tests.
Participants in this study were part of a large-scale, middle school study (Vaughn et al., 2010a, 2010b). During the spring of the year prior to the beginning of the study, students in Grades 5 to 7 were randomly selected from groups of Typical (n = 1,031, 38.7% of sample) and Struggling (n = 1,634, 61.3% of sample) readers to participate in the study during Grades 6 to 8 the following year. Typical readers were defined as students who obtained scale scores above 2,150 on the state reading achievement test, the Texas Assessment of Knowledge and Skills (TAKS; Texas Educational Agency, 2008) on their first attempt in the spring prior to the study year. Struggling readers were defined as students who scored at or below a scaled score of 2,150 on TAKS in the spring prior to the study year. This score is one-half of 1 standard error of measurement above the pass–fail cut point for the test and was selected to ensure that Struggling readers who just met the benchmark were not denied intervention that might prevent failure in the future. Thus, some students in the Struggling reader group had passed the state reading assessment on their first attempt, but would be considered at risk of future failure insofar as a fairly narrow confidence interval around their observed score would include the cut-score. In addition, students in special education who did not take TAKS Reading but did take the State Developed Alternative Assessment (SDAA) reading test because of an exemption due to special education status were also defined as Struggling readers.
Students were excluded from the study if (a) they were enrolled in a special education life skills class, (b) their SDAA Reading performance levels were equivalent to a first-grade reading level or lower, (c) they presented a significant sensory disability, or (d) they were classified as English as Second Language by their middle school.
The percentage of Struggling readers statewide at the time of selection was 36.6%, 18.2%, and 36.1% in Grades 5 to 7, respectively. Because of the nature of the larger study, which included both measurement and intervention components, Struggling readers were oversampled (approximately 60% of the initial sample in each grade). For the intervention component of the larger study, Struggling readers were randomly assigned to Intervention (n =1,031) and No-Intervention (n = 600) groups.
When the study year began, 782 of the students selected in the prior year did not matriculate in study schools. The attrition rates did not differ by Reader/Intervention Group (Typical, Struggling–No Intervention, Struggling–Intervention), χ2(2) = 3.83, p > .05. Prior to the first wave of testing, 1,742 students were randomized to Familiar (n = 870) and Novel (n = 872) Passage Protocol Groups. Passage Protocol Group assignment determined whether individual students were assessed with the same (Familiar) or different (Novel) Maze passages during the school year.
The remaining students (n = 141) were not randomized for various reasons (the student withdrew, it was determined the student’s reading performance level was too low based on SDAA, etc.). The proportion of students randomized differed by Reader/Intervention Group, χ2(2) = 57.20, p < .05. Proportionately fewer Struggling–Intervention students and more Typical students participated in the randomization, partly because students with reading performance below the criterion level described above were excluded, and these students were exclusively in the Struggling Reader Group, and roughly two thirds of Struggling readers were included in the Intervention component of the study.
Within each Reader/Intervention group, the students who were not randomized did not differ from those who were randomized on most measures of verbal knowledge, word reading fluency, and reading comprehension: Verbal Knowledge subtest, Kaufman Brief Intelligence Test–2 (KBIT; Kaufman & Kaufman, 2004); Test of Word Reading Efficiency (TOWRE; Torgesen, Wagner, & Rashotte, 1999); and Woodcock-Johnson III Passage Comprehension (WJPC; Woodcock, McGrew, & Mather, 2001). Within the Typical and Struggling–Intervention groups, students who were randomized differed from those who were not randomized on the Group Reading Assessment and Diagnostic Evaluation Passage Comprehension test (GRADE, Williams, 2002): Typical, Randomized versus Not Randomized, 102.1 versus 96.4, F(1, 736) = 4.07, p < .05; Struggling–Intervention, Randomized versus Not Randomized, 87.6 versus 90.0, F(1, 696) = 4.52, p < .05.
Because randomization to Passage Protocol Groups occurred at the level of the entire sample (instead of within Reader/Intervention Group), assignment to Passage Protocol Groups was not equal within two Reader/Intervention Groups. More students within the Typical group were assigned to the Novel than the Familiar protocol, and more students within the Struggling–No Intervention group were assigned to the Familiar than the Novel protocol. Within the Struggling–Intervention group, equal numbers of students were assigned to the Novel and Familiar protocols.
Students in the final sample (n = 1,343) were selected from the 1,742 students who had been randomized to passage protocol groups. The students who were excluded from the final sample (n = 399) were missing at least one Maze assessment during the year (see Note 1), were missing one or more assessments of external validation tests, were assessed using a nonstandard Passage Protocol, or switched grade or intervention tier. The proportion of students assigned to Familiar and Novel protocols did not differ between retained and excluded students within any of the three Reader/Intervention groups. The proportion of excluded students differed across Reader/Intervention groups, 20%, 24%, and 27% for Typical, Struggling–Intervention, and Struggling–No Intervention, respectively, χ2(2) = 9.48, p < .05. However, excluding Typical students, the proportions of Struggling–Intervention and Struggling–No Intervention students did not statistically differ between retained and excluded students, χ2(1) = 1.41, p > .05.
Overall, the 399 excluded students performed lower than 1,343 included students (p < .05) on all beginning-of-year language and reading measures, based on 2 (excluded vs. included) × 3 (Reader/Intervention Group) × 2 (Passage Protocol Group) analysis of variance (ANOVA; KBIT, 8.1 vs. 8.9; TOWRE, 93.0 vs. 98.0; WJPC, 87.4 vs. 92.2; GRADE, 90.6 vs. 94.5). There were no interactions between inclusionary status and Reader/Intervention or Passage Protocol assignment.
In summary, the final sample performs slightly higher than the originally selected sample of students. However, the loss of students is not different by Reader/Intervention group, nor does there appear to be any bias with respect to assignment to Familiar and Novel passage conditions within or between Reader/Intervention groups.
Measures
AIMSweb Maze CBM Reading Comprehension (AIMS, Shinn & Shinn, 2002)
AIMS is a 3-min, group-administered assessment of fluency and comprehension. Students are presented with a 150–400-word passage and are required to identify the correct target among three choices for each omitted word in the passage. The first sentence is left intact but thereafter every seventh word is replaced with three words inside parentheses (one correct word and two distractor words). One distractor is a word of the same type as the correct word (e.g., noun, verb, or adverb) but does not preserve the meaning of the sentence or paragraph. The other distractor is not of the same type and was randomly selected from the passage (Shinn & Shinn, 2002). Fifteen different passages were used for each grade. The score was the number correct minus the number of incorrect. If students finished within the 3-min time limit, scores were prorated.
Verbal Knowledge subtest, Kaufman Brief Intelligence Test-2 (KBIT, Kaufman & Kaufman, 2004)
The KBIT Verbal assesses receptive vocabulary and general information (e.g., nature, geography). Students are required to choose one of six illustrations that best corresponds to an examiner question. Internal consistency values range from .89 to .94, and test–retest reliabilities range from .88 to .93 in the age range of the students in this study.
Woodcock-Johnson III Passage Comprehension (WJPC, Woodcock et al., 2001)
WJPC uses a cloze procedure to assess sentence level comprehension. Students are required to read a sentence or short passage and fill in the missing words based on overall context. The split-half reliability for this measure is .83 to .96 in the age range of students in this study. Standard scores were used in all analyses.
Group Reading Assessment and Diagnostic Evaluation Passage Comprehension (GRADE, Williams, 2002)
For this assessment, students read one or more paragraphs and answered multiple-choice questions. The GRADE produces a stanine score for the Passage Comprehension subtest, but for purposes of this study the raw score was prorated to derive a standard score for the GRADE Comprehension Composite, which is typically based on the Passage Comprehension and Sentence Comprehension measures (the latter was not administered). Based on samples drawn from this study, coefficient alpha for the Passage Comprehension subtest is .82 among Grade 6 and .88 among Grade 7 and 8 students.
Test of Word Reading Efficiency (TOWRE, Torgesen, Wagner, & Rashotte, 1999)
This assessment consists of two subtests: Sight Word Efficiency (real words) and Phonemic Decoding (nonwords). For both subtests, the students were given a list of 104 words and asked to read them as accurately and as quickly as possible. The raw score is the number of words read correctly within 45 s. Alternate forms reliability and test–retest reliability coefficients are at or above .90 for students in Grades 6 to 8 (Torgesen et al., 1999). The dependent measure was the standard score based on the sum of the two subtests.
Procedures
Students were assessed at the beginning of the school year with KBIT and at the beginning and end of the year with WJPC, GRADE, and TOWRE. They were assessed five times during the year with AIMS. AIMS assessments occurred during the following times: September 6 to November 7, November 26 to December 14, January 23 to February 8, March 5 to March 30, and April 23 to May 23. School and student issues (e.g., scheduling conflicts, professional development days, and expulsions) as well as the large number of students assessed were the reasons for the extended time ranges within wave. At each wave, students read one AIMS passage. Within each grade, wave, Reading/Intervention group (i.e., Typical, Struggling–Intervention, Struggling–No Intervention), and Passage Protocol group (i.e., Familiar, Novel), each of the 15 available passages were read, albeit by varying numbers of students. This counterbalancing was done to control for passage effects and ensure that grade, assessment wave, Reading/Intervention group, and, most importantly, Passage Protocol group were not confounded with passage effects.
Within the Familiar condition, students were randomly assigned to one of 15 passages and were expected to read the same passage at each wave. Within the Novel condition, students were randomly assigned to one of 15 protocols, where each protocol consisted of five different passages to be read one per wave across the five waves. Each of the 15 passages was represented at every wave (i.e., each passage was represented in five protocols). Because of an error in passage assignment, one of the 15 protocol groups in the Novel condition actually read the same passage at the third and fifth waves. This affected 55 students (29 Typical, 15 Struggling–Intervention, 11 Struggling–No Intervention). However, these students were retained in the sample because they read four novel passages across waves.
All participants were assessed by examiners who completed an extensive training program conducted by the investigators focused on test administration, scoring, and verification procedures for each measure. Prior to testing participants, each examiner demonstrated at least 95% accuracy during practice assessments. All assessments were completed at the students’ middle school in quiet locations designated by the school (i.e., library, unused classrooms, etc.).
Results
Group Demographics and Achievement
Tables 1 and 2 show demographic and achievement information for the Reader/Intervention and Passage Protocol groups. We compared demographics and achievement between Familiar and Novel Passage Protocol groups within each Reader/Intervention group and between Struggling–Intervention and Struggling–No Intervention groups because the randomization processes were designed to control for differences across these levels of assignment.
Table 1.
Mean (SD) Age and Demographics (%) by Reader/Intervention and Passage Protocol Group
| Demographic | Typical
|
Struggling
|
||||
|---|---|---|---|---|---|---|
| Intervention
|
No Intervention
|
|||||
| Familiar | Novel | Familiar | Novel | Familiar | Novel | |
| n | 279 | 309 | 162 | 122 | 234 | 237 |
| Age | 12.2 (0.9) | 12.2 (0.9) | 12.5 (0.9) | 12.5 (1.0) | 12.3 (1.0) | 12.3 (1.0) |
| Gender (female) | 55 | 59 | 49 | 46 | 50 | 46 |
| Reduced-price or free luncha | 67 | 77 | 89 | 87 | 91 | 86 |
| African American | 35 | 41 | 39 | 33 | 39 | 45 |
| Hispanic | 29 | 28 | 43 | 48 | 46 | 40 |
| White | 30 | 27 | 14 | 16 | 14 | 11 |
| Asian | 6 | 5 | 2 | 2 | 2 | 4 |
| Grade 6 | 36 | 39 | 33 | 36 | 40 | 49 |
| Grade 7 | 25 | 22 | 23 | 23 | 23 | 19 |
| Grade 8 | 39 | 39 | 44 | 41 | 37 | 32 |
Reduced-price or free lunch status data were missing for some students (Missing Typical Familiar = 6 Novel = 1; Struggling–No Intervention Familiar = 4 Novel = 1; Struggling–Intervention Familiar = 9 Novel = 7).
Table 2.
Mean (SD) IQ, Reading Achievement, and Weeks Between Testing Waves by Reader/Intervention and Passage Protocol Group
| Measure | Typical
|
Struggling
|
||||
|---|---|---|---|---|---|---|
| No Intervention
|
Intervention
|
|||||
| Familiar | Novel | Familiar | Novel | Familiar | Novel | |
| KBIT Verbal (pretest) | 10.4 (2.2) | 10.4 (2.5) | 7.6 (2.6) | 7.8 (2.6) | 7.6 (2.6) | 7.8 (2.4) |
| TOWRE (pretest) | 104.6 (13.2) | 105.3 (13.5) | 90.2 (15.7) | 94.0 (15.0) | 92.6 (14.0) | 93.3 (14.0) |
| TOWRE (posttest) | 106.3 (13.2) | 106.8 (14.1) | 91.3 (15.6) | 94.2 (14.2) | 93.6 (14.8) | 95.7 (14.7) |
| WJPC (pretest) | 99.2 (9.8) | 99.7 (9.4) | 85.5 (11.9) | 88.3 (10.3) | 85.9 (10.8) | 87.3 (10.2) |
| WJPC (posttest) | 101.0 (10.4) | 101.9 (10.0) | 86.6 (12.8) | 88.5 (10.2) | 88.0 (10.7) | 88.8 (9.7) |
| GRADE (pretest) | 102.4 (11.6) | 102.5 (12.2) | 87.8 (10.8) | 88.2 (9.9) | 88.4 (9.5) | 88.4 (10.0) |
| GRADE (posttest) | 101.7 (12.8) | 103.1 (12.9) | 87.4 (9.2) | 88.1 (9.4) | 87.3 (9.2) | 89.1 (10.0) |
| AIMS (W1) | 23.3 (8.8) | 23.8 (9.4) | 13.0 (8.8) | 14.7 (8.5) | 13.8 (8.2) | 14.6 (8.3) |
| AIMS (W2) | 27.5 (9.8) | 24.7 (9.5) | 15.7 (10.3) | 15.9 (9.3) | 15.7 (8.3) | 15.4 (8.4) |
| AIMS (W3) | 30.9 (11.4) | 27 (10.2) | 17.3 (11.0) | 17.6 (8.6) | 18.1 (10.3) | 16.1 (8.7) |
| AIMS (W4) | 35.4 (12.1) | 29 (10.9) | 19.7 (12.0) | 17.8 (10.0) | 21.2 (11.5) | 17.9 (9.5) |
| AIMS (W5) | 37.9 (12.0) | 29.9 (11.4) | 21.8 (14.1) | 19.8 (10.2) | 24.4 (12.0) | 18.4 (10.8) |
| AIMS (W1–W5 gain) | 14.5 (7.3) | 6.1 (8.8) | 8.8 (9.0) | 5.2 (8.9) | 10.6 (8.3) | 3.7 (9.3) |
| Weeks (W1–W2) | 7.2 (1.7) | 7.1 (1.7) | 7.1 (1.7) | 6.9 (1.5) | 8.4 (2.1) | 8.5 (2.2) |
| Weeks (W2–W3) | 8.4 (0.4) | 8.4 (0.5) | 8.5 (0.4) | 8.5 (0.4) | 8.4 (0.4) | 8.4 (0.4) |
| Weeks (W3 to W4) | 6.4 (1.6) | 6.5 (1.5) | 6.5 (1.5) | 6.3 (1.6) | 6.5 (1.6) | 6.5 (1.6) |
| Weeks (W4–W5) | 6.8 (1.8) | 6.7 (1.7) | 6.7 (1.8) | 6.9 (1.9) | 6.6 (2.0) | 6.5 (2.0) |
| Weeks (W1–W5) | 28.8 (1.5) | 28.8 (1.6) | 28.8 (1.6) | 28.7 (1.4) | 29.9 (2.2) | 30.0 (2.3) |
| AIMS gain per week | 0.51 (0.26) | 0.21 (0.31) | 0.31 (0.31) | 0.18 (0.32) | 0.36 (0.28) | 0.12 (0.31) |
Note. KBIT Verbal = The Verbal Knowledge subtest of the Kaufman Brief Intelligence Test–2 (Kaufman & Kaufman, 2004); TOWRE = Test of Word Reading Efficiency (Torgesen, Wagner, & Raschote, 1999); WJPC = Woodcock-Johnson III Passage Comprehension (Woodcock, McGrew, & Mather, 2001); GRADE = Group Reading Assessment and Diagnostic Evaluation Passage Comprehension (Williams, 2002); AIMS = AIMSweb Maze CBM Reading Comprehension (AIMS, Shinn & Shinn, 2002); W1–W5 = Wave 1–Wave 5. AIMS means are Raw Scores. All other IQ and reading means are Standard Scores. Weeks = 7 days/week. October 10, the median time point of testing during the first wave, was the reference for calculating each individual student’s week of testing for each wave. For example, a student tested on the following days: 9/21, 11/28, 1/29, 3/22, and 4/24 was tested at the following weeks: −2.7, 7.0, 15.9, 23.3, 28.0. AIMS Gain per Week = AIMS (W1–W5 gain)/Weeks (W1–W5).
The only significant difference in demographics between Familiar and Novel Groups was that a greater percentage of students in the Novel group than in the Familiar group among Typical students were provided reduced-price or free lunch, 77% versus 67%, χ2(1) = 4.83, p < .05. For the Struggling groups, there were significantly disproportionate numbers of Grade 6 (45% vs. 34%), 7 (21% vs. 23%), and 8 students (34% vs. 43%) between the Intervention and No-Intervention groups, χ2(2) = 8.73, p < .05. Where appropriate, we evaluated free lunch status and grade to determine if these factors influence effects of passage protocol or intervention on AIMS Maze performance. Any effects, or lack thereof, are reported in the appropriate sections.
We conducted 3 (Reader/Intervention Group) × 2 (Passage Protocol Group) ANOVAs and analyses of covariance (controlling for beginning-of-year achievement) to determine if the groups differed in age, beginning-of-year achievement, or end-of-year achievement. There were Reader/Intervention Group effects on all outcome measures (p < .05) most of which were due to differences between Typical and Struggling Readers, as expected by design. In addition, the Struggling–Intervention students were 2 months younger (12.3 vs. 12.5), F(1, 753) = 7.2, p < .05, and had slightly higher end-of-year performance on TOWRE (94.7 vs. 92.6), F(1, 753) = 3.63, p < .06, and WJPC (88.4 vs. 87.4), F(1, 753) = 4.88, p < .05, than the Struggling–No Intervention students. There were no other beginning- or end-of-year achievement differences between Struggling–Intervention and No Intervention students (p > .06).
There were significant Passage Protocol Group effects with higher performance by students in the Novel group on beginning-of-year TOWRE (99.0 vs. 97.0), F(1, 1334) = 4.91, p < .05, WJPC (93.2 vs. 91.3), F(1, 1334) = 7.55, p < .05, and AIMS Maze (18.9 vs. 17.5), F(1, 1334) = 3.90, p < .05, as well as end-of-year GRADE (95.4 vs. 93.2), F(1, 1334) = 6.18, p < .05. There was also a Reader/Intervention Group by Passage Protocol Group Interaction on end-of-year AIMS, F(2, 1336) = 7.96, p < .05. Where appropriate, we evaluated effects of beginning-of-year performance on TOWRE and WJPC to determine if these factors influence effects of Passage Protocol or Intervention on AIMS Maze performance. Any effects, or lack thereof, are reported in the appropriate sections. The Reader/Intervention and Passage Protocol group differences in Maze performance are the subject of this paper and further examined in subsequent sections.
Research Question 1A: Psychometric Properties—Form Effects
To evaluate whether form (i.e., passage) influences Maze performance, we analyzed Maze data from the first wave of testing only, thereby excluding the influences of Passage Protocol (Familiar vs. Novel) or Intervention assignment. Within this first wave, there were 15 Maze Form Groups per grade (i.e., for each grade, 15 passages). However, our sample was stratified by design to include a disproportionate number of Struggling students (e.g., 58% Grade 6 Struggling in sample vs. 37% Struggling in population). There was also random variation in the proportion of Struggling students assigned to read each of the 15 passages administered within each grade (e.g., 46%–70% Grade 6 Struggling readers across Maze Form Groups). Therefore, we weighted the sample to estimate population means across passages. We also used weighting to evaluate form effects. Sample weighting is a common technique for more precisely estimating population parameters based on samples that are not randomly selected (i.e., most samples in social science research) and often stratified by design (see Lee, Forthofer, & Lorimor, 1989, for discussion of weighting techniques). It is useful in reading research for estimating population statistics based on samples with poor readers disproportionately represented by design (e.g., see Catts, Fey, Zhang, & Tomblin, 1999).
Struggling and Typical students were weighted within grade and Maze Form Group. For example, weights for Grade 6 Struggling students in each of the Maze Form Groups were calculated as follows:
where WSf is the weight for Struggling students in Maze Form Group f, 0.37 is the percentage of Grade 6 Struggling students in the population from which the sample was selected (i.e., based on statewide TAKS score distributions, see Group definitions and selection), Nf is the total number of students in Maze Form Group f, and Sf is the number of Struggling students in the Maze Form group f. All descriptive statistics and analyses related to form effects were based on a weighted sample.
In general, there were minimal language and reading differences between the Maze Form Groups. For each of the external measures, all students were tested using the same form. There were marginal differences in KBIT performance across passage assignment groups, G6: F(14, 513) = 1.62, p = .069; G7: F(14, 287) = 1.84, p = .033; G8: F(14, 498) = 1.67, p = .059; but no significant differences in performance on TOWRE, G6: F(14, 513) = 1.50, p = .107; G7: F(14, 287) = 0.52, p = .919; G8: F(14, 498) = 1.02, p = .431; WJPC (G6: F(14, 513) = 1.49, p = .111; G7: F(14, 287) = 1.04, p = .413; G8: F(14, 498) = 0.70, p = .774; or GRADE, G6: F(14, 513) = 1.27, p = .222; G7: F(14, 287) = 0.37, p = .982; G8: F(14, 498) = 0.76, p = .714. Although not statistically significant, the range across Maze Form groups in mean performances on the external reading measures was 6 to 10 standard score points depending on grade and the reading measure. Therefore, we controlled for these external measures in evaluating form effects.
In ANOVA models that included the language and reading achievement as well as Maze Form Group, the latter accounted for unique variance in Maze performance across all three grades: Grade 6, 6.2%, F(14, 509) = 4.95, p < .05; Grade 7, 13.3%, F(14, 283) = 6.29, p < .05; Grade 8, 8.8%, F(14, 494) = 7.09, p < .05. There was a 10- to 13-point difference (1.1–1.4 SDs) in mean Maze performance across forms depending on grade (see Table 3). It should be noted that form effects were evident within Reader groups. For Struggling students, there was a 7.8 to 13.5 mean Maze performance difference across forms, and for Typical students, there was a 12.2 to 15.3 mean Maze performance difference across forms, depending on grade.
Table 3.
Wave 1 Maze Weighted Performance by Passage Assignment and Grade
| Passage Assignment | Grade 6
|
Grade 7
|
Grade 8
|
||||||
|---|---|---|---|---|---|---|---|---|---|
| n | M | SD | n | M | SD | n | M | SD | |
| 1 | 45 | 18.9 | 10.3 | 18 | 19.9 | 10.8 | 38 | 25.2 | 10.2 |
| 2 | 42 | 24.4 | 10.4 | 25 | 24.0 | 7.1 | 32 | 23.9 | 9.9 |
| 3 | 35 | 22.7 | 8.2 | 20 | 26.5 | 7.8 | 42 | 19.3 | 10.1 |
| 4 | 32 | 21.2 | 8.4 | 18 | 22.1 | 9.9 | 29 | 20.6 | 10.9 |
| 5 | 31 | 14.0 | 7.0 | 16 | 23.3 | 9.8 | 33 | 19.6 | 10.1 |
| 6 | 29 | 23.7 | 11.5 | 24 | 18.8 | 6.9 | 29 | 22.2 | 9.8 |
| 7 | 34 | 19.8 | 8.4 | 21 | 23.1 | 10.2 | 37 | 20.0 | 9.1 |
| 8 | 39 | 18.4 | 6.7 | 24 | 22.2 | 10.2 | 31 | 25.6 | 10.5 |
| 9 | 37 | 16.2 | 6.8 | 18 | 20.0 | 10.0 | 38 | 18.3 | 10.4 |
| 10 | 33 | 18.1 | 7.2 | 20 | 14.2 | 9.2 | 38 | 21.7 | 10.1 |
| 11 | 35 | 16.3 | 9.6 | 20 | 20.9 | 9.5 | 30 | 14.4 | 7.8 |
| 12 | 35 | 18.9 | 9.3 | 20 | 21.8 | 10.0 | 32 | 16.0 | 8.1 |
| 13 | 40 | 19.8 | 9.2 | 21 | 22.8 | 8.6 | 35 | 23.6 | 11.9 |
| 14 | 27 | 17.5 | 8.6 | 20 | 26.7 | 10.5 | 36 | 23.2 | 7.8 |
| 15 | 34 | 19.9 | 12.0 | 17 | 13.3 | 7.6 | 33 | 22.1 | 12.6 |
Note. Means are weighted based on population proportions of Typical and Struggling students. Bolded values are the lowest and highest means within grade.
We did not correct for form effects in subsequent analyses because these effects were controlled through the randomization process. Students were randomly assigned to passages, and all passages were represented in all groups at all measurement times. Thus, effects of Novel versus Familiar passages and of Reader/Intervention group are not biased by the presence of form effects.
Research Question 1B: Psychometric Properties—Maze Reliability and Concurrent and Predictive Validity
To estimate population reliability and validity coefficients, we used weighting techniques similar to those used when evaluating form effects. In this case, weights were calculated within Passage Protocol Groups (Familiar, Novel) instead of Maze Form Groups (Passages 1–15). Table 4 shows correlation coefficients between Maze scores across the assessment times (test–retest reliability), correlations between Maze scores and external reading measures within the same assessment time (concurrent validity), and correlations between Maze scores from the first four assessment times and external reading measures at the end of the year (predictive validity).
Table 4.
Maze Weighted Reliability and Validity Coefficients by Grade and Passage Protocol Group
| Measure | Grade 6
|
Grade 7
|
Grade 8
|
|||||||||||||||||||||
|---|---|---|---|---|---|---|---|---|---|---|---|---|---|---|---|---|---|---|---|---|---|---|---|---|
| Familiar | Novel | Familiar | Novel | Familiar | Novel | |||||||||||||||||||
|
| ||||||||||||||||||||||||
| Test–Retest Reliability Coefficients
|
||||||||||||||||||||||||
| W1 | W2 | W3 | W4 | W1 | W2 | W3 | W4 | W1 | W2 | W3 | W4 | W1 | W2 | W3 | W4 | W1 | W2 | W3 | W4 | W1 | W2 | W3 | W4 | |
| AIMS W2 | .86 | .70 | .86 | .78 | .87 | .68 | ||||||||||||||||||
| AIMS W3 | .83 | .86 | .74 | .77 | .87 | .88 | .64 | .79 | .88 | .90 | .68 | .75 | ||||||||||||
| AIMS W4 | .80 | .85 | .87 | .70 | .79 | .74 | .81 | .84 | .91 | .73 | .76 | .79 | .87 | .89 | .91 | .71 | .76 | .77 | ||||||
| AIMS W5 | .82 | .86 | .86 | .87 | .69 | .77 | .79 | .76 | .82 | .86 | .91 | .89 | .69 | .70 | .68 | .78 | .84 | .84 | .85 | .88 | .71 | .76 | .73 | .78 |
|
| ||||||||||||||||||||||||
| Concurrent Validity Coefficients
|
||||||||||||||||||||||||
| W1 | W5 | W1 | W5 | W1 | W5 | W1 | W5 | W1 | W5 | W1 | W5 | |||||||||||||
|
| ||||||||||||||||||||||||
| TOWRE | .57 | .61 | .56 | .63 | .58 | .55 | .48 | .53 | .45 | .54 | .51 | .62 | ||||||||||||
| WJPC | .69 | .68 | .56 | .63 | .53 | .62 | .54 | .61 | .61 | .68 | .60 | .69 | ||||||||||||
| GRADE | .56 | .62 | .52 | .63 | .56 | .66 | .50 | .60 | .61 | .70 | .59 | .63 | ||||||||||||
|
| ||||||||||||||||||||||||
| Predictive Validity Coefficients
|
||||||||||||||||||||||||
| W1 | W2 | W3 | W4 | W1 | W2 | W3 | W4 | W1 | W2 | W3 | W4 | W1 | W2 | W3 | W4 | W1 | W2 | W3 | W4 | W1 | W2 | W3 | W4 | |
|
| ||||||||||||||||||||||||
| TOWRE | .60 | .64 | .63 | .64 | .57 | .61 | .62 | .58 | .53 | .57 | .57 | .49 | .50 | .59 | .63 | .60 | .55 | .53 | .54 | .56 | .54 | .58 | .62 | .58 |
| WJPC | .65 | .68 | .67 | .67 | .61 | .61 | .61 | .65 | .54 | .58 | .60 | .60 | .54 | .63 | .62 | .65 | .63 | .65 | .66 | .67 | .64 | .70 | .68 | .73 |
| GRADE | .63 | .69 | .63 | .64 | .60 | .64 | .62 | .65 | .59 | .65 | .66 | .65 | .60 | .56 | .59 | .65 | .62 | .62 | .65 | .68 | .51 | .61 | .60 | .63 |
Note. TOWRE = Test of Word Reading Efficiency (Torgesen, Wagner, & Raschote, 1999); WJPC = Woodcock-Johnson III Passage Comprehension (Woodcock, McGrew, & Mather, 2001); GRADE = Group Reading Assessment and Diagnostic Evaluation Passage Comprehension (Williams, 2002); AIMS = AIMSweb Maze CBM Reading Comprehension (AIMS, Shinn & Shinn, 2002). W1–W5 = Wave 1 to Wave 5. Test–retest reliabilities are correlations among AIMS administered at different waves. Concurrent validities are correlations between AIMS and specified reading measures within wave. Predictive validities are correlations between AIMS at Waves 1 to 4 and other reading measures at Wave 5. Correlations are weighted based on population proportions of Typical and Struggling students. Bolded correlations are significantly different (p < .05) between Familiar and Novel groups within grade.
Collapsing across grades, the mean of test–retest reliabilities for Maze when assessed with the same passage (Familiar) was .86 and when assessed with different passages (Novel) was .74. Mean concurrent validity coefficients with word reading efficiency (TOWRE) were .55 (Familiar) and .56 (Novel) and with reading comprehension (WJPC and GRADE) were .63 (Familiar) and .60 (Novel). Predictive validity coefficients were similar to concurrent validity coefficients (see Table 4). Differences in correlations between Familiar and Novel groups were evaluated based on Fisher’s r to Z transformations (Table 4). Collapsing across grades, Familiar test–retest coefficients were significantly greater than Novel test–retest coefficients (p < .05). The validity coefficients did not differ across the two groups (p > .05).
Research Question 1C: Psychometric Properties—Individual-Level Slopes and Standard Errors of Slopes
Ordinary least squares regression was used to calculate individual slopes for each student. Slopes were calculated in this way to describe individual-level slopes because in practice that is the unit of analysis. “No assumptions are necessary for the computation of correlation, regression, and other associated coefficients or their interpretation when they are used to describe the available sample data” (Cohen, Cohen, West, & Aiken, 2003, p. 41). In this section, the statistics are provided for descriptive purposes only. In the following section on Practice Effects, statistical analyses of Familiar versus Novel group slope differences are based on multilevel growth analysis using maximum likelihood estimation to avoid violations of assumptions of independence.
Slopes represent the change in Maze score (number of targets correctly identified) per week. October 10, the median time point of assessment at Wave 1, was used as the reference point to calculate weeks (based on a 7-day week) for each student. This way, a student tested on October 10 during Wave 1 was tested at 0 weeks whereas a student tested on October 17 during Wave 1 was tested at 1 week. This insures a precise measure of weeks between assessment waves as well as weeks relative to the school year for each student.
Weighting techniques similar to those used in the previous sections were used to compute the descriptive statistics but were not used in computing individual estimates. Table 5 shows descriptive statistics for slopes. Descriptively, slopes were greater among students who read the same passage (Familiar) than those who read different passages (Novel) throughout the year.
Table 5.
Maze Weighted Slopes, Standard Errors of Slope, and Correlations Between Slope and Reading Achievement
| Grade | Familiar | Novel | ||||
|---|---|---|---|---|---|---|
|
| ||||||
| Slope
| ||||||
| N | M | SD | n | M | SD | |
| 6 | 247 | 0.46 | 0.27 | 281 | 0.21 | 0.26 |
| 7 | 161 | 0.46 | 0.27 | 141 | 0.22 | 0.29 |
| 8 | 267 | 0.43 | 0.27 | 246 | 0.17 | 0.29 |
|
| ||||||
|
SEE and Mean SEba
|
||||||
| SEE | SEb | SEE | SEb | |||
|
| ||||||
| 6 | 3.91 | 0.17 | 4.55 | 0.19 | ||
| 7 | 3.67 | 0.16 | 4.77 | 0.21 | ||
| 8 | 4.04 | 0.18 | 5.20 | 0.23 | ||
|
| ||||||
| Correlation (Slope With Outcome)
|
||||||
| TOWRE | WJPC | GRADE | TOWRE | WJPC | GRADE | |
|
| ||||||
| 6 | .38 | .42 | .32 | .30 | .30 | .29 |
| 7 | .25 | .43 | .42 | .11 | .17 | .14 |
| 8 | .34 | .47 | .55 | .28 | .28 | .33 |
Note. Means and correlations are weighted based on population proportions of Typical and Struggling students. Individual-level slopes were calculated using ordinary least squares regression. Slope units are number of words correctly identified per week. TOWRE = Test of Word Reading Efficiency (Torgesen, Wagner, & Raschote, 1999); WJPC = Woodcock-Johnson III Passage Comprehension (Woodcock, McGrew, & Mather, 2001); GRADE = Group Reading Assessment and Diagnostic Evaluation Passage Comprehension (Williams, 2002)
SEEs (standard errors of estimate) was estimated for each grade and passage protocol group (Familiar/Novel; see results for formula). Mean SEb (standard errors of slope) estimates are based on the square root of the mean of the squared SEbi’s (see results for SEbi formula).
SEbis were based on pooled estimates of SEE. Estimates of error variance were pooled across students within grade and Passage Protocol Group (Familiar, Novel). Pooled estimates of SEE are more precise than person-specific estimates of SEE (Francis, Schatschneider, & Carlson, 2000). Specifically, under typical assumptions regarding error variance, the pooled estimate of error variance is unbiased and has smaller variance, which decreases as the number of individuals in the sample increases (i.e., the pooled estimate is unbiased, more efficient, and is consistent). Using a separate estimate of the error variance component (i.e., the numerator part) of the SEbi is tantamount to assuming that the variance parameter is person specific, and estimation of this parameter is not improved by increasing the sample size by adding more individuals to the sample. Using the pooled approach, slope estimates vary across individuals in their precision based on differences in the time sampling across individuals, not because of differences in the estimates of error variance at the person level. The pooled approach is statistically appropriate because the error variance is poorly estimated at the individual level, because individual time series are very short and noisy, and because it is unreasonable to assume that error variance is person specific. To assume that error variance is person specific is akin to saying that the psychometric properties of the assessment are person specific.
Given the foregoing discussion, SEbi’s were calculated as follows:
SEEgp is the square root of the pooled variance estimate, pooled within grade g and passage protocol group p (Familiar, Novel); that is, SEEgp is the pooled estimate of the standard error; Yit is the AIMS score for individual i at time t; Ŷit is the estimated AIMS score for individual i at time t (based on ordinary least squares regression for individual i); Ti is the number of time points T for individual i; ngp is the number of students in grade g and passage protocol group p; SEbi is the standard error of the slope for individual i; SEEgpi is the SEE for grade g and passage protocol group p to which individual i belongs; Wit is the week of testing at time for individual i at time t; and W̄i is the mean weeks across testing times for individual i.
Table 5 includes SEE and mean SEb estimates by grade and Passage Protocol group. Descriptively, SEEs and mean SEbs were higher among students in the Novel condition than in the Familiar condition across all three grades. Correlations between slope and end-of-year reading performance were low to moderate (see Table 5). Descriptively, in every case, correlations between slope and reading outcomes were higher in the Familiar condition than in the Novel condition.
Research Question 2: Practice Effects
The evidence that slopes are greater among students in the Familiar condition than students in the Novel condition suggests the possibility of practice effects. We examined this phenomenon in more detail using multilevel growth modeling with maximum likelihood estimation. Multilevel growth modeling allows for the examination of correlates of person-level parameters describing change, in this case, intercept and slopes. In addition, it provides better estimates of these parameters and their reliabilities than ordinary least squares regression (see Francis et al., 2000, for discussion of different methods for analyzing change).
First, we estimated the practice effect (i.e., difference in slopes between Familiar and Novel groups) for the population by weighting the observations as above. In the multilevel growth model, we evaluated the main effects of time (weeks), Passage Protocol Group (Familiar vs. Novel), and the interaction between time and passage protocol (i.e., slope differences between students assigned to Familiar and Novel conditions, or practice effects on rates of growth) on AIMS performance. Separate covariances (i.e., slope and intercept variances, covariance between slope and intercept, and residual variances) were estimated for the two Passage Protocol Groups. Time was scaled so that the intercept could be interpreted as expected performance on October 10, which was the median time at which students were assessed during the first assessment wave. This does not mean time was fixed across students, but the reference point for evaluating weeks relative to the school year for each student was set to October 10. For each student, time for each subsequent assessment was the number of weeks between that assessment date and October 10. Table 6 shows the mean estimates of intercept and slope for the Familiar and Novel groups. The Novel group started the year significantly higher than the Familiar group on Maze performance, F(1, 1341) = 6.62, p < .05. Both groups showed significant growth in Maze performance, F(1, 1341) = 1366.55, p < .05. However, the students in the Familiar group demonstrated greater growth than students in the Novel condition; that is, there was a significant practice effect on rates of growth, F(1, 1341) = 196.00, p < .05.
Table 6.
Population (Weighted) and Reader/Intervention Group Estimates of Maze Growth Parameters
| Growth Parameters | Familiar
|
Novel
|
Practice Effect
|
|||
|---|---|---|---|---|---|---|
| M | SE | M | SE | M | SE | |
| Weighted population estimates | ||||||
| Fixed effects | ||||||
| Mean intercept | 17.48 | 0.38 | 18.82 | 0.36 | ||
| Mean slope | 0.40 | 0.01 | 0.18 | 0.01 | 0.22 | 0.02 |
| Random effects | ||||||
| Intercept variance | 85.65 | 5.18 | 67.38 | 4.72 | ||
| Slope variance | 0.05 | 0.004 | 0.02 | 0.004 | ||
| Intercept/slope covariance | 1.14 | 0.11 | 0.48 | 0.10 | ||
| Error variances | ||||||
| Wave 1 | 11.29 | 1.20 | 30.72 | 2.38 | ||
| Wave 2 | 15.23 | 1.10 | 23.31 | 1.69 | ||
| Wave 3 | 18.40 | 1.28 | 28.96 | 1.98 | ||
| Wave 4 | 23.13 | 1.68 | 30.04 | 2.17 | ||
| Wave 5 | 24.85 | 2.10 | 34.38 | 2.77 | ||
| Reader/intervention group estimates | ||||||
| Mean intercepts | ||||||
| Typical | 23.20 | 0.50 | 23.43 | 0.46 | ||
| Struggling–No Intervention | 13.02 | 0.66 | 14.64 | 0.73 | ||
| Struggling–Intervention | 13.55 | 0.55 | 14.47 | 0.52 | ||
| Mean slopes | ||||||
| Typical | 0.51 | 0.02 | 0.22 | 0.02 | 0.28 | 0.02 |
| Struggling–No intervention | 0.29 | 0.02 | 0.16 | 0.02 | 0.13 | 0.03 |
| Struggling–Intervention | 0.34 | 0.02 | 0.13 | 0.02 | 0.20 | 0.02 |
Note. Population estimates are weighted based on population proportions of Typical and Struggling students. All estimates based on multilevel growth modeling. Slope units are number of words correctly identified per week.
Including grade in the model did not change the effects. There was still a significant practice effect on slope, F(1, 1337) = 1249.79, p < .05, but there were no significant effects involving grade, Grade: F(2, 4027) = 2.37, p > .05; Grade × Passage Protocol: F(2, 4027) = 2.28, p > .05; Time × Grade: F(2, 4027) = 2.33, p > .05; and Time × Grade × Passage Protocol Group, F(2, 4027) = 0.43, p > .05.
However, including reduced-price/free lunch status (RFL) and reading achievement (TOWRE, WJPC) did affect the model. There was no difference between the Novel and Familiar groups in beginning-of-year Maze performance (i.e., Intercepts) when controlling for RFL, TOWRE, and WJPC, F(1, 1307) = 0.17, p > .05. There was a main effect of reduced-price/free lunch status, F(1, 3944) = 8.58, p < .05, such that, on average, Maze scores were 1.8 points lower for students on RFL versus students not on RFL. There were no significant interactions involving RFL. In particular, there was no difference in growth between students receiving RFL and those not receiving RFL, Time × RFL interaction, F(1, 3944) = .01, p > .05; nor did RFL status influence practice effects, that is, no Time × RFL × Passage Protocol interaction, F(1, 3944) = 2.72, p > .05.
Reading comprehension level did influence practice effects on slopes. There was a significant Time × WJPC × Passage Protocol Group interaction, F(1, 3944) = 3.97, p < .05. For every standard deviation increase in WJPC, there was a .04 increase in the practice effect on slopes (i.e., the difference in growth rate between Familiar and Novel conditions increases by .04 target words correct/week for each 12-point standard score increase in WJPC performance). For students with standard scores of 95 (mean WJPC achievement in this sample), the practice effect is .28 target words correct/week difference between Novel and Familiar slopes (for students not on RFL and who have a TOWRE score of 100—the mean TOWRE score in this sample) but for students with standard scores of 83 the practice effect is .24 and for students with standard scores of 107, the practice effect is .32. Word reading fluency did not influence practice effects on slopes. The Time × TOWRE × Passage Protocol interaction was not significant, F(1, 3944) = 0.03, p > .05.
In general, students higher in beginning-of-year TOWRE and WJPC performance were higher in beginning-of-year Maze performance, TOWRE: F(1, 3944) = 184.33, p < .05; WJPC: F(1, 3944) = 391.39, p < .05, and had greater growth in Maze performance during the year, Time × TOWRE: F(1, 3944) = 27.14, p <.05; Time × WJPC: F(1, 3944) = 66.71, p <.05.
Finally, we evaluated whether Reader/Intervention classification (Typical, Struggling–Intervention, Struggling–No Intervention) was related to practice effects. Table 6 shows mean intercept and slope estimates by reader/intervention classification and passage protocol assignment. Although there was a main effect of Passage Protocol Group on intercept, that is, students in the Novel condition had slightly higher intercepts than students in the Familiar condition, F(1, 1337) = 3.83, p < .06, within each of the three Reader/Classification groups, this effect was not significant. There was a significant Time × Reader/Intervention × Passage Protocol interaction, F(2, 4029) = 8.30, p < .05. Typical students demonstrated greater practice effects on slopes than Struggling students (p < .05), which is consistent with the finding that students with higher WJPC performance demonstrated greater practice effects on slopes. In addition, Struggling–Intervention students demonstrated greater practice effects on slopes than Struggling–No Intervention students (p < .06). Figure 1 illustrates these effects.
Figure 1.
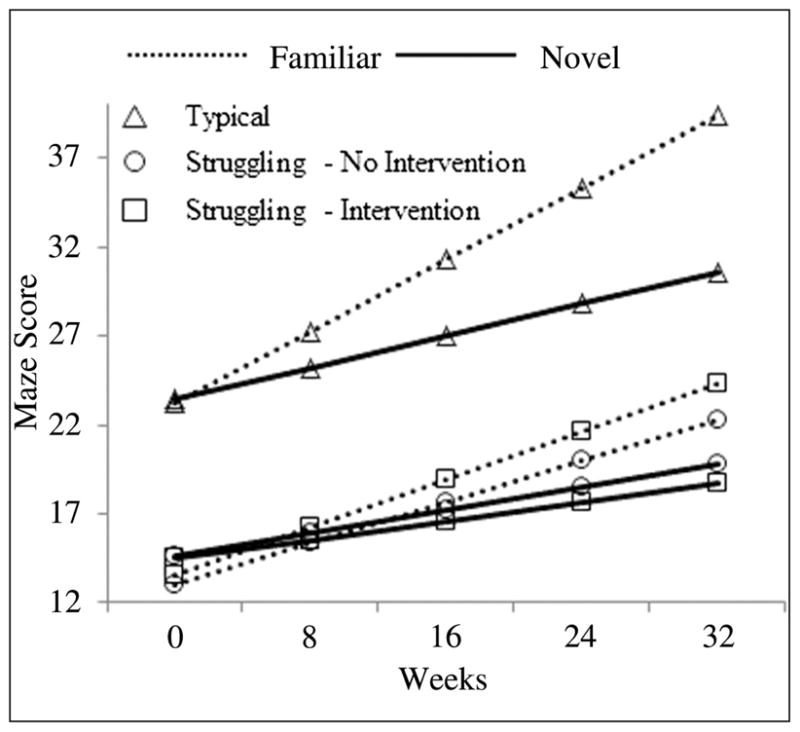
Practice effects by reader/intervention group. The practice effects are represented by the growing gaps between Familiar and Novel groups.
Discussion
We examined (a) the psychometric properties of the Maze task among middle-grade readers for familiar versus novel forms administered over time and (b) whether there were practice effects associated with using familiar versus novel forms over time and whether these practice effects differed by reading achievement. The term practice in this context means that students were repeatedly exposed to the same passage over time but were not provided corrective feedback on their performance on the specific passage.
Two general conclusions can be derived. First, among middle-grade readers, both familiar and novel progress-monitoring protocols are highly reliable and concurrent, and predictive validity coefficients are moderate. Second, slopes calculated from repeated testing across the school year were greater for students who read the same passage at each assessment than when students read a new passage each time. This practice effect on rates of change was significantly related to students’ reading comprehension and was stronger for typical than for struggling readers. In addition, the practice effect on rates of change was stronger for struggling students who received intervention than for struggling students who did not receive intervention.
Research Question 1: Psychometric Properties of Maze
To address the psychometric properties of the Maze task, we evaluated three properties: (a) form effects, (b) reliability and validity for Familiar versus Novel passage protocols, and (c) individual-level slopes and standard errors of slopes for Familiar versus Novel passage protocols. Regarding form effects, there was a 10- to 13-point difference in average Maze performance across passages depending on grade. These passage effects were not due to differences across groups in verbal knowledge, reading fluency, or reading comprehension. When group differences in verbal knowledge and reading achievement were controlled, passage still accounted for 6% to 13% of the variance in Maze performance across grades.
That a Maze test also exhibits form/passage effects when used with middle-grade students is consistent with prior work on ORF passages in the elementary grades (Ardoin & Christ, 2009; Christ & Ardoin, 2009; Dunn & Eckert, 2002; Francis et al., 2008; Hintze, Shapiro, & Lutz, 1994; Poncy, Skinner, & Axtell, 2005). The present study estimated the magnitude of passage effects on the AIMSweb Maze test through a random assignment process in which students were randomly assigned to specific sets of Maze passages. The assignment process further ensured that all Maze passages were represented in all assignment groups and at all measurement time points, across the school year. Of course, this randomization process is not user-friendly, and schools would never be expected to implement such a procedure. Moreover, use of this procedure was appropriate for the present study where we were interested in estimating average effects of conditions, but would not be useful for schools interested in making inferences about growth rates for individual students. In that context, raw scores for different passages should be equated. This equating process can be handled in several ways, but equipercentile equating or linear equating would be typical. In either of these approaches, a conversion table can be provided that converts raw scores on each form to an equated score that has statistically removed the effects of the specific form used to obtain the score (Francis et al., 2008). Using such an equating process makes it largely inconsequential which novel passage students are assigned to read over time.
Regarding the reliability and validity of the Maze task, the mean test–retest reliability coefficient was higher when children read the same passage each time (.86) than when alternate passages were read (.74). Thus, common form test–retest reliability exceeded alternate form test–retest reliability, which is not especially surprising. Mean concurrent and predictive validity coefficients were moderate for both Familiar and Novel passage conditions and did not differ between the two protocols. The validity estimates from this large sample study are at the higher end in relation to prior research on the validity of the Maze task, which reports convergent validity coefficients ranging from .00 to .75 and predictive validity coefficients ranging from .32 to .88 for students in the elementary to secondary grades (Espin & Foegen, 1996; Fuchs et al., 1988; Silberglitt et al., 2006; Ticha et al., 2009; Torgesen et al., 2005).
However, when looking specifically at past research conducted with students in the middle grades (Grades 6–8), validity coefficients were similar. Torgesen et al. (2005) report predictive validity coefficients ranging from 0.63 to 0.67 for students in Grades 6 and 8, respectively. Espin and Foegen (1996) reported predictive validity coefficients ranging from 0.56 to 0.62 for students in Grades 6 to 8. Further, Fuchs et al. (1988) reported predictive validity of 0.82 and criterion validity of 0.84 for older students with disabilities. Also noteworthy, each of these studies used a similar Maze procedure. Mazes were administered in paper-pencil format and the types of distracters were controlled.
Finally, the results of this study indicated that reading the same passage over multiple occasions resulted in higher slopes (i.e., rates of improved performance) than did reading novel passages over time. Differences in slopes across Grades 6 to 8 were minimal but were grade specific. Students who read the same passage throughout the school year had higher slopes, even when reduced-price/free lunch status and beginning-of-year reading were controlled. Correlations among slope and end-of-year reading performance were low to moderate regardless of whether familiar or novel passages were read, although the magnitude of relations was descriptively greater when slopes were based on reading familiar passages. Also consistent with this finding, standard errors for slopes were greater when students read novel passages at each time point, especially for students in the seventh and eighth grades.
Research Question 2: Practice Effects
The evidence that slopes were higher for students who read familiar passages throughout the school year suggests the possibility of practice effects in Grades 6 to 8. Interestingly, practice effects were related to beginning-of-year measures of reading comprehension but not to measures of reading fluency. We also found that the higher a student’s beginning-of-year reading, the higher their performance on the Maze task at the beginning of the year and the greater their growth in Maze performance during the school year. Consequently, typical students demonstrated greater practice effects than struggling readers. This may be because students with greater comprehension skills possessed greater background knowledge, more accurately integrated text-based information, were more familiar with the linguistic properties of words, and effectively integrated background knowledge with text-based information (Fuchs et al., 1988). Typically developing readers were also likely to more efficiently leverage these skills when reading the same passage over time. In addition, struggling readers receiving intervention demonstrated greater practice effects than struggling readers not receiving intervention. For struggling readers receiving intervention, the differential effects on Maze task performance may reflect the significant emphasis on specific comprehension strategy training in the intervention groups, although transfer to broader gains in comprehension was not observed.
Practice effects can be viewed from two different perspectives. The first is that practice effects are largely due to systematic variability that is not the variability of interest, that is, it is test-specific variance that influences scores directionally (i.e., positively or negatively). Because scores are biased, in this case positively, students’ true abilities are not precisely reflected by the observed score. To avoid this bias, alternate forms should be used. Use of alternate forms provides teachers with a more precise estimate of students’ generalized fluency and comprehension for grade-level texts. When measured with alternate forms, growth reflects the extent to which reading skills taught in class can be applied to a wider set of reading materials. Further, growth demonstrates that the reader is able to use and apply fundamental skills and specific cognitive processes across text types, contexts, and settings.
Alternately, the gains observed by students reading the same passage over time may reflect their ability to use newly formed cognitive strategies gained through instruction that would not otherwise be observed when novel passages are used. In a sense, the familiar Maze probe functions as a near-transfer task that measures students’ ability to comprehend reading materials that are both contextually and formally similar across measurement time points. In addition, the familiar Maze probe (a) controls for differences in background knowledge; (b) eliminates test-related artifacts (e.g., anxiety); (c) takes into account cultural and other group differences between students; and (d) helps teachers identify whether students mastered, applied, and reapplied critical knowledge (Grigorenko & Sternberg, 1998). It is also possible that students are retaining their understanding of the story so that fluency improves because comprehension processes use fewer resources. If students know what they are reading, they process incoming information more easily and are able to integrate a critical set of knowledge and reading skills, allowing them to develop a mental model of text and decode a core body of words fluently. Finally, there is also the possibility that students just remember the items.
Limitations of the Present Study
One limitation of the present study is the extent to which results generalize to other grades. It is important to further study the psychometric properties of Maze and the effects of practice to determine if a similar pattern of findings presents itself with earlier- and later-grade readers and across other progress-monitoring measures.
A second limitation is that all students did not receive a familiar and novel passage at each measurement time point. If students had received both measures, the effect of practice at the student level could be determined. Measures that capture within-student practice effects may be valuable tools for diagnosing and monitoring progress among struggling readers. However, future research is needed to determine whether such an effect exists within students and can be used as an indicator for the effectiveness of interventions, and whether practice effects can predict other outcomes.
There was a violation of the passage assignment protocol in which 55 students (8%) in the Novel condition read the same passage in two of the five assessment periods. This may have resulted in a slight underestimation of differences in growth rates between Familiar and Novel conditions.
The length of time between assessments (6–8 weeks) also likely underestimated the difference in growth rates between Familiar and Novel conditions. In a meta-analysis, Hausknecht et al. (2007) found that practice effects for the same form were related to length of time between assessments (i.e., less time, greater practice effect). However, the meta-analysis was based on tests of achievement (e.g., SAT). Future studies are needed to evaluate how timing of assessments influence Maze practice effects in a progress-monitoring context.
Finally, because the sample for this study was stratified by design and weighting techniques were used to estimate population statistics, some caution should be used in interpreting the results. However, further research on the use of Familiar versus Novel Maze forms seems warranted.
Implications for Practice
The results of this study demonstrate that assessing middle-grade students in intervention with the same passage across measurement time points provides information about their progress that would not be apparent when assessing performance with novel material. For classroom teachers, use of the same passage over time provides information on students’ ability to use background information, integrate relevant text-based information in the text, understand linguistic properties of words, and generate inferences (Fuchs et al., 1988). For students with severe reading difficulties, such mastery is often not observable when using novel passages across time. From an instructional perspective, use of the same passage may provide readers with an opportunity to demonstrate what they have mastered and their ability to apply and reapply knowledge. From a measurement perspective, measurement bias may be more of a concern among typical and struggling students receiving specialized instruction or intervention than struggling students who are not receiving intervention. The results support giving the familiar and novel passages for progress-monitoring assessments of reading growth, depending on context. However, practitioners must be aware that use of the familiar passage over time may represent a near-transfer task, whereas use of the novel passage may represent a far-transfer task.
This study also demonstrates one way of reducing SEb by using the same form over time. The result is better precision for slopes and high correlations between slopes and other assessments of reading than with novel forms, possibly because the slopes are less noisy (i.e., have less random error). Of course, in this study, students were assessed five times once every 6 to 8 weeks. A shorter interval between testing days might lead to more “learning” the test and less generalization.
Although the concern about the precision of the slope is important and leads to improvements in the assessment of progress, consideration should be given to how the remaining lack of precision affects the decision process that is central to the use of progress-monitoring assessments. If decisions are made by practitioners at the individual level based on individual rates of growth and individual levels of precision (SEbi) then who is most likely to be adversely affected by the lack of precision? For students who grow at expected or better rates and who show small dispersion around their growth trajectory, the most likely decision to make is that they are progressing adequately, and this decision can be made with a low rate of error. For students who show good growth, but who have poor precision because of larger individual dispersion, the lack of precision would most likely prevent a decision of adequate growth, which would lead to the collection of more data and would delay the decision until better precision is available. Five additional weeks of data collection will reduce the SEb substantially (Christ, 2006). For students whose rate of growth is low and who have good precision, it is unlikely that a practitioner would incorrectly assume that their growth is actually adequate. Finally, for students who show low growth and poor precision, while on average their change is poor, they do show some higher than expected values, which leads to a large SEbi, which makes it hard to say there is actual growth. Again, additional data collection would allow a more precise estimate of the growth rate. It should be noted that just as increasing the number of times of testing increases precision, spreading few measurements out over a longer period of time may also increase precision by increasing the variance in timing (see formula for SEbi).
In summary, for low-performing students, the use of familiar passages to assess progress seems justified given the increased precision of the estimates of growth and the possibility of capturing learning that might otherwise be missed. Regardless of the precision of the estimate, for these students, data should be collected so long as there is a question about whether or not students are improving at an acceptable rate. Given that level of performance on familiar passages are just as predictive of reading outcomes as novel passages and that slopes for familiar passages are more predictive than novel slopes, use of familiar passages will likely provide as much information as novel passages about how these students are likely to perform on external assessments of reading.
Acknowledgments
Funding
The authors disclosed receipt of the following financial support for the research, authorship, and/or publication of this article: This article was supported in part by a grant from the National Institute of Child Health and Human Development, P50 HD052117, Texas Center for Learning Disabilities.
Footnotes
Maze scores were treated as missing if they were not collected within the range of time determined for each wave (e.g., first wave from September 6 to November 7 of the school year). Scores were also treated as missing if they were outside 1.5 of the interquartile range (IQR) of scores for the wave or if they were outside 1.5 of the IQR of within-student score ranges. Students were excluded if Maze scores were missing at any testing wave, either because they were not measured or because their scores were outliers. Although growth modeling can handle missing data, for the purposes of psychometric analysis (e.g., test–retest, predictive validity), only students who had all measures at all assessment waves and did not have extreme outlier values were included.
Reprints and permission: http://www.sagepub.com/journalsPermissions.nav
Declaration of Conflicting Interests
The authors declared no potential conflicts of interest with respect to the research, authorship, and/or publication of this article.
References
- Ardoin SP, Christ TJ. Curriculum-based measurement of oral reading: Standard errors associated with progress monitoring outcomes from DIBELS, AIMSweb, and an experimental passage set. School Psychology Review. 2009;38:266–283. [Google Scholar]
- Ardoin SP, Witt JC, Suldo SM, Connell JE, Koening JL, Resetar JL, Williams KL. Examining the incremental benefits of administering a Maze and three versus one curriculum-based measurement reading probes when conducting universal screening. School Psychology Review. 2004;33:218–233. [Google Scholar]
- Brown-Chidsey R, Davis L, Maya C. Sources of variance in curriculum-based measures of silent reading. Psychology in the Schools. 2003;40:363–377. [Google Scholar]
- Catts HW, Fey ME, Zhang X, Tomblin BJ. Language basis of reading and reading disabilities: Evidence from a longitudinal investigation. Scientific Studies of Reading. 1999;3:331–361. [Google Scholar]
- Christ TJ. Short-term estimates of growth using curriculum-based measurement of oral reading fluency: Estimates of standard error of slope to construct confidence intervals. School Psychology Review. 2006;35:128–133. [Google Scholar]
- Christ TJ, Ardoin SP. Curriculum-based measurement of reading: Passage equivalence and selection. Journal of School Psychology. 2009;47:55–75. [Google Scholar]
- Cohen J, Cohen P, West SG, Aiken LS. Applied multiple regression/correlation analysis for the behavioral sciences. 3. Mahwah, NJ: Lawrence Erlbaum; 2003. [Google Scholar]
- Deno S, Mirkin P, Chiang B. Identifying valid measures of reading. Exceptional Children. 1982;49:524–597. [PubMed] [Google Scholar]
- Dodrill CB, Troupin AS. Effects of repeated administrations of a comprehensive neuropsychological battery among chronic epileptics. Journal of Nervous and Mental Disease. 1975;161:185–190. doi: 10.1097/00005053-197509000-00006. [DOI] [PubMed] [Google Scholar]
- Dunn EK, Eckert TL. Curriculum-based measurement in reading: A comparison of similar versus challenging material. School Psychology Quarterly. 2002;17:24–46. [Google Scholar]
- Espin CA, Foegen A. Validity of general outcome measures for predicting secondary students’ performance on content-area tasks. Exceptional Children. 1996;62:497–514. [Google Scholar]
- Espin CA, Wallace T, Lembke E, Campbell H, Long JD. Creating a progress-monitoring system in reading for middle-school students: Tracking progress toward meeting high-stakes standards. Learning Disabilities Research & Practice. 2010;25:60–75. [Google Scholar]
- Francis DJ, Fletcher JM, Stuebing KK, Lyon GR, Shay-witz BA, Shaywitz SE. Psychometric approaches to the identification of LD: IQ and achievement scores are not sufficient. Journal of Learning Disabilities. 2005;38:98–108. doi: 10.1177/00222194050380020101. [DOI] [PubMed] [Google Scholar]
- Francis DJ, Santi KL, Barr C, Fletcher JM, Varisco A, Foorman BR. Form effects on the estimation of students’ oral reading fluency using DIBELS. Journal of School Psychology. 2008;46:315–342. doi: 10.1016/j.jsp.2007.06.003. [DOI] [PMC free article] [PubMed] [Google Scholar]
- Francis DJ, Schatschneider C, Carlson C. Introduction to individual growth curve analysis. In: Drotar D, editor. Handbook of research in pediatrics and clinical child psychology. New York, NY: Kluwer Academic/Plenum; 2000. [Google Scholar]
- Fuchs LS, Fuchs D. Identifying a measure for monitoring student reading progress. School Psychology Review. 1992;21:45–58. [Google Scholar]
- Fuchs LS, Fuchs D, Maxwell L. The validity of informal reading comprehension measures. Remedial and Special Education. 1988;9:20–28. [Google Scholar]
- Fuchs LS, Fuchs D, Maxwell L. Treatment validity as a unifying construct for identifying learning disabilities. Learning Disability Quarterly. 2002;25:33–45. [Google Scholar]
- Griffith A, VanDerHeyden AM, Skokut M, Lilles E. Progress monitoring in oral reading fluency within the context of response to intervention. School Psychology Quarterly. 2009;24:13–23. [Google Scholar]
- Grigorenko E, Sternberg R. Dynamic testing. Psychological Bulletin. 1998;124:75–111. [Google Scholar]
- Guthrie JT. Reading comprehension and syntactic responses in good and poor readers. Journal of Educational Psychology. 1973;65:294–299. doi: 10.1037/h0035643. [DOI] [PubMed] [Google Scholar]
- Hausknecht JP, Halpert JA, DiPaolo N, Gerrard MO. Retesting in selection: A meta-analysis of coaching and practice effects for tests of cognitive ability. Journal of Applied Psychology. 2007;92:373–385. doi: 10.1037/0021-9010.92.2.373. [DOI] [PubMed] [Google Scholar]
- Hausknecht JP, Trevor CO, Farr J. Retaking ability tests in a selection setting: Implications for practice effects, training performance, and turnover. Journal of Applied Psychology. 2002;87:243–254. doi: 10.1037/0021-9010.87.2.243. [DOI] [PubMed] [Google Scholar]
- Hintze JM, Christ TJ. An examination of variability as a function of passage variance in CBM progress monitoring. School Psychology Review. 2004;33:204–217. [Google Scholar]
- Hintze JM, Shapiro ES, Lutz JG. The effects of curriculum on the sensitivity of curriculum-based measurement in reading. Journal of Special Education. 1994;28:188–202. [Google Scholar]
- Jenkins JR, Jewell R. Examining the validity of two measures for formative teaching: Reading aloud and Maze. Exceptional Children. 1993;59:421–432. [Google Scholar]
- Jenkins JR, Zumeta R, Dupree O, Johnson K. Measuring gains in reading ability with passage reading fluency. Learning Disabilities Research & Practice. 2005;20:245–253. [Google Scholar]
- Kaufman AS, Kaufman NL. Kaufman Brief Intelligence Test manual. Circle Pines, MN: AGS; 2004. [Google Scholar]
- Lee ES, Forthofer RN, Lorimor RJ. Analyzing complex survey data. London: Sage; 1989. [Google Scholar]
- Lezak MD. Neuropsychological assessment. 3. New York, NY: Oxford University Press; 1995. [Google Scholar]
- National Center on Student Progress Monitoring. What is progress monitoring? 2010 Retrieved from http://www.studentprogress.org.
- Poncy BC, Skinner CH, Axtell PK. An investigation of the reliability and standard error of measurement of words read correctly per minute using curriculum-based measurement. Journal of Psychoeducational Assessment. 2005;23:326–338. [Google Scholar]
- Powers DE, Rock DA. Effects of coaching on SAT I: Reasoning test scores. Journal of Educational Measurement. 1999;36:93–118. [Google Scholar]
- Reschly A, Busch T, Betts J, Deno S, Long J. Curriculum-based measurement oral reading as an indicator of reading achievement: A meta-analysis of the correlational evidence. Journal of School Psychology. 2009;47:427–469. doi: 10.1016/j.jsp.2009.07.001. [DOI] [PubMed] [Google Scholar]
- Shinn MR, Deno SL, Espin CA. Technical adequacy of the Maze task for curriculum-based measurement of reading growth. Journal of Special Education. 2000;34:164–172. [Google Scholar]
- Shinn MR, Good R, Knutson N, Tilly W, Collins V. Curriculum-based measurement of oral reading fluency: A confirmatory analysis of its relation to reading. School Psychology Review. 1992;21:459–479. [Google Scholar]
- Shinn MR, Shinn MM. AIMSweb training workbook: Administration and scoring of reading Maze for use in general outcome measurement. Eden Prairie, MN: Edformation; 2002. [Google Scholar]
- Silberglitt B, Burns MK, Madyun N, Lail KE. Relationship of reading fluency assessment data with state accountability test scores: A longitudinal comparison of grade levels. Psychology in Schools. 2006;43:527–535. [Google Scholar]
- Slade PD, Towner BD, Rosenbaum G, Martins IP, Luis H, Bernardo M, DeRouen TA. The serial use of child neurocognitive tests: Development versus practice effects. Psychological Assessment. 2008;20:361–369. doi: 10.1037/a0012950. [DOI] [PubMed] [Google Scholar]
- Texas Educational Agency. TAKS: Texas Assessment of Knowledge and Skills. 2008 Retrieved from http://www.tea.state.tx.us/index3.aspx?id=3839&menu_id=793.
- Ticha R, Espin C, Wayman MW. Reading progress monitoring for secondary-school students: Reliability, validity, and sensitivity to growth of reading aloud and Maze selection measures. Learning Disabilities Research & Practice. 2009;24:132–142. [Google Scholar]
- Torgesen JK, Nettle S, Howard P, Winterbottom R. Brief report of a study to investigate the relationship between several brief measures of reading fluency and performance on the Florida Comprehensive Assessment Test—Reading in 4th, 6th, 8th, and 10th grades. FCRR Technical Report 6. 2005 Retrieved from http://www.fcrr.org/TechnicalReports/Progress_monitoring_report.pdf.
- Torgesen JK, Wagner R, Rashotte C. Test of Word Reading Efficiency. Austin, TX: Pro-Ed; 1999. [Google Scholar]
- Vaughn S, Cirino PT, Wanzek J, Wexler J, Fletcher JM, Denton C, Francis DJ. Response to intervention for middle school students with reading difficulties: Effects of a primary and secondary intervention. School Psychology Review. 2010a;39:3–21. [PMC free article] [PubMed] [Google Scholar]
- Vaughn S, Wanzek J, Wexler J, Barth AE, Cirino PT, Fletcher JM, Francis DJ. The relative effects of group size on reading progress of older students with reading difficulties. Reading and Writing: An Interdisciplinary Journal. 2010b;23:931–956. doi: 10.1007/s11145-009-9183-9. [DOI] [PMC free article] [PubMed] [Google Scholar]
- Wayman C, Wallace T, Wiley H, Ticha R, Espin C. Literature synthesis on curriculum-based measurement in reading. Journal of Special Education. 2007;41:85–120. [Google Scholar]
- Williams KT. Group Reading Assessment and Diagnostic Evaluation. Circle Pines, MN: American Guidance Services; 2002. [Google Scholar]
- Woehlke AB, Wilder DH. Differences in difficulty of Forms A and B of the Otis Self-Administering Test of Mental Ability. Personnel Psychology. 1963;16:395–398. [Google Scholar]
- Woodcock RW, McGrew KS, Mather N. Woodcock-Johnson III Tests of Achievement. Itasca, IL: Riverside; 2001. [Google Scholar]