Abstract
The ability to control the localization of surface-enhanced Raman scattering (SERS) nanoparticle probes in bacterial cells is critical to the development of analytical techniques that can nondestructively determine cell composition and phenotype. Here, selective localization of SERS probes was achieved at the outer bacterial membrane by using silver nanoparticles functionalized with synthetic hydrophobic peptides.
TEXT
The ability to chemically characterize microbial phenotypes in real time and nondestructively is a critical development for both industrial and clinical microbiology. Surface-enhanced Raman scattering (SERS) methods are of interest for this task because of their exceptional analytical sensitivity with nanometer scale localized selectivity (1, 2, 21). With SERS, Raman scattering from a molecule is enhanced several orders of magnitude when it is in the proximity of a metal substrate (1). This has profound potential for the investigation of biological systems (21). However, the extreme biomolecular complexity of the intracellular matrix poses a major challenge to the use of SERS to study microbial phenotypes and cell composition (2). SERS spectra of bacteria are highly irreproducible and difficult to interpret because metal nanoparticles, often used as SERS substrates (or probes), disperse randomly throughout the cell (2, 12, 16, 21). This approach results in convoluted SERS spectra composed of contributions from biochemicals of diverse intracellular environments simultaneously. Therefore, the ability to control the localization of SERS probes inside the cell is critical to the production of minimal SERS spectra capable of being deconvoluted to resolve chemical composition and phenotype data for localized intracellular environments independently.
Metal nanoparticles, conjugated with a variety of ligands, have been used as intracellular SERS probes with exceptional selectivity for the purposes of imaging and detection, but these have not been designed to determine cell composition or phenotype (4, 14, 17, 20). Zeiri et al. (24) developed protocols to direct the production of silver nanoparticles (SNPs) to either the cytosol of a bacterium or to the cell wall. The resulting SERS spectra reflected the biochemical environment surrounding SNPs. However, intracellular synthesis of SNPs required the use of toxic reagents and the potential to localize these SNPs was limited (2). Recently, Xie et al. (22) developed nuclear targeting SERS probes by using gold nanoparticles functionalized with a nuclear localization signal peptide. The probes were used to generate SERS spectra of the HeLa cell nucleus, and these spectra were found to contain abundant information about the nuclear environment. Despite their usefulness, these probes are limited to eukaryotic cells and target only a single intracellular environment. Since the nucleus is relatively large and chemically diverse, the resulting spectra contained substantial variation (22).
Here, we demonstrate the ability to direct SERS probes to the outer membrane of Escherichia coli cells using SNPs conjugated with a synthetic peptide (CVATIVILFVA) derived from a transmembrane domain in fumarate reductase subunit C, which is part of the membrane-bound fumarate reductase complex (6). An in vivo SERS spectrum specific to the E. coli outer membrane was obtained. The spectrum was reproducible and contained several Raman signatures of macromolecules known to be localized in the outer membrane environment. This new technique is referred to as peptide-guided SERS (pgSERS), and it represents a step forward toward the achievement of analytical specificity within a complex biomolecular system.
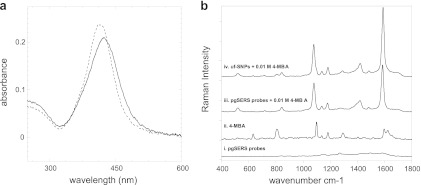
The pgSERS probes (SNPs conjugated with synthetic peptides) were prepared by incubating SNPs (40-nm diameter, 0.02-mg/ml suspension) with the synthetic peptide (in solution at 1 mg/ml) at a ratio of 5:1 for 2 h at room temperature. Peptides were conjugated covalently to SNPs through the N-terminal cysteine, which was present in the synthetic peptide for this purpose. SNP functionalization was confirmed using UV/Vis spectroscopy (Fig. 1a), which showed that the peak plasmon resonance shifted and broadened as a result of the change in the surface chemistry of the SNPs caused by peptide conjugation. Next, it was critical to investigate whether the conjugated peptide made significant contributions to the SERS signal. This was done by obtaining spectra of the common Raman reporter 4-mercaptobenzoic acid (4-MBA) in the presence and absence of unfunctionalized SNPs (uf-SNPs) and pgSERS probes (Fig. 1b). The weak Raman signal from the peptides attached to the SNP surface did not inhibit the ability to enhance Raman scattering of 4-MBA. The spectrum of 4-MBA obtained in the presence of pgSERS probes resembles the SERS spectrum of 4-MBA obtained with uf-SNPs and was different from the normal Raman spectrum of 4-MBA (Fig. 1b). It is often the case that the normal Raman and SERS spectra of the same compound are not the same (3, 5). Thus, the pgSERS probes were found to enhance the Raman signal from molecules of the environment with minimal influence resulting from the probes themselves. Spectra were collected with a Senterra Raman spectrometer (Bruker Optics, Billerica, MA) with a 532-nm laser, 2 mW of laser power, and a 1-s exposure time.
Fig 1.
(a) Comparison of UV/Vis absorption spectra of uf-SNPs (dashed line) and pgSERS probes (solid line). Spectra shown are averages of three measurements. (b) Raman spectra of (i) dried pgSERS probes, (ii) 4-MBA, (iii) 4-MBA enhanced by pgSERS probes, and (iv) 4-MBA enhanced by uf-SNPs. Each spectrum represents the average of 20 independently obtained spectra.
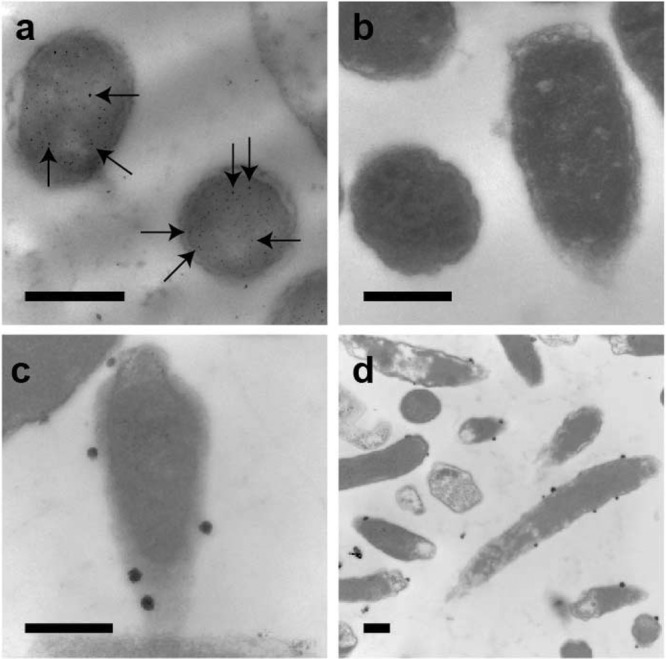
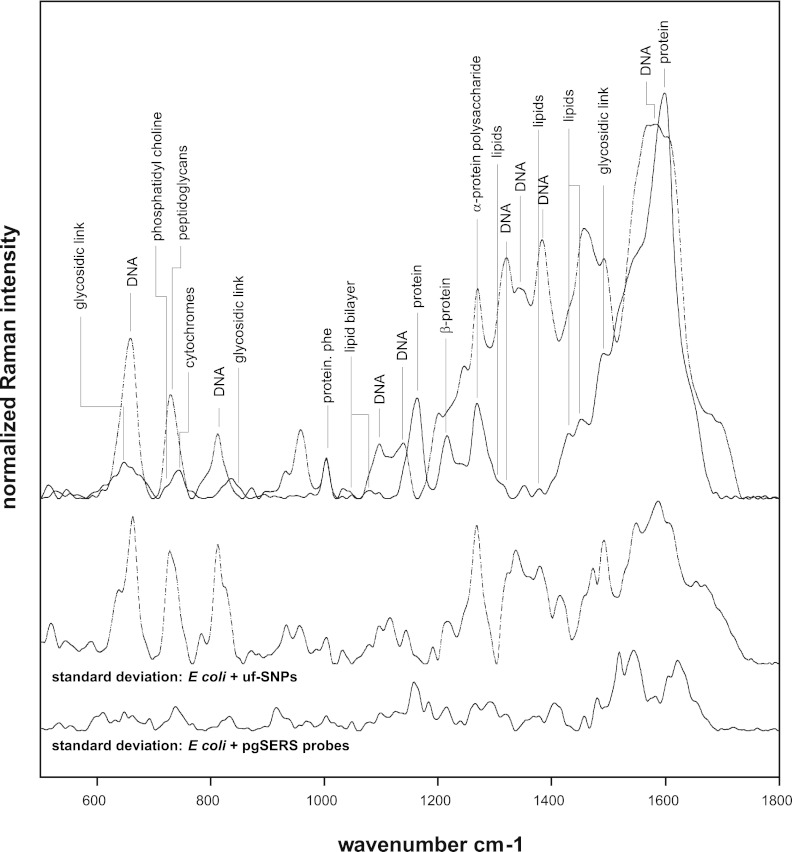
When incubated with E. coli cells, the uf-SNPs were distributed randomly throughout the cell (Fig. 2a). In contrast, the pgSERS probes formed aggregates that were confined at the cell membrane (Fig. 2c and d). The spectra collected using uf-SNPs were composed of scattering from all of the molecules in the vicinity of the uf-SNPs located in all biochemical environments of the cell (Fig. 3). This resulted in a high degree of variance, as indicated by the standard deviation spectrum (Fig. 3). In contrast, pgSERS spectra were more reproducible. It is hypothesized this is because the pgSERS probes were confined to a localized uniform biochemical environment (Fig. 3). It is noted that some variability in the pgSERS spectra of the cell membrane will always exist because of the dynamic nature of the cell surface (8). Since the attainment of reproducible spectra is arguably the major challenge to quantitative SERS analysis, the pgSERS approach represents an important development that can potentially be used in future research to facilitate the quantitative characterization of specifically targeted cellular environments.
Fig 2.

Localization of uf-SNPs and pgSERS probes. Representative transmission electron microscopic images of ultrathin cross sections of E. coli DH5α cells fixed and embedded in LR White resin are shown. Dark spots are SNPs. (a) Cells mixed with uf-SNPs (uniform dispersion throughout the cell). (b) A control sample with no SNPs added. (c and d) Cells mixed with hydrophobic functionalized pgSERS probes (aggregation and localization at the hydrophobic cell membrane). Scale bars are 500 nm. The arrows in panel a point to several uf-SNPs. These were dispersed randomly throughout the cells.
Fig 3.
Overlaid averaged (n = 10) SERS Raman spectra of E. coli DH5α cells (top) mixed with uf-SNPs (dashed line) and pgSERS probes (solid line). Peaks were assigned according to cited literature references. The corresponding standard deviation spectra are shown (bottom) for comparison. The pgSERS probes result in more reproducible Raman spectra.
The origin of the band at 730 cm−1 in the SERS spectra of E. coli was previously assigned to peptidoglycan structures present at the inner membrane by two independent groups (7, 24). This peak was not present when pgSERS probes were used (Fig. 3), suggesting that the pgSERS probes were selectively localized at the outer cell membrane only, away from peptidoglycan structures. This conclusion was further supported by the comparison of spectral features that differ when using uf-SNPs and pgSERS probes (Fig. 3). The spectra in Fig. 3 were collected with a 532-nm laser at 0.2 mW and a 50-s scanning time. Peaks at 1,580, 1,383, 1,342, 1,321, 1,139, 1,097, 812, and 660 cm−1 in the SERS spectra of E. coli (Fig. 3) are commonly assigned to DNA, RNA, or their components (7, 9, 13, 19, 21, 24). These peaks either (i) shifted, (ii) were significantly reduced in intensity, or (iii) were not present when the pgSERS probes were used. Since DNA is generally distributed throughout the cytoplasm (and absent from the cell surface) (18), this demonstrates the ability of the pgSERS probes to selectively target the cell surface. In addition, the pgSERS spectra contained many features assignable to components at the cell membrane, such as saccharides (1,490, 1,268, 850, and 647 cm−1), lipids (1,452, 1,430, 1,378, 1,300, 1,079, 1,049, and 717 cm−1), and proteins (1,612, 1,365, 1,269, 1,216, 1,179, 1,015, 850, and 762 cm−1). Interestingly, the strong peaks at 1,216 and 1,269 cm−1 are characteristic of β-sheet and α-helix protein secondary structures, respectively (10, 11). This is consistent with the presence of the β-barrel proteins (porins) across the outer membrane of Gram-negative bacteria (15) and an abundance of α-helical transmembrane proteins. The shoulder at 719 cm−1 in the pgSERS spectrum corresponds to C-C-N+ symmetric stretching in phosphatidylcholine, a major constituent of cellular membranes (9). The peak at 744 cm−1 has been attributed to the membrane-bound cytochromes, hemoproteins that contain heme groups and carry out electron transport (19, 23).
The pgSERS approach developed in this research is an effective method for reducing the complexity of SERS analysis of bacterial cells. To demonstrate this approach, SNPs conjugated with a synthetic peptide were used to successfully localize SERS probes at the outer membrane of E. coli cells. The resulting spectra were found to effectively represent the outer membrane environment, and spectrum reproducibility was enhanced because pgSERS probes were confined to a relatively homogeneous biomolecular environment. While significantly more developments are still needed, this approach has the potential to enable quantitative phenotype characterization of bacterial cultures in real time using a nondestructive approach. One of these future developments includes the replacement of SNPs with nanoparticles that minimize toxicity and do not elicit a cellular response. Other necessary developments include the design of new synthetic peptides to explore additional localized intracellular environments. The approach presented here represents the first proof of concept of the pgSERS methodology.
ACKNOWLEDGMENTS
A.I.M.A. was supported by a grant from the Biodesign and Bioprocessing Research Center at Virginia Tech. TEM samples were partially prepared and analyzed at the electron microscopy facility at the Virginia-Maryland Regional College of Veterinary Medicine, Blacksburg, VA.
Footnotes
Published ahead of print 24 August 2012
REFERENCES
- 1. Aroca R. 2006. Surface-enhanced vibrational spectroscopy. Wiley, Hoboken, NJ [Google Scholar]
- 2. Efrima S, Zeiri L. 2009. Understanding SERS of bacteria. J. Raman Spectrosc. 40:277–288 [Google Scholar]
- 3. Fleger Y, Mastai Y, Rosenbluh M, Dressler DH. 2009. Surface enhanced Raman spectroscopy of aromatic compounds on silver nanoclusters. Surf. Sci. 603:788–793 [Google Scholar]
- 4. Gregas MK, Scaffidi JP, Lauly B, Vo-Dinh T. 2010. Surface-enhanced Raman scattering detection and tracking of nanoprobes: enhanced uptake and nuclear targeting in single cells. Appl. Spectrosc. 64:858–866 [DOI] [PubMed] [Google Scholar]
- 5. Hunyadi SE, Murphy CJ. 2006. Bimetallic silver-gold nanowires: fabrication and use in surface-enhanced Raman scattering. J. Mater. Chem. 16:3929–3935 [Google Scholar]
- 6. Iverson TM, Luna-Chavez C, Cecchini G, Rees DC. 1999. Structure of the Escherichia coli fumarate reductase respiratory complex. Science 284:1961–1966 [DOI] [PubMed] [Google Scholar]
- 7. Jarvis RM, Goodacre R. 2004. Discrimination of bacteria using surface-enhanced Raman spectroscopy. Anal. Chem. 76:40–47 [DOI] [PubMed] [Google Scholar]
- 8. Neugebauer U, et al. 2006. On the way to nanometer-sized information of the bacterial surface by tip-enhanced Raman spectroscopy. Chem. Phys. Chem. 7:1428–1430 [DOI] [PubMed] [Google Scholar]
- 9. Notingher I. 2007. Raman spectroscopy cell-based biosensors. Sensors 7:1343–1358 [Google Scholar]
- 10. Ochsenkühn MA, Jess PRT, Stoquert H, Dholakia K, Campbell CJ. 2009. Nanoshells for surface-enhanced Raman spectroscopy in eukaryotic cells: cellular response and sensor development. ACS Nano 3:3613–3621 [DOI] [PubMed] [Google Scholar]
- 11. Podstawka E, Ozaki Y, Proniewicz LM. 2004. Adsorption of S-S containing proteins on a colloidal silver surface studied by surface-enhanced Raman spectroscopy. Appl. Spectrosc. 58:1147–1156 [DOI] [PubMed] [Google Scholar]
- 12. Premasiri WR, Gebregziabher Y, Ziegler LD. 2011. On the difference between surface-enhanced Raman scattering (SERS) spectra of cell growth media and whole bacterial cells. Appl. Spectrosc. 65:493–499 [DOI] [PMC free article] [PubMed] [Google Scholar]
- 13. Premasiri WR, et al. 2005. Characterization of the surface enhanced Raman scattering (SERS) of bacteria. J. Phys. Chem. B 109:312–320 [DOI] [PubMed] [Google Scholar]
- 14. Qian X, et al. 2008. In vivo tumor targeting and spectroscopic detection with surface-enhanced Raman nanoparticle tags. Nat. Biotechnol. 26:83–90 [DOI] [PubMed] [Google Scholar]
- 15. Schulz GE. 1993. Bacterial porins: structure and function. Curr. Opin. Cell Biol. 5:701–707 [DOI] [PubMed] [Google Scholar]
- 16. Smith-Palmer T, Douglas C, Fredericks P. 2010. Rationalizing the SER spectra of bacteria. Vib. Spectrosc. 53:103–106 [Google Scholar]
- 17. Sun L, Irudayaraj J. 2009. Quantitative surface-enhanced Raman for gene expression estimation. Biophys. J. 96:4709–4716 [DOI] [PMC free article] [PubMed] [Google Scholar]
- 18. Toro E, Shapiro L. 2010. Bacterial chromosome organization and segregation. Cold Spring Harb. Perspect. Biol. 2:a000349. [DOI] [PMC free article] [PubMed] [Google Scholar]
- 19. Walter A, et al. 2011. Raman spectroscopic detection of physiology changes in plasmid-bearing Escherichia coli with and without antibiotic treatment. Anal. Bioanal. Chem. 400:2763–2773 [DOI] [PubMed] [Google Scholar]
- 20. Weissleder R, Kelly K, Sun EY, Shtatland T, Josephson L. 2005. Cell-specific targeting of nanoparticles by multivalent attachment of small molecules. Nat. Biotechnol. 23:1418–1423 [DOI] [PubMed] [Google Scholar]
- 21. Willets K. 2009. Surface-enhanced Raman scattering (SERS) for probing internal cellular structure and dynamics. Anal. Bioanal. Chem. 394:85–94 [DOI] [PubMed] [Google Scholar]
- 22. Xie W, et al. 2009. Nuclear targeted nanoprobe for single living cell detection by surface-enhanced Raman scattering. Bioconjug. Chem. 20:768–773 [DOI] [PubMed] [Google Scholar]
- 23. Yang X, Gu C, Qian F, Li Y, Zhang JZ. 2011. Highly sensitive detection of proteins and bacteria in aqueous solution using surface-enhanced Raman scattering and optical fibers. Anal. Chem. 83:5888–5894 [DOI] [PubMed] [Google Scholar]
- 24. Zeiri L, Bronk BV, Shabtai Y, Eichler J, Efrima S. 2004. Surface-enhanced Raman spectroscopy as a tool for probing specific biochemical components in bacteria. Appl. Spectrosc. 58:33–40 [DOI] [PubMed] [Google Scholar]


