

Abstract
Field studies in fresh and marine waters consistently show diel fluctuations in concentrations of enterococci, indicators of water quality. We investigated sunlight inactivation of Enterococcus faecalis to gain insight into photoinactivation mechanisms and cellular responses to photostress. E. faecalis bacteria were exposed to natural sunlight in clear, filtered seawater under both oxic and anoxic conditions to test the relative importance of oxygen-mediated and non-oxygen-mediated photoinactivation mechanisms. Multiple methods were used to assess changes in bacterial concentration, including cultivation, quantitative PCR (qPCR), propidium monoazide (PMA)-qPCR, LIVE/DEAD staining using propidium iodide (PI), and cellular activity, including ATP concentrations and expression of the superoxide dismutase-encoding gene, sodA. Photoinactivation, based on numbers of cultivable cells, was faster in oxic than in anoxic microcosms exposed to sunlight, suggesting that oxygen-mediated photoinactivation dominated. There was little change in qPCR signal over the course of the experiment, demonstrating that the nucleic acid targets were not damaged to a significant extent. The PMA-qPCR signal was also fairly stable, consistent with the observation that the fraction of PI-permeable cells was constant. Thus, damage to the membrane was minimal. Microbial ATP concentrations decreased in all microcosms, particularly the sunlit oxic microcosms. The increase in relative expression of the sodA gene in the sunlit oxic microcosms suggests that cells were actively responding to oxidative stress. Dark repair was not observed. This research furthers our understanding of photoinactivation mechanisms and the conditions under which diel fluctuations in enterococci can be expected in natural and engineered systems.
INTRODUCTION
Health risks posed by exposure to polluted recreational waters are assessed using levels of the fecal indicator bacteria Enterococcus spp. and Escherichia coli. The concentrations of these bacteria, however, are known to be highly variable (6, 7, 59, 60). Intensive field studies show that their concentrations fluctuate on diurnal timescales due to sunlight exposure; concentrations drop during sunlit hours and rise after the sun sets (8, 21, 50, 60, 61). While enterococcal photoinactivation is well documented, the mechanisms of inactivation are not well understood, limiting our ability to predict when the process will be important under the wide range of conditions that exist in natural and engineered systems.
Bacterial photoinactivation is the result of direct and indirect damage caused by sunlight exposure. Direct damage occurs when photons are absorbed directly by cellular molecules, leading to changes in chemical bond structure. The most common example is UVB damage to DNA, resulting in pyrimidine dimers that prevent DNA replication (39, 47, 51). Indirect damage can occur when photons are absorbed by endogenous (intracellular) sensitizers, such as porphyrins and flavins, or exogenous (extracellular) sensitizers, such as humic compounds (17). Excited sensitizers transfer energy or electrons to other parts of the cell, causing damage, or to molecular oxygen, producing reactive oxygen species (ROS) that cause photooxidative damage (38). Depending on whether energy or electrons are transferred to molecular oxygen, ROS such as singlet oxygen, superoxide, hydrogen peroxide, and hydroxyl radicals are formed and can damage membrane lipids, proteins, enzymes, or nucleic acids (14, 31, 38, 39, 49).
Previous research on bacterial photoinactivation mechanisms has focused on E. coli (5, 13, 15). Limited work has specifically explored the relative contributions of exogenous and endogenous indirect photoinactivation with E. coli (41). Studies have emphasized the importance of oxygen-mediated indirect mechanisms for E. coli photoinactivation (11, 17, 18, 41, 44, 48). Reed (48) reported a marked decrease in culturability for both E. coli and E. faecalis when exposed to sunlight under aerobic versus anaerobic conditions in freshwater (48). Davies-Colley et al. (18) also showed that the dissolved oxygen concentration in waste stabilization ponds was an important factor affecting enterococcal photoinactivation (18). These findings suggest that oxygen-mediated indirect mechanisms are important for inactivation of Enterococcus bacteria and warrant additional research.
The present study explores the relative contributions of indirect versus direct photoinactivation mechanisms for Enterococcus faecalis in relatively clear, filtered seawater with very low concentrations of exogenous sensitizers. Photoinactivation in oxic and anoxic microcosms was examined to assess the relative contributions of oxygen-mediated and non-oxygen-mediated mechanisms. E. faecalis bacteria were enumerated using multiple techniques, including several culture-dependent methods, quantitative PCR (qPCR) with and without treatment with propidium monoazide (PMA), and microscopy using a membrane permeable dye. The cellular response to photostress was examined by characterizing microbial ATP and the expression of the gene encoding the superoxide dismutase enzyme, sodA. Additionally, the potential for cells to undergo dark repair was considered.
MATERIALS AND METHODS
Microcosms.
The microcosms were made of quartz columns (28-mm inner diameter, 31-mm outer diameter, and 330-mm length; QSI Quartz Scientific, Inc., Fairport Harbor, OH). End caps made of 1-in. polyvinyl chloride (PVC) caps were tightly fitted to the quartz columns with O-rings and epoxy. Rubber septa (Geo-Microbial Technologies, Inc., Ochelata, OK) were inserted in both ends of the PVC end caps. Before every experiment, quartz tube assemblies were sterilized with 10% hydrochloric acid (HCl).
The microcosms were filled with 200 ml seawater from Montara State Beach, CA (37°32′41.97″N, 122°30′57.63″W) filtered through a tangential filtration system. The tangential filtration system (or cross-flow filtration) pumped water through a 30-kDa pore-size membrane (Pall Corporation, Port Washington, NY) under pressure, separating retentate from filtrate. Seawater from Montara State Beach is relatively clear, so it was chosen to exclude exogenous sensitizers like colored dissolved organic matter (CDOM). The absorbance of the seawater at 300 nm and 370 nm was tested using a spectrophotometer (PerkinElmer lambda 35 UV-visible spectrophotometer; PerkinElmer, Waltham, MA) to confirm low CDOM. Due to a small background signal for luminescence, tangentially filtered seawater used in microcosm experiments in which ATP was measured was also filtered using a 0.1-μm hydrophilic polyvinylidene fluoride (PVDF) membrane (Millipore, Billerica, MA) prior to the start of the experiment (26).
Bacterial seed stock.
Bacterial seed stock was prepared in the exact same manner for each replicate experiment. Enterococcus faecalis (ATCC 19433) was grown in 25 ml tryptic soy broth (TSB) for ∼48 h at 37°C to late stationary phase. Cells were pelleted by centrifuging at 6,000 × g for 10 min (Eppendorf centrifuge 5424; Eppendorf, Hauppauge, NY). The supernatant was discarded, and the pellet was rinsed twice by resuspending it in sterile phosphate-buffered saline (PBS, pH = 7.2, Gibco; Life Technologies, Grand Island, NY) and centrifuging it again at 6,000 × g for 5 min. The rinsed pellet was resuspended in the filtered seawater used in the microcosms and stored at 4°C for ∼12 h. Finally, 1 ml of bacterial seed stock was added to each microcosm to obtain a final concentration of approximately 106 CFU per ml (CFU/ml). The seed stock was purposely stressed to mimic the state of enterococci released into ambient waters.
Oxic and anoxic conditions.
Microcosms were operated under oxic or anoxic conditions to test the relative importance of oxygen-mediated and non-oxygen-mediated photoinactivation. In the oxic microcosm, ROS may be formed by excited endogenous or intracellular sensitizers. In addition, direct damage by sunlight may be possible. In the anoxic microcosm, no oxygen is present, so ROS formation is prevented; direct photoinactivation mechanisms can still be active, as well as non-oxygen-dependent indirect mechanisms (where energy is transferred directly from triplet-state sensitizers to cellular components).
All microcosms were filled with seawater and seeded with bacteria in ambient air conditions. Anoxic microcosms were then sparged with oxygen-free nitrogen gas (Praxair, Danbury, CT) for at least 35 min. Before sampling, a volume of nitrogen gas equivalent to the volume of the sample being taken was injected into the microcosm. The oxygen in the microcosm headspace was tested before and after the experiment to confirm that the microcosms stayed anoxic. One milliliter of gas was withdrawn from the headspace using a Pressure Lok precision analytical syringe (Vici; Valco Instruments Co., Inc., Baton Rouge, LA). The oxygen content was tested using a Gow-Mac series 580 gas chromatograph (Gow-Mac Instrument Co., Bethlehem, PA). The oxygen levels were below the reliable limit of detection (<0.5% oxygen) for the instrument throughout the experiments (data not shown). There was a slight shift to higher pH in the sparged seawater relative to the pH in the seawater (pH of seawater = 7.8 and pH of sparged seawater = 8.4), probably due to stripping of CO2.
Sunlight exposure.
Microcosms exposed to sunlight (“light microcosms”) were placed on the roof of the Jerry Yang and Akiko Yamazaki Environment and Energy Building at Stanford University between 0730 and 0800 h and exposed to 11 to 12 h of natural sunlight. Light microcosms were partially submerged in a water bath held at 15°C by running water chilled by a Neslab RTE-7 digital one refrigerated bath (Thermo Fisher Scientific, Waltham, MA) through 3/4-in. copper tubing in the water around the microcosms. Every time the microcosms were sampled, the temperature of the water bath was checked to confirm that the temperature did not deviate more than 5°C due to solar heating. Microcosms used as controls (“dark microcosms”) were placed in the dark in a 15°C constant-temperature room at the same time the light microcosms were placed on the roof.
Sampling.
Light microcosms were sampled every 1 to 1.5 h for the first 6 h of the experiment, once again between 1400 and 1630 h, and once at sunset. After sunset, the light microcosms were brought inside and stored with the dark microcosms in the 15°C constant-temperature room for the remainder of the experiment. Dark microcosms were either sampled three times during the first 12 h of the experiment or every time the light microcosms were sampled, depending on the experiment. All the microcosms were sampled at 24 h after the beginning of the experiment, and a subset at 48 h, to test whether any inactivated cells recovered. At every sample time point, 3- to 5-ml amounts of water were withdrawn with 25-gauge, 1 1/2” needles (Fisher Scientific, Pittsburgh, PA) and immediately placed on ice and analyzed using the methods described below.
Replicate light/dark, oxic/anoxic microcosm experiments were carried out during the fall of 2010 and summer of 2011 on different days (Table 1). E. faecalis bacteria were enumerated by membrane filtration and growth on mEI medium (54) during each experiment. All other assays were run in duplicate (either on two different days or in two different microcosms on the same day). To combine data collected on different days, experimental results are provided as a function of fluence (kJ/m2), where fluence was determined for each experimental day using a chemical actinometer.
Table 1.
Summary of experiment numbers, dates, treatments, and assays run
| Expta | Date (mo/day/yr) | Treatment(s) | Assay(s) |
|---|---|---|---|
| 1 | 9/3/10 | Oxic | mEI, IDEXX |
| 2 | 9/7/10 | Oxic | mEI, TSA, qPCR, PMA-qPCR |
| 3 | 9/10/10 | Oxic | mEI, IDEXX, TSA, qPCR, PMA-qPCR |
| 4 | 10/26/10 | Anoxic | mEI, IDEXX, TSA, qPCR, PMA-qPCR |
| 5 | 11/5/10 | Oxic | mEI |
| 6 | 7/20/11 | Oxic and anoxic | mEI, ATP, sodA |
| 7 | 8/9/11 | Oxic and anoxic | mEI, ATP, sodA |
| 8 | 8/23/11 | Oxic and anoxic | mEI, BacLight LIVE/DEAD |
| 9 | 9/7/11 | Oxic and anoxic | mEI, BacLight LIVE/DEAD |
Each experiment consisted of one light and one dark microcosm per treatment except for experiments 4 and 5, which had two light and one dark microcosm per treatment.
Actinometer.
p-Nitroanisole (PNA) with the addition of pyridine was used as an actinometer (20). The actinometer solution was prepared according to the method of Leifer (34). Briefly, 0.0153 g of p-nitroanisole was dissolved in 10 ml acetonitrile, 20.15 μl pyridine was added, and the mixture was poured into a quartz microcosm tube and brought up to 200 ml with 0.1 μm filtered Milli-Q water. One actinometer microcosm was placed on the roof with the light microcosms and one was placed in the dark with the dark microcosms. Every time the light and dark microcosms were sampled, 0.5-ml amounts were sampled from the corresponding light and dark actinometer microcosms. Actinometer samples were stored in the dark in the 4°C room and processed within 24 h on an Agilent 1100 series high-performance liquid chromatography system (HPLC; Agilent, Santa Clara, CA) with an Adsorbosphere C18 HS 5U 250-mm column (Alltech Associates, Deerfield, IL). The change in peak area from sample to sample was used to calculate the irradiance received by the microcosms between sampling times. These calculations were based on the solar irradiance at 40°N latitude for the appropriate season, the molar absorptivities for p-nitroanisole, and the concentration of pyridine (34). Irradiance was calculated for 300 to 370 nm, the wavelength range absorbed by p-nitroanisole. The irradiance was then converted to cumulative fluence (kJ/m2) for the wavelength range 300 to 370 nm.
Enumeration by culture methods.
Culturable E. faecalis bacteria were measured using three methods. The number of CFU in a 1-ml sample (or diluted sample) was enumerated using membrane filtration with mEI (54), a selective medium. E. faecalis bacteria were enumerated by spread plating 100 μl of sample (or diluted sample) on tryptic soy agar (TSA), a nonselective medium. Finally, E. faecalis bacteria were measured using a colorimetric-liquid-defined substrate assay implemented in a 97-well format (Enterolert; IDEXX, Westbrook, ME). All culture assays were conducted within 1 h of sample collection. Multiple dilutions, depending on the expected concentration, were cultured by each method for every sample. If more than one dilution was quantifiable, an average of the countable dilutions was used to calculate concentration.
Enumeration based on DNA.
Genomic DNA was extracted from a 250-μl sample using the DNA-EZ kit according to the manufacturer's protocol (GeneRite, North Brunswick, NJ). qPCR was used to enumerate copies of a portion of the 23S rRNA gene using a previously published hydrolysis probe assay (28, 37). Briefly, the 25-μl reaction mixtures consisted of 2 μl of DNA template, 1× ABI TaqMan universal master mix (Life Technologies, Carlsbad, CA), 1 μM each forward (ECST748F, AGAAATTCCAAACGAACTTG) and reverse (ENC854R, CAGTGCTCTACCTCCATCATT) primer, 0.4 μM probe (GPL813TQ, 6FAM-GGTTCTCTCCGAAATAGCTTTAGGGCTA-TAMRA [dye labels 6FAM and TAMRA are 6-carboxyfluorescein and 6-carboxytetramethylrhodamine, respectively]), and 0.2 mg/ml bovine serum albumin (BSA). The cycling parameters consisted of 2 min at 50°C followed by 10 min at 95°C and then 40 cycles of 95°C for 15 s and 60°C for 1 min. All runs were done on an Applied Biosystems StepOnePlus instrument, and the results analyzed using Applied Biosystems StepOnePlus software, version 2.0.
Genomic DNA from E. faecalis was quantified using a NanoDrop 1000 spectrophotometer (Wilmington, DE) and serially diluted to create standard curves. The mass per volume of DNA was related to copy numbers by assuming a genome of 3,020 kb and 4 gene operons per genome (43). Standard curves were run in triplicate with each qPCR plate. The standard curves from each plate were used to translate quantification cycles (Cq) to copy numbers for the samples on that plate. No-template controls (NTCs) made from DNA-free water were also run in triplicate on each qPCR plate.
Propidium monoazide (PMA)-qPCR was used to enumerate DNA within cells without compromised membranes (55). PMA {propidium monoazide, phenanthridium, 3-amino-8 azido-5-[3-(diethylmethylammonio)propyl]-6-phenyldichloride [Biotium, Hayward, CA]} was dissolved in 20% dimethyl sulfoxide (DMSO) to make stock solutions of 100 μM. PMA stock solutions were stored at 4°C and handled under minimal-light conditions. In 2-ml transparent microcentrifuge tubes (Greentree Scientific, Rochester, NY), 4 μl of PMA stock solution was mixed with 250 μl of sample for a final concentration of 100 μM. This mixture was immediately incubated on ice in the dark for 5 min, followed by exposure to a halogen lamp for 2 to 3 min (Britek halo flood 800/650PS; Newport Beach, CA). After light exposure, genomic DNA was extracted using the methods described above for qPCR, and 23S rRNA gene copies were enumerated using the same qPCR protocol. DNA from cells permeable to PMA is not amplified because the azide group in the PMA covalently cross-links to DNA and inhibits replication during PCR (42).
Microscopy.
Cell membrane permeability was assessed using the BacLight LIVE/DEAD kit (Invitrogen, Carlsbad, CA). Components A (Syto 9) and B (propidium iodide [PI]) were mixed in a 1:1 mixture, and 6 μl of this mixture was added to 0.5 ml of sample. Samples were then incubated at room temperature in the dark for 20 min. After 20 min, the sample and dye mixture was filtered through 0.22-μm black polycarbonate filters (GE Osmonics, Inc., Trevose, PA) and mounted on a glass slide with component C from the BacLight LIVE/DEAD kit. The slides were stored in the dark at 4°C until analysis under a Nikon Eclipse TE 2000-U epifluorescence microscope with a lambda XL Sutter Instrument lamp (usually within 3 days). Slides were photographed under green and red fluorescence filters (for green and red fluorescent proteins [GFP and RFP]) using Micro-Manager 1.3.45.201 (University of California, San Francisco, CA). Ten images were taken for each slide under each filter. Corresponding GFP and RFP images were merged with color in ImageJ (National Institutes of Health, Bethesda, MD) and the total number of cells was counted in Image J using the Image-Based Tool for Counting Nuclei (ITCN) plugin (Center for Bio-Image Informatics, University of California, Santa Barbara, CA). Cells with compromised membranes permeable to PI appeared red, while cells with an intact, nonpermeable membrane appeared green. To determine the numbers of green and red cells, merged images were analyzed using a program in MATLAB (MathWorks, Natick, MA) to count the number of green and red pixels and convert these counts into the percent red and percent green per image. These percentages were then applied to the total cell counts.
ATP assay.
Total, extracellular, and microbial ATP levels were measured using the BacTiter-Glo microbial cell viability assay (Promega) following methods optimized by Hammes et al. (26). BacTiter-Glo buffer (part number G818A) and substrate (part number G819A) were mixed according to the manufacturer's instructions. The mixture was incubated at room temperature for 2 h to allow “burn off” and achieve low sensitivity. Single-use aliquots were stored at −20°C for no more than 1 week. Following the methods described in Hammes et al. (26), total ATP was measured in 500 μl of sample and extracellular ATP was measured in 500 μl of sample that had been filtered with the 0.1-μm PVDF membrane to remove bacteria (26). Luminescence was measured using a Glomax-Multi Jr. (Promega). ATP concentrations were determined using standard curves made from dilutions of a 10 mM rATP standard (part number P1132; Promega). Standard dilutions were made in the same filtered seawater used for the microcosms. Microbial ATP was calculated as the difference between the total ATP measured and the extracellular ATP measured for each sample (26).
Relative expression of sodA.
Immediately following sample collection, 1 ml of sample was centrifuged for 10 min at 6,000 × g and the supernatant discarded. The pellet was then resuspended in 94 μl TE buffer (10 mM Tris, 1 mM EDTA, pH 8) and 6 μl of 50 mg/ml lysozyme stock for a final concentration of 3 mg/ml and incubated at room temperature for 10 min to lyse cells. After this incubation, 350 μl of a mixture of Buffer RLT (Qiagen) and β-mercaptoethanol (1 ml Buffer RLT per 10 μl β-mercaptoethanol) was added to inactivate the lysozyme. Samples were immediately flash frozen in liquid nitrogen and stored at −80°C until extraction. A processing blank was made with only the Buffer RLT and β-mercaptoethanol mixture on every day of the experiments to verify that the mixture was not contaminated. Total RNA was extracted using the RNeasy minikit (Qiagen) with an additional on-column DNase treatment (Qiagen). Forty microliters was eluted with RNase-free water warmed to 60°C. An extraction blank was made with every set of extractions to verify that the extraction reagents were not contaminated with the target RNA. sodA mRNA was measured by reverse transcription (RT)-qPCR using SYBR green chemistry and the Power SYBR RNA-to-Ct one-step kit (Applied Biosystems). Processing and extraction blanks were run in triplicate with samples. Primers for sodA were designed using Primer Express software, version 2 (Applied Biosystems), based on the sodA sequence for E. faecalis (ATCC 19433) in GenBank, and primer concentrations were optimized. Briefly, the 20-μl reaction mixtures consisted of 2.5 μl RNA template, 1× ABI SYBR master mix, 1× ABI reverse transcriptase enzyme, 0.5 μM forward primer (sodAF, CCGTACAGCCGTTCGTAACA), and 0.5 μM reverse primer (sodAR, CCAGCATTTGGTGCCATAATT). No-template controls (NTCs) made from RNA-free water were run in triplicate on every RT-qPCR plate to verify that the reverse transcriptase and qPCR reagents were not contaminated. The cycling parameters consisted of 30 min at 48°C, followed by 10 min at 95°C and then 40 cycles of 95°C for 15 s and 60°C for 1 min. Melt curves were run to confirm the 78-bp PCR product, with a melting temperature of 77°C. All runs were done on an Applied Biosystems StepOnePlus instrument, and the results analyzed using Applied Biosystems StepOnePlus software, version 2.0. Thresholds were set at 0.03.
Data analysis.
Data analysis was completed with Microsoft Excel 2008 (Redmond, WA), MATLAB 7.8.0.347 (R2009a) (MathWorks, Inc., Natwick, MA) and Igor Pro (Wavemetrics, Lake Oswego, OR). The natural logarithm (ln) of the concentration of E. faecalis at a given time (Ct) normalized by the initial concentration in that microcosm at time zero (C0) was plotted against fluence. Culture-based data below the detection limit were replaced with one-half the detection limit or 0.5 CFU/ml. A linear regression was fit to the ln(Ct/C0)-versus-fluence data to derive the light and dark inactivation rates, denoted ks and kd, respectively. For the light oxic microcosms, the inactivation rate was based on data within the range of linear decay, and data points with concentrations less than the detection limit were not included in the regression.
PASW Statistics GradPack 18 (SPSS, Inc., Chicago, IL) was used for statistical analysis. Comparison of light and dark inactivation rates (ks and kd) was achieved using a multivariate linear regression model accounting for the interaction between fluence and either light and dark or oxic and anoxic treatments. For data from qPCR, PMA-qPCR, BacLight LIVE/DEAD, ATP, and relative expression of sodA, a paired t test was used to compare light and dark or oxic and anoxic treatments.
The relative expression of sodA was calculated using an adaptation of the “delta delta method” (46). The delta delta method assumes 100% amplification efficiency and calculates an expression ratio of 2−(ΔCq reference − ΔCq target) = 2−ΔΔCq, where the reference can be a reference gene, calibrator, or environmental condition and the target can be a target gene or a stress condition (16, 19, 46). For this study, “ΔCq reference” was adapted to be the change in the dark microcosm and “ΔCq target” the change in the light microcosm [2−(ΔCq dark − ΔCq light)]. The change was defined as the difference between a given time point and the initial time point for that microcosm treatment. This adapted delta delta formula was applied to both the oxic and anoxic microcosms to compare the relative expression of sodA between light and dark microcosms under oxic and anoxic conditions. A positive relative expression, greater than 1, means that there were more copies of the sodA gene in the light than in the dark microcosm, so sodA was upregulated. Analytical error was propagated using the triplicate Cq measurements.
RESULTS
Absorbance of filtered seawater.
Absorbance was used to assess the levels of colored dissolved organic matter (CDOM; potential exogenous sensitizers) in the seawater. The average absorbances at 254, 300, 337, 355, and 370 nm of triplicate measurements of the seawater used in the experiments presented here were 1.6 per meter (m−1), 0.7 m−1, 0.4 m−1, 0.3 m−1, and 0.3 m−1, respectively. These levels are relatively low compared to data for other natural waters, suggesting low CDOM levels (25, 40, 45).
Decay of cultivable E. faecalis.
The inactivation of E. faecalis in clear seawater under natural sunlight was assessed in oxic and anoxic microcosms to investigate the importance of oxygen-mediated photoinactivation. Experimental data from multiple days were pooled by plotting the natural log of the concentration divided by the initial concentration [ln(C/Co)] versus fluence as determined by actinometry. The starting E. faecalis concentrations in each microcosm were approximately 106 CFU/ml.
Photoinactivation of E. faecalis, measured by cultivation, including membrane filtration and mEI medium, IDEXX defined-substrate assay, and spread plating using nonselective tryptic soy agar (TSA), was observed in microcosms exposed to sunlight under both oxic and anoxic conditions. Little to no decay was observed in the dark microcosms (Fig. 1 and Table 2). E. faecalis in oxic microcosms exposed to sunlight showed significantly faster decay than E. faecalis in the anoxic sunlit microcosms regardless of the enumeration method (P < 0.05, multiple linear regression). E. faecalis bacteria were inactivated significantly faster in light oxic than in dark oxic microcosms regardless of the enumeration method (P < 0.05, multiple linear regression). The photoinactivation rates in anoxic microcosms, however, were not significantly different from the rates measured in the anoxic microcosms when E. faecalis bacteria were enumerated using TSA (P = 0.065) and IDEXX (P = 0.125). When E. faecalis bacteria were enumerated using mEI medium, however, inactivation was significantly faster in the light than in the dark anoxic microcosms (P < 0.05).
Fig 1.
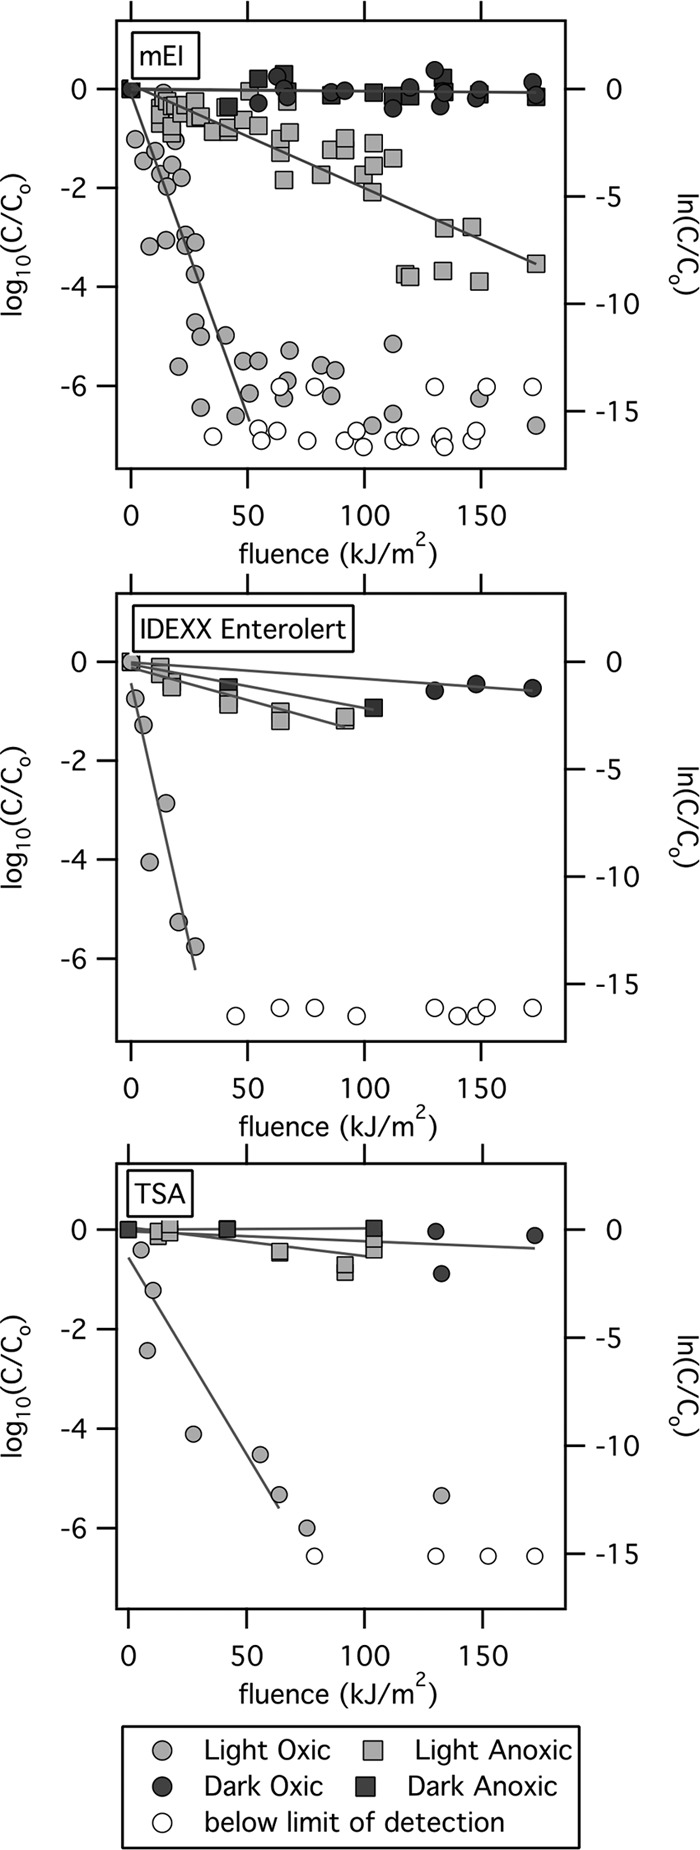
E. faecalis inactivation was measured with mEI, IDEXX Enterolert, and TSA media. Oxic microcosms are represented by circles. Anoxic microcosms are represented by squares. Light colored circles and squares represent microcosms exposed to sunlight. Black shapes represent dark control microcosms. Open, white circles represent data points below the detection limit (plotted at one half the detection limit). The line for each data set represents the regression used to calculate the light or dark inactivation rate (ks and kd, respectively). The x axis is fluence (kJ/m2) as measured via actinometry (λ = 300 to 370 nm). The left axis is in log10 units, and the right axis is in ln units. C/C0, E. faecalis concentration divided by initial concentration.
Table 2.
E. faecalis inactivation rates for each culture-based measurement method
| Treatment | Inactivation rate (−k) ± CI usinga: |
||
|---|---|---|---|
| mEI | IDEXX | TSA | |
| Light oxic | −0.3 ± 0.06 | −0.5 ± 0.2 | −0.2 ± 0.07 |
| Dark oxic | −0.0008 ± 0.003 | −0.007 ± 0.004 | −0.005 ± 0.02 |
| Light anoxic | −0.05 ± 0.007 | −0.03 ± 0.008 | −0.01 ± 0.007 |
| Dark anoxic | −0.001 ± 0.003 | −0.02 ± 0.05 | 0.0006 ± 0.002 |
The units for −k are m2 kJ−1. CI, confidence interval.
The photoinactivation rates in the oxic light microcosms varied between enumeration methods. The light oxic microcosm inactivation rates measured using mEI (ks = −0.3 m2/kJ) were not statistically significantly different from the rates measured using TSA (ks = −0.2 m2/kJ) (multiple linear regression, P = 0.920), but both were statistically significantly lower than the rates measured using IDEXX (ks = −0.5 m2/kJ) (both P < 0.05).
The photoinactivation rates in the light anoxic microcosms also varied by enumeration method. The inactivation rate measured using TSA (ks = −0.01 m2/kJ) was lower than the rates measured using both IDEXX (ks = −0.03 m2/kJ) and mEI (ks = −0.05 m2/kJ) (multiple linear regression, both P < 0.05). The photoinactivation rate measured using mEI was not statistically significantly different from that measured using IDEXX (P = 0.1).
E. faecalis bacteria in the oxic microcosms exposed to sunlight showed two-phase decay, with an initial exponential decay between 0 and ∼50 kJ/m2 followed by a period of reduced to no decay, when the organism was enumerated using mEI and TSA. It should be noted that most of the measurements in the second phase of decay were derived from the growth of a small number of colonies, so further work would need to confirm the second decay phase. The presence of two-phase decay could not be assessed for E. faecalis bacteria enumerated using IDEXX, as only nondetects were measured after 50 kJ/m2.
qPCR and PMA-qPCR.
E. faecalis concentrations measured by qPCR remained constant in all microcosms (Fig. 2). Concentrations measured using PMA-qPCR were statistically significantly lower than concentrations measured by qPCR for the light oxic microcosms when data from each time point were compared (paired t test, P < 0.05, mean difference = 0.6 log10 units or 1.4 ln units). The difference between PMA-qPCR and qPCR concentrations, however, was small, and E. faecalis concentrations measured by PMA-qPCR did not exhibit first-order decay. There were no significant differences in concentrations measured using qPCR and PMA-qPCR in the dark oxic, dark anoxic, and light anoxic microcosms (paired t tests, P > 0.05).
Fig 2.

E. faecalis bacteria were measured using qPCR (solid symbols) and PMA-qPCR (symbols marked by an “×” inside) in light oxic (top left), dark oxic (bottom left), light anoxic (top right), and dark anoxic (bottom right) microcosms. The left axis is in log10 units, and the right axis is in ln units.
Microscopy with BacLight LIVE/DEAD kit.
The total number of cells (intact-membrane and permeable-membrane cells) remained relatively constant (approximately 107 cells per ml) in all the microcosms (Fig. 3, left). The number of intact cells (those that were impermeable to propidium iodide and remained green) decreased slightly over the duration of the experiment in the light oxic microcosms (Fig. 3, middle) and was statistically significantly lower than the number of total cells in the light oxic microcosms (paired t test, P = 0.005, mean difference = 0.22 log10 units or 0.5 ln units). The decay of intact-membrane cells, however, was not first order with respect to fluence (or time [data for time are not shown]). The differences between the concentrations of total and intact cells in the light anoxic, dark oxic, and dark anoxic microcosms were not statistically significant (paired t test, P > 0.05).
Fig 3.

E. faecalis bacteria were measured using microscopy with the BacLight LIVE/DEAD kit. Data for total cells (red and green cells) in all microcosms (left), intact (green) cells in oxic microcosms (middle), and intact cells (green) in anoxic microcosms (right) are shown. Circles correspond to oxic microcosms, and squares correspond to anoxic microcosms. Data from microcosms exposed to sunlight are light colored; dark controls are dark colored. The left axis is in log10 units, and the right axis is in ln units.
Cellular activity measured by microbial ATP.
The microbial ATP concentrations in all of the microcosms dropped over the course of the experiments (Fig. 4). The decline was most pronounced in the microcosms exposed to sunlight, particularly the light oxic microcosms. The decay in microbial ATP concentrations in the light oxic and dark oxic microcosms was significantly different (P = 0.014). ATP decay, however, was not significantly different between the light and dark anoxic microcosms (P = 0.058), the light oxic and anoxic microcosms (P = 0.159), or the dark oxic and anoxic microcosms (P = 0.979).
Fig 4.

Microbial ATP concentrations for experiments 7 (left) and 6 (right). The left axis is in log10 units, and the right axis is in ln units.
Cellular activity measured by sodA expression.
The expression of sodA in the oxic microcosms relative to that in the dark control increased with increasing cumulative fluence; most of the measurements were significantly higher than 1 (Fig. 5). In contrast, in the anoxic microcosms, the expression of sodA relative to that in the dark control remained near 1, indicating no significant change in relative expression. The differences in the relative expression of sodA under oxic and anoxic conditions were significant (paired t test, P < 0.05, mean difference = 2.562).
Fig 5.
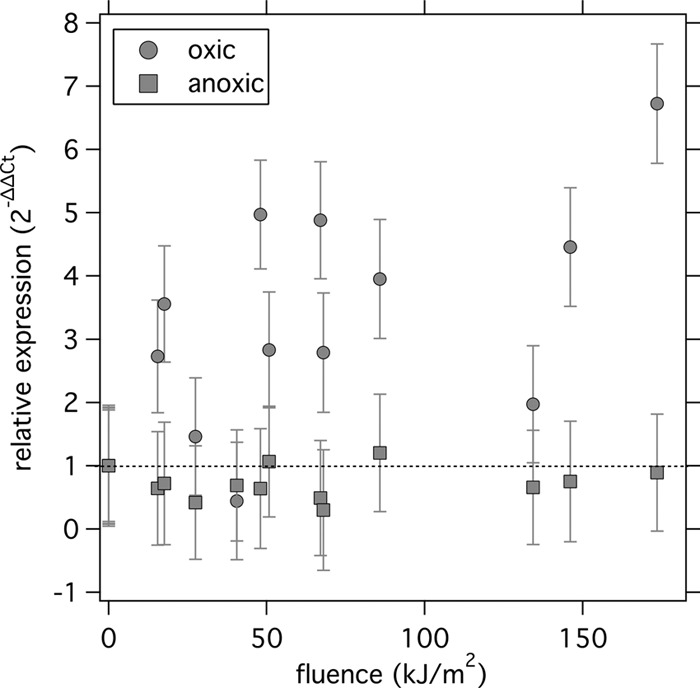
Relative expression (amount in light divided by amount in dark) of the sodA gene under oxic and anoxic conditions. Error bars represent propagation of the standard deviation of triplicate quantification cycle (Cq) measurements from the RT-qPCR. The dashed line at a relative expression of 1 indicates no change in expression.
Changes in concentration after 24 h and 48 h.
After a day of sunlight exposure, the microcosms were brought indoors and placed in the dark at 15°C. At 24 and 48 h from the start of the experiment, samples were assayed for E. faecalis using mEI, IDEXX, and TSA to assess whether any inactivated cells underwent dark repair. The concentrations measured in samples collected after the day of sunlight exposure were compared to those collected at 24 h and at 48 h (Table 3). No significant differences in E. faecalis concentrations were observed for the sunlit microcosms (paired t test comparing end-of-day and 24-h concentrations on mEI for oxic microcosms, P = 0.06, and for anoxic microcosms, P = 0.47; paired t test comparing end-of-day and 48-h concentrations on mEI for oxic microcosms, P = 0.08, and for anoxic microcosms, P = 0.12).
Table 3.
Raw log concentrations of E. faecalis at different time points
| Treatment | Log concn of E. faecalis at 12 h/24 h/48 ha |
||
|---|---|---|---|
| mEI | IDEXX | TSA | |
| Light oxic | −0.3/−0.3 | −0.3/−0.3 | 1.95/−0.3 |
| −0.3/−0.3 | −0.3/−0.3 | −0.3/−0.3/−0.3 | |
| −0.3/−0.3/−0.3 | −0.3/−0.3/−0.3 | ||
| 1.46/1.58/1.64 | |||
| 0/0.94/1.04 | |||
| 0/0.95/1.43 | |||
| 0.48/0.78/0.60 | |||
| Light anoxic | 4.86/4.88 | NA | 5.54/5.17 |
| 5.21/5.08 | 5.59/4.85 | ||
| 5.22/5.29/5.24 | |||
| 4.09/3.82/4.20 | |||
| 3.39/3.48/3.37 | |||
| 2.90/3.15/3.13 | |||
| 3.03/3.46/3.42 | |||
The 12-h time point is the end of sunlight exposure. Data for the 48-h time point are shown when available. Each row represents a different experiment. Concentrations below the limit of detection were replaced with one-half the detection limit (0.5 CFU/ml or −0.30 CFU/ml in log units). Data for dark microcosms are not shown. NA, no data available.
DISCUSSION
Oxygen was a critical factor affecting photoinactivation (defined by loss of culturability) of E. faecalis in filtered, clear, sunlit seawater, a finding consistent with previous research with enterococci (18, 48), as well as E. coli (17, 18, 24, 48). Photoinactivation rates measured in sunlit oxic conditions were significantly higher than photoinactivation rates measured in sunlit anoxic conditions. These results suggest that indirect photoinactivation from oxygen-mediated mechanisms dominated inactivation of E. faecalis under these experimental conditions. Given that the seawater had low absorbance and, hence, relatively low levels of chromophores that could act as exogenous sensitizers, indirect photoinactivation was probably due to endogenous sensitizers and the formation of reactive oxygen species (ROS) within the cell. Although the inactivation rate was lower in the light anoxic microcosms than in the light oxic microcosms, E. faecalis were also photoinactivated under anoxic conditions. This suggests that direct damage from sunlight exposure and, potentially, indirect damage from triplet state sensitizers also contributed to E. faecalis inactivation. Photoinactivation in the anoxic microcosms via triplet state sensitizers could be exacerbated by the lack of oxygen; without oxygen, triplet state sensitizers generally will have longer half-lives and higher steady-state concentrations (53).
Three types of culture medium, mEI, IDEXX, and TSA, were used to assess bacterial concentrations, including two media commonly used for water quality monitoring. In both the anoxic and oxic microcosms, the photoinactivation rates measured using the liquid defined-substrate IDEXX assay were significantly higher than the rates measured using the nonselective solid TSA medium. These results suggest that fewer photostressed cells are able to recover and grow on the selective than on the nonselective medium. The relative rates of decay measured using mEI selective solid medium differed between anoxic and oxic microcosms. In the anoxic microcosms, photoinactivation measured using mEI decayed at a rate similar to the IDEXX-measured rate, consistent with the idea that it is more difficult for stressed cells to grow in selective than in nonselective media. However, in the oxic microcosms, the rates measured using mEI were similar to those measured using TSA and, thus, lower than those measured using IDEXX. Thus, it is possible that the selective agents used in the IDEXX liquid medium are more difficult for cells photostressed via oxygen-mediated mechanisms to grow in than those used in mEI solid medium. The ingredients in the IDEXX medium are proprietary, but the presence of oxidants could exacerbate stress in cells already coping with oxidative stress. Differences between IDEXX and mEI have been observed previously (8). Field observations in well-oxygenated marine water showed a larger difference between nighttime and daytime concentrations of enterococci when they were evaluated by IDEXX than by mEI (8).
Field observations in recreational waters often show a rebound in culturable enterococci concentrations after the sun sets. One possible explanation for this rebound is that enterococci can repair photoinduced damage and regain culturability. We tested whether E. faecalis concentrations rebounded when sunlit microcosms were brought indoors and kept in the dark for 48 h. We chose to test for dark repair in the seawater matrix, as this would indicate whether such repair is possible in the environmental matrix of interest. We found no evidence that E. faecalis bacteria were capable of regaining culturability. This suggests the bacteria were not able to repair photodamage and regain culturability within 48 h. While previous studies have shown that stressed E. faecalis bacteria can enter a viable but nonculturable (VBNC) state and be resuscitated, these studies induced the VBNC state by exposing the E. faecalis bacteria to low temperatures or oligotrophy (not sunlight) and “resuscitated” them in nutrient-rich broth at favorable temperatures (35, 36, 57). Subsequent research, however, has suggested that VBNC bacteria may actually be in an injured, transient state before cell death (9) and that the “resuscitation” observed by researchers is actually the regrowth of a few remanent culturable cells (1, 10, 32). Previous research specifically on Enterococcus exposed to sunlight or UV light suggests that Enterococcus bacteria do not have the ability to repair photodamage (2, 22, 48, 52). The lack of E. faecalis repair demonstrated in the present study is consistent with previous research investigating repair of the bacterial pathogens Salmonella enterica serovar Typhimurium and Shigella flexneri after exposure to UVA irradiation (12).
The concentrations of enterococci measured by qPCR remained constant throughout the experiments, indicating that direct DNA damage to the 23S rRNA region targeted by the assay did not occur. Other processes that could serve as sinks for cellular DNA and dead cells in natural waters, such as grazing, aggregation with particles, deposition, and enzymatic decay via DNases, were unlikely to occur in the microcosms. These processes may explain the difference between our results and previous research in natural waters and microcosms with unfiltered waters, which found that enterococcal concentrations measured by qPCR did vary with sunlight exposure (8, 58).
The number of cells impermeable to PMA (measured by PMA-qPCR) and PI (measured by BacLight) changed only minimally over the course of the experiment in sunlit microcosms, indicating that cells experienced little membrane damage. Previous research with E. coli and Salmonella found that the respiratory chain was the first target of damage during UVA irradiation (13). Increases in membrane permeability were observed for E. coli, but only after other cellular functions were impaired, culturability was lost, and even after sunlight exposure had ceased (12, 13). It is possible that membrane permeability to PMA and PI occurs at a late stage of cell damage in enterococci as well.
The levels of microbial ATP decreased in both the sunlit and dark microcosms. This result indicates that not only sunlight but also oligotrophy (experienced independent of sunlight by cells in the dark microcosms) can affect microbial ATP concentrations. Previous studies have normalized microbial ATP concentrations by total or intact cell concentrations to investigate trends after sunlight exposure or water treatment processes (3, 12, 13, 26). For E. coli exposed to UVA, the level of ATP per cell initially increased and then decreased, depending on the fluence the cells were exposed to (13). In the present study, intact cell and ATP concentrations were measured during different experiments, precluding a matched calculation of ATP per cell for each time point. When measured, initial intact cell concentrations were ∼107 cells/ml, so the initial amount of ATP per cell was probably ∼10−14 g ATP per cell, higher than is reported for bacteria in drinking water (∼10−16 g ATP per cell) (3). If ATP concentrations are normalized by cultivatable cell concentrations, the ATP value per CFU is unrealistically large (∼10−13 to 10−8 g ATP per CFU at the beginning and end of the experiments, respectively). Microbial ATP in the microcosms, particularly the sunlit oxic microcosms, must therefore represent a combination of ATP from culturable and nonculturable cells. The relative proportions of microbial ATP from these subpopulations are unknown. It is also not clear if the presence of microbial ATP in the nonculturable cells indicates that this subpopulation is viable or is in a transient state between viability and cell death. The rate of decay of microbial ATP was not significantly different between the sunlit oxic and anoxic microcosms despite the two treatments having significantly different photoinactivation rates. The factors affecting microbial ATP decay are therefore different than those affecting culturability, suggesting that microbial ATP is not a good proxy for culturable bacteria levels after exposure to sunlight. This is consistent with previous research showing a poor correlation between amounts of ATP and culturable bacteria counts in natural waters (26).
The functional gene sodA was upregulated in the light oxic microcosms compared to its levels in the dark oxic microcosms but not in the light anoxic microcosms compared to the dark anoxic microcosms. sodA encodes the enzyme superoxide dismutase, which is an important part of enterococcal defense against oxidative stress from superoxide and peroxides (30, 33, 56). Therefore, an increase in its expression suggests a response to increased photooxidative damage. sodA is also involved in E. faecalis response to starvation (23); however, the upregulation of sodA in the light oxic microcosms relative to its levels in the dark oxic microcosms indicates a response attributable to photostress. Additional research to investigate changes in the expression of other genes during sunlight exposure may provide additional understanding of inactivation mechanisms and stress responses in E. faecalis.
The results presented here suggest that enterococci are sensitive to oxygen-mediated indirect photoinactivation. Direct damage of DNA by UV light does not appear to be an important mechanism of photoinactivation for enterococci under the experimental conditions tested herein. Under sunlight conditions where more short-wavelength UVB is present, the contribution by direct inactivation may be higher. Our results indicate that higher photoinactivation rates may be expected in the field as oxygen levels increase. For example, midday photoinactivation in natural waters could be higher not only due to high light intensity but also higher oxygen levels resulting from photosynthesis. The results suggest that enterococci are sensitive to all wavelengths of light that excite endogenous sensitizers; this may include visible light, as well as UVA and UVB. Future work that defines action spectra for enterococci will further our ability to make predictions of photoinactivation rates for natural waters with different absorbances and water depths.
Several factors could have influenced E. faecalis ' response to sunlight in the experiments presented in this paper, thus limiting the interpretation of the results. Researchers have found that growth rates and conditions are important determinants of how E. coli bacteria respond to stress (4, 5, 29). The E. faecalis bacteria used to seed the experiments presented here were grown to late stationary phase and then stored in filtered seawater at 4°C for 12 h before the start of the experiment. Previous research has shown that E. faecalis cells harvested in stationary phase or starved for 24 h are more resistant to UV irradiation at 256 nm than cells in exponential phase (27). Additional investigation into the effects of variations in E. faecalis preparation on photoinactivation and, potentially, repair is warranted. Finally, we assumed that experiments conducted on different days could be pooled when scaled against fluence in the 300 to 370 nm range. It is possible that differences between experimental days were not captured by the scaling. For example, because experiments were carried out in different seasons (summer and fall), it is possible that some shorter-wavelength light (<300 nm) was present in the summer and not the fall experiments.
ACKNOWLEDGMENTS
We thank Bill Mitch, Kris McNeil, Kevan Yamahara, Todd Russell, Royal Kopperund, Britt Peterson, and Mia Catherine Mattioli for their input and advice on different parts of the experiments. Comments from two reviewers improved the manuscript.
This work was supported by the National Science Foundation grant CBET-0853988 to K.L.N. and A.B.B.
Footnotes
Published ahead of print 31 August 2012
REFERENCES
- 1. Barer MR, Harwood CR. 1999. Bacterial viability and culturability. Adv. Microb. Physiol. 41:93–137 [DOI] [PubMed] [Google Scholar]
- 2. Baron J, Bourbigot M. 1996. Repair of Escherichia coli and enterococci in seawater after ultraviolet disinfection quantification using diffusion chambers. Water Res. 30:2817–2821 [Google Scholar]
- 3. Berney M, et al. 2008. Rapid, cultivation-independent assessment of microbial viability in drinking water. Water Res. 42:4010–4018 [DOI] [PubMed] [Google Scholar]
- 4. Berney M, Weilenmann HU, Egli T. 2006. Gene expression of Escherichia coli in continuous culture during adaptation to artificial sunlight. Environ. Microbiol. 8:1635–1647 [DOI] [PubMed] [Google Scholar]
- 5. Berney M, Weilenmann HU, Ihssen J, Bassin C, Egli T. 2006. Specific growth rate determines the sensitivity of Escherichia coli to thermal, UVA, and solar disinfection. Appl. Environ. Microbiol. 72:2586–2593 [DOI] [PMC free article] [PubMed] [Google Scholar]
- 6. Boehm AB. 2007. Enterococci concentrations in diverse coastal environments exhibit extreme variability. Environ. Sci. Technol. 41:8227–8232 [DOI] [PubMed] [Google Scholar]
- 7. Boehm AB, et al. 2002. Decadal and shorter period variability of surf zone water quality at Huntington Beach, California. Environ. Sci. Technol. 36:3885–3892 [DOI] [PubMed] [Google Scholar]
- 8. Boehm AB, et al. 2009. Covariation and photoinactivation of traditional and novel indicator organisms and human viruses at a sewage-impacted marine beach. Environ. Sci. Technol. 43:8046–8052 [DOI] [PubMed] [Google Scholar]
- 9. Bogosian G, Aardema ND, Bourneuf EV, Morris PJ, O'Neil JP. 2000. Recovery of hydrogen peroxide-sensitive culturable cells of Vibrio vulnificus gives the appearance of resuscitation from a viable but nonculturable state. J. Bacteriol. 182:5070–5075 [DOI] [PMC free article] [PubMed] [Google Scholar]
- 10. Bogosian G, Bourneuf EV. 2001. A matter of bacterial life and death. EMBO Rep. 2:770–774 [DOI] [PMC free article] [PubMed] [Google Scholar]
- 11. Bolton NF, Cromar NJ, Hallsworth P, Fallowfield HJ. 2010. A review of the factors affecting sunlight inactivation of micro-organisms in waste stabilisation ponds: preliminary results for enterococci. Water Sci. Technol. 61:885–890 [DOI] [PubMed] [Google Scholar]
- 12. Bosshard F, Berney M, Scheifele M, Weilenmann HU, Egli T. 2009. Solar disinfection (SODIS) and subsequent dark storage of Salmonella typhimurium and Shigella flexneri monitored by flow cytometry. Microbiology 155:1310–1317 [DOI] [PubMed] [Google Scholar]
- 13. Bosshard F, Bucheli M, Meur Y, Egli T. 2010. The respiratory chain is the cell's Achilles' heel during UVA inactivation in Escherichia coli. Microbiology 156:2006–2015 [DOI] [PubMed] [Google Scholar]
- 14. Bosshard F, et al. 2010. Protein oxidation and aggregation in UVA-irradiated Escherichia coli cells as signs of accelerated cellular senescence. Environ. Microbiol. 12:2931–2945 [DOI] [PubMed] [Google Scholar]
- 15. Bucheli-Witschel M, Bassin C, Egli T. 2010. UV-C inactivation in Escherichia coli is affected by growth conditions preceding irradiation, in particular by the specific growth rate. J. Appl. Microbiol. 109:1733–1744 [DOI] [PubMed] [Google Scholar]
- 16. Calvez S, Prevost H, Drider D. 2008. Relative expression of genes involved in the resistance/sensitivity of Enterococcus faecalis JH2-2 to recombinant divercin RV41. Biotechnol. Lett. 30:1795–1800 [DOI] [PubMed] [Google Scholar]
- 17. Curtis TP, Mara DD, Silva SA. 1992. Influence of pH, oxygen, and humic substances on ability of sunlight to damage fecal coliforms in waste stabilization pond water. Appl. Environ. Microbiol. 58:1335–1343 [DOI] [PMC free article] [PubMed] [Google Scholar]
- 18. Davies-Colley RJ, Donnison AM, Speed DJ, Ross CM, Nagels JW. 1999. Inactivation of fecal indicator microorganisms in waste stabilization ponds: interactions of environmental factors with sunlight. Water Res. 33:1220–1230 [Google Scholar]
- 19. Desroche N, Beltramo C, Guzzo J. 2005. Determination of an internal control to apply reverse transcription quantitative PCR to study stress response in the lactic acid bacterium Oenococcus oeni. J. Microbiol. Methods 60:325–333 [DOI] [PubMed] [Google Scholar]
- 20. Dulin D, Mill T. 1982. Development and evaluation of sunlight actinometers. Environ. Sci. Technol. 16:815–820 [DOI] [PubMed] [Google Scholar]
- 21. Enns AA, et al. 2012. Spatial and temporal variation in indicator microbe sampling is influential in beach management decisions. Water Res. 46:2237–2246 [DOI] [PMC free article] [PubMed] [Google Scholar]
- 22. Fujioka RS, Hashimoto HH, Siwak EB, Young RHF. 1981. Effect of sunlight on survival of indicator bacteria in seawater. Appl. Environ. Microbiol. 41:690–696 [DOI] [PMC free article] [PubMed] [Google Scholar]
- 23. Giard JC, et al. 2001. The stress proteome of Enterococcus faecalis. Electrophoresis 22:2947–2954 [DOI] [PubMed] [Google Scholar]
- 24. Gourmelon M, Cillard J, Pommepuy M. 1994. Visible light damage to Escherichia coli in seawater: oxidative stress hypothesis. J. Appl. Bacteriol. 77:105–112 [DOI] [PubMed] [Google Scholar]
- 25. Green SA, Blough NV. 1994. Optical absorption and fluorescence properties of chromophoric dissolved organic matter in natural waters. Limnol. Oceanogr. 39:1903–1916 [Google Scholar]
- 26. Hammes F, Goldschmidt F, Vital M, Wang Y, Egli T. 2010. Measurement and interpretation of microbial adenosine tri-phosphate (ATP) in aquatic environments. Water Res. 44:3915–3923 [DOI] [PubMed] [Google Scholar]
- 27. Hartke A, Giard JC, Laplace JM, Auffray Y. 1998. Survival of Enterococcus faecalis in an oligotrophic microcosm: changes in morphology, development of general stress resistance, and analysis of protein synthesis. Appl. Environ. Microbiol. 64:4238–4245 [DOI] [PMC free article] [PubMed] [Google Scholar]
- 28. Haugland RA, Siefring SC, Wymer LJ, Brenner KP, Dufour AP. 2005. Comparison of Enterococcus measurements in freshwater at two recreational beaches by quantitative polymerase chain reaction and membrane filter culture analysis. Water Res. 39:559–568 [DOI] [PubMed] [Google Scholar]
- 29. Ihssen J, Egli T. 2004. Specific growth rate and not cell density controls the general stress response in Escherichia coli. Microbiology 150:1637–1648 [DOI] [PubMed] [Google Scholar]
- 30. Imlay JA. 2008. Cellular defenses against superoxide and hydrogen peroxide. Annu. Rev. Biochem. 77:755–776 [DOI] [PMC free article] [PubMed] [Google Scholar]
- 31. Imlay JA. 2003. Pathways of oxidative damage. Annu. Rev. Microbiol. 57:395–418 [DOI] [PubMed] [Google Scholar]
- 32. Kell DB, Kaprelyants AS, Weichart DH, Harwood CR, Barer MR. 1998. Viability and activity in readily culturable bacteria: a review and discussion of the practical issues. Antonie Van Leeuwenhoek 73:169–187 [DOI] [PubMed] [Google Scholar]
- 33. Leblanc DJ. 2006. Enterococcus, p 175 In Dworkin M, Falkow S, Rosenberg E, Schleifer K-H, Stackebrandt E. (ed), The prokaryotes: a handbook on the biology of Bacteria, 3rd ed, vol 4 Bacteria: Firmicutes, Cyanobacteria. Springer Science+Business Media, New York, NY [Google Scholar]
- 34. Leifer A. 1988. The kinetics of environmental aquatic photochemistry: theory and practice. American Chemical Society, Washington, DC [Google Scholar]
- 35. Lleo MM, et al. 2001. Resuscitation rate in different enterococcal species in the viable but nonculturable state. J. Appl. Microbiol. 91:1095–1102 [DOI] [PubMed] [Google Scholar]
- 36. Lleo MM, Tafi MC, Canepari P. 1998. Nonculturable Enterococcus faecalis cells are metabolically active and capable of resuming active growth. Syst. Appl. Microbiol. 21:333–339 [DOI] [PubMed] [Google Scholar]
- 37. Ludwig W, Schleifer KH. 2000. How quantitative is quantitative PCR with respect to cell counts? Syst. Appl. Microbiol. 23:556–562 [DOI] [PubMed] [Google Scholar]
- 38. Maisch T, et al. 2007. The role of singlet oxygen and oxygen concentration in photodynamic inactivation of bacteria. Proc. Natl. Acad. Sci. U. S. A. 104:7223–7228 [DOI] [PMC free article] [PubMed] [Google Scholar]
- 39. Malloy KD, Holman MA, Mitchell D, Detrich HW., III 1997. Solar UVB-induced DNA damage and photoenzymatic DNA repair in Antarctic zooplankton. Proc. Natl. Acad. Sci. U. S. A. 94:1258–1263 [DOI] [PMC free article] [PubMed] [Google Scholar]
- 40. Miller RL, Belz M, Castillo CD, Trzaska R. 2002. Determining CDOM absorption spectra in diverse coastal environments using a multiple pathlength, liquid core waveguide system. Cont. Shelf Res. 22:1301–1310 [Google Scholar]
- 41. Muela A, Garcia-Bringas JM, Arana II, Barcina II. 2000. The effect of simulated solar radiation on Escherichia coli: the relative roles of UV-B, UV-A, and photosynthetically active radiation. Microb. Ecol. 39:65–71 [DOI] [PubMed] [Google Scholar]
- 42. Nocker A, Sossa-Fernandez P, Burr MD, Camper AK. 2007. Use of propidium monoazide for live/dead distinction in microbial ecology. Appl. Environ. Microbiol. 73:5111–5117 [DOI] [PMC free article] [PubMed] [Google Scholar]
- 43. Oana K, et al. 2002. Physical and genetic map of Enterococcus faecium ATCC 19434 and demonstration of intra- and interspecific genomic diversity in enterococci. FEMS Microbiol. Lett. 207:133–139 [DOI] [PubMed] [Google Scholar]
- 44. Peak JG, Peak MJ, Tuveson RW. 1983. Ultraviolet action spectra for aerobic and anaerobic inactivation of Escherichia coli strains specifically sensitive and resistant to near ultraviolet radiations. Photochem. Photobiol. 38:541–543 [DOI] [PubMed] [Google Scholar]
- 45. Petasne RG, Zika RG. 1997. Hydrogen peroxide lifetimes in south Florida coastal and offshore waters. Mar. Chem. 56:215–225 [Google Scholar]
- 46. Pfaffl MW. 2001. A new mathematical model for relative quantification in real-time RT-PCR. Nucleic Acids Res. 29:e45 doi:10.1093/nar/29.9.e45 [DOI] [PMC free article] [PubMed] [Google Scholar]
- 47. Ravanat JL, Douki T, Cadet J, Paolo UG. 2001. UV damage to nucleic acid components, p 207–230 In Giacomoni PU. (ed), Sun protection in man, vol 3 Comprehensive series in photosciences. Elsevier, Amsterdam, Netherlands [Google Scholar]
- 48. Reed RH. 1997. Solar inactivation of faecal bacteria in water: the critical role of oxygen. Lett. Appl. Microbiol. 24:276–280 [DOI] [PubMed] [Google Scholar]
- 49. Riboulet E, et al. 2007. Relationships between oxidative stress response and virulence in Enterococcus faecalis. J. Mol. Microbiol. Biotechnol. 13:140–146 [DOI] [PubMed] [Google Scholar]
- 50. Sassoubre LM, Walters SP, Russell TL, Boehm AB. 2011. Sources and fate of Salmonella and fecal indicator bacteria in an urban creek. J. Environ. Monit. 13:2206–2212 [DOI] [PubMed] [Google Scholar]
- 51. Sinha RP, Hader DP. 2002. UV-induced DNA damage and repair: a review. Photochem. Photobiol. Sci. 1:225–236 [DOI] [PubMed] [Google Scholar]
- 52. Sinton LW, Hall CH, Lynch PA, Davies-Colley RJ. 2002. Sunlight inactivation of fecal indicator bacteria and bacteriophages from waste stabilization pond effluent in fresh and saline waters. Appl. Environ. Microbiol. 68:1122–1131 [DOI] [PMC free article] [PubMed] [Google Scholar]
- 53. Turro NJ. 1978. Modern molecular photochemistry. Benjamin-Cummings Publishing Co., Menlo Park, CA [Google Scholar]
- 54. US Environmental Protection Agency 2006. EPA Method 1600: Enterococci in water by membrane filtration using membrane-Enterococcus indoxyl-β-d-glucoside agar (mEI). EPA-821-R-06-009. Office of Water, Environmental Protection Agency, Washington, DC [Google Scholar]
- 55. Varma M, et al. 2009. Quantitative real-time PCR analysis of total and propidium monoazide-resistant fecal indicator bacteria in wastewater. Water Res. 43:4790–4801 [DOI] [PubMed] [Google Scholar]
- 56. Verneuil N, et al. 2006. Implication of (Mn)superoxide dismutase of Enterococcus faecalis in oxidative stress responses and survival inside macrophages. Microbiology 152:2579–2589 [DOI] [PubMed] [Google Scholar]
- 57. Wai SN, Mizunoe Y, Takade A, Yoshida S. 2000. A comparison of solid and liquid media for resuscitation of starvation- and low-temperature-induced nonculturable cells of Aeromonas hydrophila. Arch. Microbiol. 173:307–310 [DOI] [PubMed] [Google Scholar]
- 58. Walters SP, Yamahara KM, Boehm AB. 2009. Persistence of nucleic acid markers of health-relevant organisms in seawater microcosms: implications for their use in assessing risk in recreational waters. Water Res. 43:4929–4939 [DOI] [PubMed] [Google Scholar]
- 59. Whitman RL, Nevers MB. 2004. Escherichia coli sampling reliability at a frequently closed Chicago beach: monitoring and management implications. Environ. Sci. Technol. 38:4241–4246 [DOI] [PubMed] [Google Scholar]
- 60. Whitman RL, Nevers MB, Korinek GC, Byappanahalli MN. 2004. Solar and temporal effects on Escherichia coli concentration at a Lake Michigan swimming beach. Appl. Environ. Microbiol. 70:4276–4285 [DOI] [PMC free article] [PubMed] [Google Scholar]
- 61. Yamahara KM, Layton BA, Santoro AE, Boehm AB. 2007. Beach sands along the California coast are diffuse sources of fecal bacteria to coastal waters. Environ. Sci. Technol. 41:4515–4521 [DOI] [PubMed] [Google Scholar]