Abstract
We propose a novel method to probe the depth structure of the pictorial space evoked by paintings. The method involves an exocentric pointing paradigm that allows one to find the slope of the geodesic connection between any pair of points in pictorial space. Since the locations of the points in the picture plane are known, this immediately yields the depth difference between the points. A set of depth differences between all pairs of points from an N-point (N > 2) configuration then yields the configuration in depth up to an arbitrary depth offset. Since an N-point configuration implies N(N−1) (ordered) pairs, the number of observations typically far exceeds the number of inferred depths. This yields a powerful check on the geometrical consistency of the results. We report that the remaining inconsistencies are fully accounted for by the spread encountered in repeated observations. This implies that the concept of ‘pictorial space’ indeed has an empirical significance. The method is analyzed and empirically verified in considerable detail. We report large quantitative interobserver differences, though the results of all observers agree modulo a certain affine transformation that describes the basic cue ambiguities. This is expected on the basis of a formal analysis of monocular optical structure. The method will prove useful in a variety of potential applications.
Keywords: depth perception, distance perception, art perception, visual space, visual field, geometry
1. Introduction
‘Pictorial space’ is experienced when one looks into a picture, say a photograph or a ‘realistic’ drawing or painting. When looking at a picture one experiences a flat surface covered with pigments in a certain simultaneous order. The awareness is of a two-dimensional array of colors or gray tones. For the sake of easy reference we will refer to it as the ‘visual field’. The visual field is a complicated entity, but in this paper we consider it simply as formally the familiar Euclidean plane, conventionally denoted E2. What is meant by this is that Euclidean movements, which are translations and rotations, change only the spatial attitude of objects in the visual field, leaving their shapes invariant. One often adds similarities to this, which are movements augmented with changes of scale. From a perceptual perspective this is at least roughly the case. From a formal perspective, the structure of the Euclidean plane is induced by its group of similarities, a four-parameter group (one degree of freedom by scaling, two by translation, and one by rotation).
In contradistinction, the pictorial space is a three-dimensional manifold. Although, indeed, three-dimensional, pictorial space is quite unlike the familiar three-dimensional space we move in, here denoted 'Euclidean three space', or, more succinctly, E3. Formally, the structure of E3 is induced by its group of similarities, a seven-parameter group (one degree of freedom by scaling, three by rotation, and three by translation). That pictorial space is quite different from E3 is evident from the fact that a Euclidean rotation about any axis is periodic, something that is unheard of in pictorial space: if you see a frontal (en face) view of a face there is no proper movement in pictorial space that will reveal the back of the head. The reason is simply that if the painting represents an en face view then the back of the head was never painted. What does not exist obviously cannot brought into view by whatever movement. Magritte plays with this when he shows you the back of the head by way of a portrait (The Schoolmaster, painted in 1954): although the viewer longs to see the face, this cannot be brought about. Thus pictorial space is unlike Euclidean space. We will denote it P.
What is the structure of pictorial space P? Evidently, two of its three dimensions are explained by the visual field. Whatever a picture is, it is also (at least) a planar surface covered with pigments in a certain simultaneous order. What pictorial space is more than the visual field appears to be a single dimension usually referred to as ‘depth’. From an experiential perspective depth is ‘otherness’, a remoteness from the egocenter. Unlike egocentric distance, which is the relation of any point of E3 to the vantage point, depth has no natural origin. The eye is not a point of pictorial space. Whereas distance is measured in feet or meters, there is no natural ‘yardstick’ for depth. At best one recognizes relations such as ‘point C divides the depth stretch AB into two equal parts AC and CB’, although even such judgments may stretch one's visual abilities. A formal account must treat the depth dimension as the affine line (conventionally denoted A), recognizing that in many cases there may be even less structure. Points on the affine line are ordered, and the relation of bisection is well defined, but that is all the structure there is. From a technical perspective the ‘proper motions’ of the depth domain are arbitrary linear transformations of positive signature. This has been recognized by visual artists for ages, and it was made explicit by the German sculptor Hildebrand (1901) at the end of the 19th century. It is a two-parameter group, involving a scaling and a shift.
Putting things together, pictorial space P is a ‘fiber bundle’ E2 × A—that is, the visual field augmented by the depth domain. The technical meaning of fiber bundle (figure 1) is that each point of the visual field has its own depth domain and that the depth domains of different points in the visual field never ‘mix’. This lack of mixing vetoes periodic rotations different from those of the visual field proper. It ascertains that you can never see the backsides of pictorial objects. This space is a well-known space among mathematicians. It is very different from Euclidean three space, although there are many similarities (Jaglom 1979; Sachs 1990; Strubecker 1941).
Figure 1.
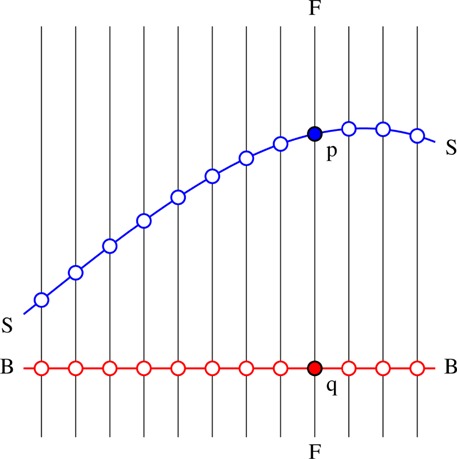
The structure of a fiber bundle. BB is the ‘base space’ (here, the visual field), FF is a fiber (here, the depth domain). Each point of the base space carries a fiber. The ‘submersion’ maps any point, say p on the fiber FF, on the base space, here q. The smooth manifold SS is a ‘section’ of the bundle (here, a pictorial relief). Microgenesis shifts p along FF (similar for all other fibers) on the basis of the ‘pictorial cues’ picked up and processed by the observer. Note that this may change the section SS in many ways, though it can never be ‘moved upside down’. In pictorial space reliefs are one sided.
Since the depth scaling may (linearly) depend upon both dimensions of the visual field, the group of similarities of P is an eight-parameter group, larger than the analogous (seven-parameter) group of E3.(1) Thus P is a non-Euclidean space. Following Klein (1872) the geometry of these spaces is induced by their groups of similarities.
From an intuitive point of view each point of the visual field carries a one-dimensional depth domain. As Berkeley (1709) observed, depth values are not causally defined by the optical structure available to an observer. The physical substrate of a depth domain is a ‘visual ray’, and all points of a visual ray map to the same point on the retina. Depth values are assigned in microgenesis (the precognitive development of awareness; Brown 2002) on the basis of visual cues, the visual cues themselves being precognitive hypotheses (or perceptual abilities) of the observer, rather than optical substructures. The observer moves (in microgenesis) depth values along visual rays like beads on a string, each location of the visual field having its own string, in principle independent of all others. Visual awareness is the end result of this ‘bead game’.
Very general relations between the observer and its environment constrain the rational (though precognitive) assignment of depth values. For instance, there are certain changes of relation between the observer and its environment that are not reflected in the optical structure available to the observer. Examples are scalings of the environment about the vantage points and rotations about the vantage point. The observer is thus free to apply such transformations in setting up pictorial space. Differences in pictorial content between different human observers are often of this type. Whereas their depth values may fail to correlate, one usually finds that they differ only by such an ambiguity transformation (Koenderink et al 2001). Recognition of this type of structure is crucial in the analysis of experiments that address pictorial space. Relations between visual awarenesses have to be judged modulo the ambiguity transformations. A formal account is available elsewhere (Koenderink and van Doorn 2008).
2. Measurements in pictorial space
How does one measure geometrical quantities in pictorial space, which is after all a mental entity? There are a number of issues here, both of a conceptual and of a pragmatic nature. A major conceptual issue is that pictorial entities are mental things and can be defined only operationally, in that sense they are ‘created by the measurement’. This is essentially different from physical entities, which may be conceived to exist even in the absence of a measurement, at least in classical physics. Several pragmatic issues immediately arise when measurements are attempted. For instance, one has to be able to locate entities in the space and one has to be able to apply measuring devices (eg yardsticks) to them.
There exists a very simple, but uncannily effective, way to put a mark on a pictorial object. One simply puts the mark on the pictorial surface and looks at the picture including the mark. What happens is that the microgenetic process moves the mark into pictorial space until it attaches itself to some likely object. For instance, if you put a point-like mark on the facial part of a photographic portrait, the mark will look like it sits on the pictorial skin. It may appear as a freckle or beauty spot, for instance. In general, small marks move back into depth until they are caught by the nearest pictorial surface. In contradistinction, if you put a small mark in the sky area of a landscape picture, the depth of the pictorial mark will be ambiguous. Painters are well familiar with these effects. They locate objects in landscapes by putting them on the pictorial ground. Photographers and especially cinematographers routinely use these properties to suggest spatial configurations that may be widely different from actual scenes. It is not the actual scene that counts; it is the picture (the optical structure available to the observer) that quasi-causally (given the mental make-up of the observer) determines the pictorial space configuration.
There are many ways to introduce yardsticks into pictorial space. In any case one superimposes a picture of the yardstick on the picture surface. A standard way of measurement is comparison. One puts a fiducial ‘gauge object’ next to the object to be measured and judges the ‘fit’. This is the way lengths are measured (the yardstick fits the stretch to be measured), weights are measured (the objects balances a fiducial object on scales), luminances are measured (the comparison is with a standard candle), and so forth. The procedure is not different in pictorial space. Examples include the use of elliptical ‘gauge figures’ to measure surface attitude (Koenderink et al 1992).
In this paper we extend such methods to multilocal configurations in pictorial space. Consider an arbitrary configuration of points. A way to characterize its shape is to list the point-to-point direction for all point pairs of the configuration. For N points there are N(N−1) of such (ordered) pairs. Since the locations of the points in the picture plane are known, there are N unknown depths to be determined. Note that the N(N−1) directions highly overdetermine the depths, which is a good thing from an empirical point of view. Thus, in order to measure the shape of the point configuration, one may attempt to design methods to determine the direction defined by arbitrary point pairs.
Directions in Euclidean E3 are usually determined by way of a pointing device—for example, a conventional theodolite or a weather vane. In order to implement this in pictorial space one has to locate a target and a pointer in pictorial space. This can be achieved using the methods discussed above. Next one needs to be able to change the spatial attitude of the pointer. This again is easy: one simply adjusts the view of the picture of a solid pointer. Giving the observer real-time control over the pointer then implements the method: the observer's task is to point the pointer at the target in pictorial space. One repeats this for many point pairs, and constructs the best-fitting configuration—a three-dimensional point set—to the results. We programmed a simple implementation of this idea and it proves to work very well indeed.
Note that this method differs from many others (eg elliptical gauge figure methods; Koenderink and van Doorn 1995, Koenderink et al 1992, 1994, 1995, 1996, 2001, 2004) in that it bridges arbitrary distances between mutually remote points of pictorial space. This renders the method of much interest because most cues are of a local character or may be applied usefully only to local regions (eg after an initial segmentation of the image). Thus, one expects pictorial space to be possibly locally consistent, both probably globally inconsistent. The method allows one to address such issues.
This paper describes the detailed implementation and thorough investigation of this method. We intend to deploy the method for more extensive investigations of pictorial spaces due to a variety of sources—for example, painterly styles. Thus it is important to study the method quite thoroughly in order to establish it as a viable tool of general utility.
3. Experiments
We report three mutually related experiments. All involve probing the pictorial space of a human observer by having the observer direct a pointer placed at one location in pictorial space such as to ‘point’ to a target located at another location in pictorial space.
The idea of the method is simple enough: one superimposes the images of a pointer and of a target over the image to be sampled, and one instructs observers to adjust the pointer in pictorial space (by way of the image of the pointer in the image plane) to point to the target in pictorial space (again, by way of the image of the target in the image plane). The target invariably looks the same, but the pointer is under manual control of the observer. The pointer has two degrees of freedom: it can change its tilt—that is, the direction in the visual field or, if one wants, in the image plane—and it can change its slant—that is, its inclination in pictorial space (in depth). We have previously used such a pointing method in an outdoor scene (Koenderink et al 2000). A somewhat similar pointing method in pictorial space has been pioneered by Wijntjes and Pont (2010) and has shown to be very promising, though many details remain unexplored. We designed a number of experiments to address such details.
We used only a single stimulus in these experiments (figure 2), a copy by Anne-Sophie Bonno (http://www.atelier-bonno.fr/galerie-copies-arts-graphiques.html) of a wash drawing by Francesco Guardi (1712–93). It is an imaginary landscape, thus there is much pictorial depth, but—obviously—there is not such a thing as ‘ground truth’. It has a well-defined ground plane [an important depth cue (Bian and Andersen 2010)], aerial perspective, gradients of articulation and size, and so forth.
Figure 2.
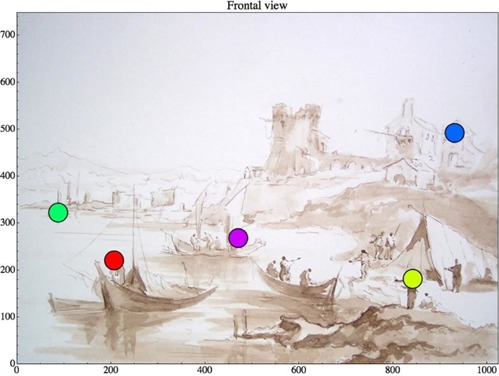
The picture with the fiducial points used in the experiment. The picture is a (close) copy of a wash drawing by Francesco Guardi (1712–93), a capriccio (imaginary landscape with tower ruins and a fisherman's tent) by Anne-Sophie Bonno (http://www.atelier-bonno.fr/galerie-copies-arts-graphiques.html). Scales are in pixels.
Throughout the experiments we used a configuration of five locations on the picture plane (indicated in figure 2). As explained in appendix B, five is the minimum number of points that render the task a nontrivial one. This choice is intentional, because our aim is to test the method. The points have been carefully selected to be well localized in pictorial space. They involve either the heads of pictorial figures, or elements of pictorial architecture. There are points in foreground, near and far middle ground, and background, and there are also variations in height (not necessarily covarying with changes in depth). It is perhaps not superfluous to remark that close scrutiny will reveal various ambiguities, and even cue conflicts in this Guardi drawing. This, together with the fact that the drawing certainly manages to conjure up a remarkable atmosphere and spatiality, makes the example perfect for the occasion.
For each trial a pointer and a target are superimposed on the image (figure 3). The pointer and target are in an evidently different style from the drawing and their sizes are such that they are immediately noticeable. Only one pointer and one target are present at any one trial. During a session each pair of points is visited twice, with a point becoming once target, once pointer. Thus a session contains twenty [N(N−1) for N = 5] trials. The trials are visited in random order.
Figure 3.
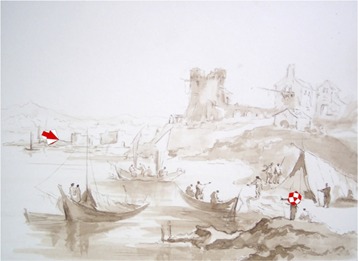
A typical view of the stimulus with target and pointer as the observers experience it during specific trials of a session. Although target and pointer are relatively unobtrusive (pictorial space is hardly affected by their presence), they are easily noticeable. The observer is in control of the spatial attitude of the pointer. This introduces a dynamic aspect that cannot be illustrated in the paper, but is quite important. It increases the experiential difference between the pointer and the (rigid) pictorial content, and increases the three dimensionality of the pointer, which extends all the way over the beeline implicated by the pointer. The coincidence or noncoincidence of the target with the beeline induced by the pointer becomes a vivid element of visual awareness. In the picture we have increased the sizes of pointer and target for the sake of clarity (see methods). Pointer and target have the same sizes, no matter where they appear in the picture.
The designs of pointer and target are shown in figure 4. The pointer (left-hand side) has been carefully designed in such a way that small changes of spatial attitude are easily detected at any spatial attitude the pointer might momentarily be in. This is critical, but not easy to obtain, due to the fact that the head and the shaft of the arrow may occlude both themselves and each other. Depending on such occlusion conditions, different cues as to the spatial attitude of the pointer come into play. The design used in the experiments may not be the optimal solution—it is indeed hard to say what that might be—but it functions quite satisfactorily in practice. That is to say, observers never experienced ranges of spatial attitudes where minor attitude changes were hard to notice. Apparently, the design manages to avoid such ‘dead ranges’. The design of the target (right-hand side) is much less critical, the most important design objective being that it has a clear ‘center’.
Figure 4.
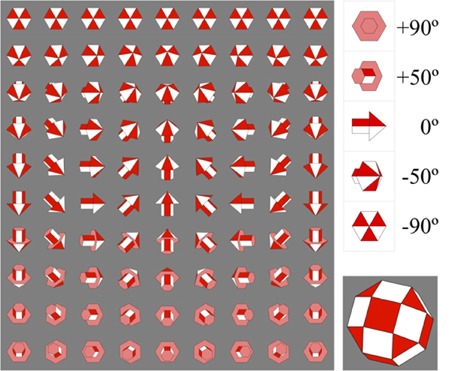
Shown at the left is the design of the pointer. The pointer is designed as a polyhedral arrow, composed of a prismatic shaft and a pyramidal head with rather large semitop angle. The design tries to maximize the sensitivity to small attitude changes regardless of the absolute attitude. In this figure the slant varies in the vertical, the tilt in the horizontal direction. The tilt is a periodic parameter, whereas the slant varies over a finite interval. The observer was permitted to vary slant and tilt independently by means of the left–right/up–down arrow keys of a computer keyboard. Notice that the direction of the pointer is independent of the tilt when the slant equals ±90°. This is visible in the top row, where the slant equals −90°: although the tilt assumes a number of distinct values, all these renderings are identical! Shown at the top right is the appearance of the pointer for a number of slant values. For a slant of +90° the pointer is directed straight ‘into depth’, whereas for a slant of −90° it points straight at the viewer (for any location in the picture plane!). For a slant of 0° the pointer is directed in a frontoparallel surface. Shown at the bottom right is the design of the target. The target is roughly spherical. It is designed as a convex polyhedron with red–white checkered design in order to improve its visibility and three dimensionality. Even though it has a finite size, the location of its center is easily appreciated.
In using the pointing method (figure 3) the observer looks primarily at the picture. Target and pointer occupy only a tiny part of the picture surface area, and, because they are rendered in a style that is quite alien to the style of the picture, they do not have any obvious influence on the pictorial space elicited by the picture alone. This makes the method suitable for studies of picture perception: although the intervention is minimal, one may obtain objective, quantitative data.
For the tilt one has veridical values, or ground truth. In this experiment the tilt is really a superfluous parameter that is not used in the construction of pictorial relief. The relevant parameter is the slant, for which no ground truth exists. The slant is used to construct the pictorial relief. The algorithm used for this construction is explained in appendix A. Note that with N points one determines N(N−1) slant values, whereas the relief consists of N depths with zero mean, thus N−1 independent items. These N−1 items summarize the N(N−1) data items, thus N times as many. This is because the spatial configuration allows one to calculate all slants. Thus the pictorial relief is an efficient representation of the observations, much like a theory or model. The success of such a representation will be an important empirical issue.
In a first experiment ten observers repeated the basic pointing task six times each. This allowed us to analyze the efficacy of the method in considerable detail. Important issues are the repeatability of individual observers over time, the differences between observers, and the consistency of the pointing data. By consistency we mean the degree to which the twenty empirically recorded pointing directions can be accounted for by some three-dimensional configuration of five points. Such a configuration may be regarded as a ‘model’ that should explain the observations. The degree of success of such a model is an indication for the very existence of a pictorial space.
In a second experiment three observers repeated the pointing task two times each, but with an important difference as compared with the first experiment in that they had to use the pointer in reverse. That is to say, they had to point with the tail instead of the head of the arrow. These three observers also participated in the first experiment, so a direct comparison is possible. The rationale of this second experiment is that influences of the pointer geometry on the results of the pointing task are expected to show up if the pointer is used in reverse. Idiosyncrasies of design should flip when head and tail are interchanged.
In a third experiment ten observers repeated the task when viewing the stimulus from an oblique angle. Each observer viewed the stimulus both frontally, and from forty-five degrees from the left and from the right. Each of these three viewing conditions was repeated once, making for a total of six sessions. This experiment is important for a number of reasons. A pragmatic reason is that one would like the pointing task to be useful in only weakly constrained conditions. In such conditions the observer cannot be counted on to confront the stimulus frontally in all trials, although viewing is expected to be roughly frontal overall. The oblique viewing angles of forty-five degrees are extreme and should indicate ample limits on what to expect. Conceptually, oblique viewing addresses a number of important issues (de la Gournerie 1859; Koenderink et al 2004; Pirenne 1970).
4. First experiment
Ten observers (AD, CB, EP, JK, JW, KL, KT, LDW, ML, MS) repeated the measurement six times each. Seven of these observers were not connected to the project and were thus naive regarding the aims; the remaining three (AD, JK, JW) were the authors.
4.1. Methods used in the first experiment
The stimulus was presented on a DELL U2410f monitor, 1920×1200 pixels liquid crystal display (LCD) screen, in a darkened room. The viewing distance was 78 cm. Viewing was monocular with the dominant eye, the other eye being patched or closed. Viewing was through a 4 cm circular aperture at fixed position, the head being stabilized by a chin and forehead rest. The picture measured 36.9 deg (width) by 27.4 deg, thus the foreshortening factor at the left and right edges was 0.951, within 5% from unity, which was our design objective. The pointer had a length of 97 arcmin, the target a diameter of 60 arcmin.
At this distance the available physiological depth cues are expected to be largely ineffective. Binocular disparity is not available due to monocular viewing, thus only monocular parallax and accommodation might be expected to matter. The accommodation difference between the center and the left or right edge of the picture is 0.066 diopters, which is subthreshold. The monocular parallax is 16.7 arcmin for an eye turn of 18 deg (half the diameter of the stimulus). The difference in monocular parallax between center and edge of the picture is 51 arcsec, which is subthreshold. Thus monocular parallax yields a uniform translation over about 17 arcmin for an eye movement subtending about 18 deg, which is again subthreshold. Thus the physiological cues signal either a scene at large distance or a flattish surface. Since observers appear to localize the scene as near to the picture surface (a bit like the view in an aquarium or terrarium), the physiological cues may be expected to contribute a weak tendency to flatness, something that has been verified in other settings (Koenderink et al 1994).
Interaction took place via a standard computer keyboard, using the arrow keys to control tilt and slant of the pointer separately. Observers considered the task a ‘natural’ one and completed a session in about ten minutes, thus taking roughly thirty seconds per trial.
4.2. Results from the first experiment
4.2.1. Total depth range.
In figure 5 the total depth range—that is, the depth difference between the nearest and the farthest points—obtained for each observer is plotted as a function of the session index (1 … 6)—that is, in chronological order.
Figure 5.

The total depth range as a function of session index for all observers that participated in the repeated measurements.
Some of the differences, especially the magnitude of the total depth range, are striking. Observer LDW initially (first and second session) failed to see any depth articulation at all, then gradually developed a finite depth of relief. Such an increase with experience is evident in some of the other naive observers, though most start with a well-developed relief in their first session, with little increase thereafter.
4.2.2. Pointing in reverse directions: the slant.
We typically notice that observers do not point in mutually parallel directions when pointings from A to B are compared with pointings from B to A. In the construction of the relative depths we therefore fit (unique) parabolic arcs instead of straight-line connections (see appendix A). In figure 6 we show an example (session 1 for observer AD). In the majority of cases the arcs are either straight, or sag downwards as in the example; in a minority of cases we also find arcs that bulge upwards.
Figure 6.
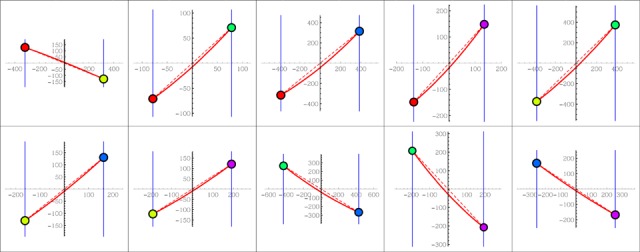
The parabolic arcs for the observed slants in the first session of observer AD. These are the observed arcs as explained in appendix A, figure A2 in a formal, technical sense. The colors of the points can be traced to the points indicated in figure 1. Each subfigure illustrates results for an ordered pair of points, (A, B) say. In the subfigures the first point (A) is always plotted at left, the second point (B) at right, whereas the coordinate system is centered on their center of gravity. The slope of the drawn line at the end points indicates the slants for pointing from A to B (left side) and pointing from B to A (right side). Note the difference of scale of the subfigures. Measures along both axes are in pixels.
In figure 7 we show data concerning the slant settings. In this case we have no ground truth, but we have pointings in opposite directions. It is perhaps natural to hypothesize that pointing from A to B should yield the same slant as pointing from B to A, except for sign. Given the possible depth asymmetry that A might be either closer or farther than B, it makes sense to order pairs and to compare ‘near-to-far’ (NF) with ‘far-to-near’ (FN) pointings. Such a scatter plot is shown in figure 7a. The correlation coefficient is 0.760. There appears to be a systematic offset of perhaps about ten to twenty degrees. Indeed, the best-fitting linear relation is |sFN| = 0.964 |sNF| + 14.82 deg, which is clearly different from the expected relation |sFN| = |sNF| (the difference between the red and black lines in figure 7a). A histogram of the difference of absolute values |sFN| − |sNF| is shown in figure 7b.
Figure 7.
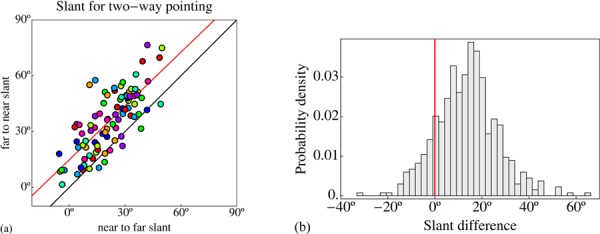
(a) A scatter plot of the slants for the near-to-far and far-to-near pointings for all fiducial point pairs and all observers (colors indicate observers). The black line is the (naively) expected relation, which is that these slants should differ only in sign; the red line is the best fit. It has an offset of 14.82 deg and a slope of 0.964. (b) A histogram of the differences of all absolute values. The systematic shift of about fifteen degrees is clearly apparent.
4.2.3. Pointing in the picture plane: the tilt.
In figure 8 we show the comparison of the tilt settings with the ground truth. The veridical values were simply computed from the picture coordinates of the fiducial points (figure 9a).
Figure 8.
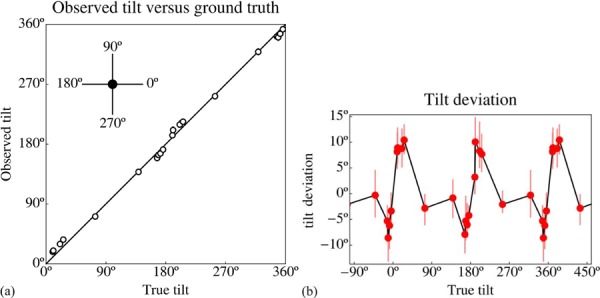
(a) A straight scatter plot of the observed tilts versus the veridical values for all observers. The symbols represent the median values; the interquartile range is indicated by a vertical bar (hardly visible because it is so small). In (b) the deviations from the veridical values have been magnified. Some values have been repeated cyclically to better show the overall trend.
Figure 9.
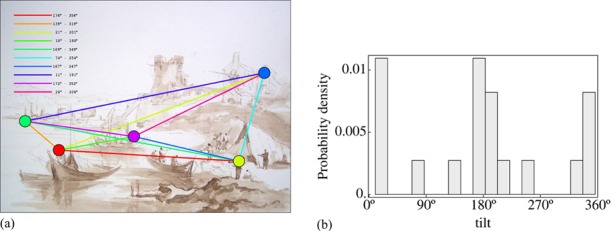
The sampling of the tilt domain is far from dense, nor even approximately uniform. In (a) the tilts for the various trials are indicated. Note that each point pair defines two tilts, one for each of the two pointing directions. This figure enables one to identify the trials that produced the data points in figure 8. (b) The distribution of tilts: they are concentrated on the horizontal, and the vertical is hardly represented.
Although the correlation with the ground truth is high (0.962), one spots systematic deviations in a straight scatter plot (figure 8a). These deviations are shown magnified in figure 8b. Near the horizontal directions (tilts 0°, 180°, and 360° in the figure) the deviations are largest, apparently changing sign at these precise values. There is a tendency for directions near the horizontal to move away from the horizontal. A lack of suitable data points (figure 9b) prevents one from studying the situation near the vertical directions (−90°, 90°, 270°, and 450° in the figure), but there might be a trace of the analogous phenomenon.
4.3. Further analysis of the first experiment
Although observers had to adjust both tilt and slant (as this appeared to be the more natural task to us), the observed tilt values have no further use in the construction of the pictorial relief. They are simply discarded. The systematic deviations from veridicality are perhaps of some interest, though only marginally so for the present purpose. There exists a literature on such effects (Andrews 1967; Appelle 1972; Bouma and Andriessen 1968, 1970; Hansen and Essock 2004; Timney and Muir 1976), though this leads to somewhat confusing, perhaps even mutually contradictory, expectations.
4.3.1. Two-way pointing and the curvature of connecting arcs.
The case of the slants is of immediate interest to the issue of the nature and even the very existence of a pictorial space. The systematic difference between NF and FN pointing appears puzzling. It may be intrinsic, and thus perhaps reveal a property of the structure of pictorial space, or it may be due to the specific design of the pointer. The latter topic will be addressed further in the second experiment. The presence of this pointing asymmetry is not problematic in the construction of the three-dimensional configuration. In appendix A it is explained how it can be handled in a natural way. Observers apparently point via slightly curved arcs. Notice that an arc counts as ‘curved’ if it differs significantly (in view of the observational error) from a straight line. The interesting observation is that this is typically the case. That the curvature is indeed systematic is also evident from the fact that the curvature is predominantly in a single sense. This topic is explored in appendix C. The conceptually interesting issue centers on the curvature of these arcs. Figure 9 shows the median and interquartile ranges of the curvature for the ten observers individually.
The curvature levels zero and minus one in figure 10 are of special interest. They relate to the issue of whether observers point in some pictorial space, unrelated to the viewing geometry, or whether they treat the picture frame as an ‘aperture’ (or ‘window’) through which they view a real space, related to the position of their eye. In the aperture case the observers are expected to point along curved arcs with curvature of minus one in our analysis (see appendix C). In figure 10 one sees a spectrum of levels. Levels of observers EP and JK are close to zero, of observers AD and KL close to minus one, whereas observers JW and LDW are in between. In addition, we find four observers (CB, KT, ML, and MS) who evidently are in a different ball park with much stronger negative curvatures. These latter observers also have much wider interquartile ranges.
Figure 10.
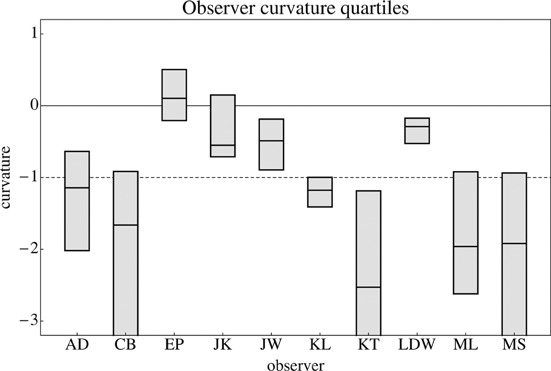
Quartile ranges and median of the curvature for all observers who performed the task six times. The dashed line is the tentative relation based on an analysis of the structure of pictorial space (appendix C).
4.3.2. Interobserver differences of the five-point configuration.
In figure 11 we show the spatial configuration that best explains the slant settings of observer AD in the first session. This is indicative of the overall results. In the front panel of the box (the xy-plane) one has the picture plane. The coordinates are pixel counts. The z-dimension is ‘depth’, which is a hypothetical entity that is set up to account for the observed slants. It is a derived empirical dimension that is our operationalization of a mental dimension (usually denoted depth), a quality that roughly signifies ‘degree of remoteness from the self’. There is no natural depth origin. Depth differences are expressed in terms of pixels.
Figure 11.
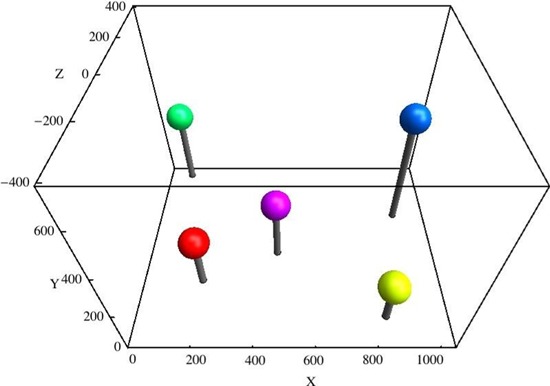
The three-dimensional configuration in the visual space of observer AD (first session). The colors are those introduced in figure 2.
In figure 12 we show ground plan and elevation for the three-dimensional configurations determined in the first session of observer AD and LDW. For the first session of observer LDW these are a horizontal row in the former and a vertical row in the latter case, whereas for observer AD the depth range is of similar size as the picture size. Note that, due to the (arbitrary) constraint used in the construction, the average depth is zero. The construction allows one to construct only relative locations. This makes sense if one notices that the eye (or the ‘self’) is not located in pictorial space. Thus the depth dimension has no natural origin. It is most appropriately modeled by the affine line with coordinate ranging between minus and plus infinity. The depth dimension is vertical in the plan, and horizontal in the elevation. Although the locations of these lines are well determined by the location of the point in the picture plane, the location of a point on such a line is determined by the observer. There is no notion of a ‘veridical location’ here. It is a mental entity, possibly determined by the totality of pictorial cues as identified by the observer. The mind shifts the points along their respective depth dimensions like the beads on an abacus (or counting frame), as formalized in figure 1. If these constructions indeed reflect what is in visual awareness, observer AD experienced a scene in depth whereas observer LDW experienced a mostly flattish picture.
Figure 12.
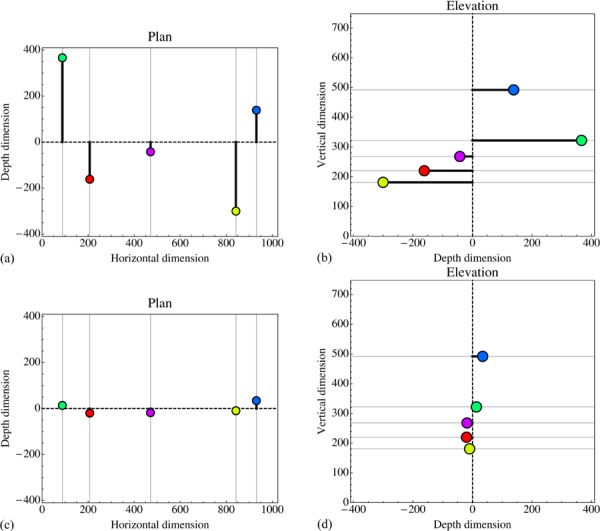
In the top row the configuration in three-dimensional pictorial space as determined in the first session of observer AD. (a) A ground plan (horizontal coordinate equals the horizontal position in the picture plane); (b) an elevation (vertical coordinate equals the vertical position in the picture plane). The observed values are the depths, plotted vertically in the plan, and horizontally in the elevation. The points are color coded like those in figure 2; the reader will have little trouble to identify the points in the pictorial scene (as opposed to just the picture surface). The horizontal and vertical lines in these figures show the depth dimension in which the points are located. The bottom row shows the configuration for the first session of observer LDW on the same scale; note the compressed depth range as compared with AD.
The zero depth level, indicated through the dashed line (horizontal in the ground plan, vertical in the elevation), has been arbitrarily assigned as the mean. Thus the thick line segments highlight the deviations from the mean that are the deviations from frontoparallel. The greater the magnitudes of these variations, the greater the ‘depth of relief’. Apparently, observer LDW has a much narrower depth of relief than observer AD. However, the deviations of LDW are very close to being scaled copies of those of AD (correlation 0.94), thus the observers ‘play the same depth beads game’. This is to be expected: after all, the dilation along the depth direction is not specified by the pictorial cues, and must be supposed to be essentially idiosyncratic.
There is quite a variety in the three-dimensional constructions of the various observers, which is perhaps not unexpected as the stimulus offers only lacunary, ambiguous, and partly conflicting pictorial cues. The nature of the idiosyncrasies is analyzed in more detail below. The three-dimensional configuration is the objective of the method, which is why we show it (figures 11 and 12) first. In a derived sense it can be regarded as the experiential ‘response’ to the ‘stimulus’ (the Guardi drawing, figure 2). In order for such an interpretation to make sense one has to consider many details. These are presented next.
If one computes slants from the three-dimensional configuration using Euclidean geometry, the results will automatically satisfy the relation sFN = −sNF. This makes it somewhat hard to judge the consistency of the geometry. Therefore, we study the observed depth gaps, which are proportional to the average of the tangents of sFN and −sNF instead. (The notion of observed depth gap is explained in a technical, formal sense in appendix A.) They can be directly compared with the explained depth gaps, which trivially follow from the depths.
To reiterate, because the distinction might have escaped the reader:
-
•
the observed depth gap between two locations is a simple function of the slant settings at these locations, roughly the average slant multplied by the separation in the picture plane;
-
•
the explained depth gaps are defined only after the conclusion of the experiment and depend upon the depth values assigned to the locations. Because this involves a global minimization procedure in order to deal with geometrical inconsistencies, these depths depend upon all settings. The explained gap between two locations is simply the difference of the depth values.
In an ideal world (no observational scatter, no inconsistencies) the depths would fully ‘explain’ (in the sense of ‘account for’) the observations. In practice, part of the slant settings is discarded as ‘noise’, and another part as ‘geometrical inconsistency’. As we show in this study, the differences are actually minor though.
The observed depths gaps are also useful in comparisons between observers. The correlation (table 1) is quite good, though the slopes of the regression are widely different.
Table 1. Correlations of observed depth gaps for all pairs of observers.
| CB | EP | JK | JW | KL | KT | LDW | ML | MS | |
| AD | 0.93 | 0.97 | 0.98 | 0.97 | 0.96 | 0.82 | 0.94 | 0.94 | 0.96 |
| CB | 0.94 | 0.95 | 0.95 | 0.94 | 0.94 | 0.93 | 0.93 | 0.96 | |
| EP | 0.99 | 0.97 | 0.96 | 0.89 | 0.96 | 0.98 | 0.99 | ||
| JK | 0.97 | 0.98 | 0.9 | 0.97 | 0.98 | 0.99 | |||
| JW | 0.91 | 0.89 | 0.89 | 0.93 | 0.95 | ||||
| KL | 0.85 | 0.99 | 0.97 | 0.98 | |||||
| KT | 0.86 | 0.91 | 0.92 | ||||||
| LDW | 0.97 | 0.97 | |||||||
| ML | 0.99 |
Table 1 shows the correlations for all pairs of observers. All correlations are over 0.82, almost all (87%) in excess of 0.9. In table 2 we show the slopes of the regression lines. These mutually differ by factors up to four, reflecting the extremely wide range of depth of relief for the various observers.
Table 2. Slopes of the regression for the depth gap data of all observers.
| AD | CB | EP | JK | JW | KL | KT | LDW | ML | MS | |
| AD | 1 | 0.9 | 0.42 | 0.91 | 0.51 | 0.3 | 0.63 | 0.21 | 0.82 | 0.87 |
| CB | 0.96 | 1 | 0.41 | 0.91 | 0.51 | 0.3 | 0.74 | 0.22 | 0.83 | 0.89 |
| EP | 2.28 | 2.13 | 1 | 2.15 | 1.19 | 0.7 | 1.6 | 0.5 | 2 | 2.1 |
| JK | 1.06 | 1 | 0.45 | 1 | 0.55 | 0.33 | 0.74 | 0.23 | 0.92 | 0.97 |
| JW | 1.85 | 1.75 | 0.78 | 1.7 | 1 | 0.53 | 1.29 | 0.38 | 1.53 | 1.63 |
| KL | 3.1 | 2.95 | 1.32 | 2.92 | 1.54 | 1 | 2.11 | 0.72 | 2.71 | 2.85 |
| KT | 1.07 | 1.18 | 0.5 | 1.09 | 0.61 | 0.35 | 1 | 0.25 | 1.03 | 1.09 |
| LDW | 4.18 | 4.02 | 1.82 | 3.99 | 2.08 | 1.37 | 2.93 | 1 | 3.76 | 3.93 |
| ML | 1.08 | 1.03 | 0.48 | 1.05 | 0.56 | 0.35 | 0.8 | 0.25 | 1 | 1.03 |
| MS | 1.06 | 1.02 | 0.47 | 1.01 | 0.55 | 0.33 | 0.78 | 0.24 | 0.95 | 1 |
Apparently, observers have widely different depth ranges, although their qualitative responses (normalized for the magnitude of depth of relief) are rather similar. This might have been expected from the ideas first formulated by the German sculptor Adolf Hildebrand (1901). Various recent, quantitative studies of pictorial relief agree with this (Koenderink and van Doorn 1995, Koenderink et al 1992, 1994, 1995, 1996, 2001, 2004).
4.3.3. The existence of pictorial space.
A key issue involves the very existence of a pictorial space. Specifically, the question is whether the data can be ‘explained’ by the assumption of a five-point configuration in three-dimensional space. An observed depth gap is defined for each pair of points (A, B) (say). One observes two slant values, one for pointing from A to B, and one for pointing from B to A. From these two slant values and the mutual distance of the points in the picture plane one finds a unique depth gap. Since there are ten pairs, one ends up with ten observed depth gaps. A five-point configuration is defined through five depth values with zero average value, thus it has only four degrees of freedom. It is evidently not possible to account for ten independent observations this way (see figure 13). Thus one constructs a configuration of five points that explains the observed depth gaps in the least squares sense. Such a configuration yields ten explained depth gaps that are—by construction—consistent with the existence of a five-point configuration. These explained depth gaps will generally differ from the observed ones. Their correlation is a measure for the consistency of the observations with the hypothesis of a five-point configuration. The R2 value can be interpreted as the part of the variance of the observed depth gaps that is explained by the hypothesis of a five-point configuration.
Figure 13.
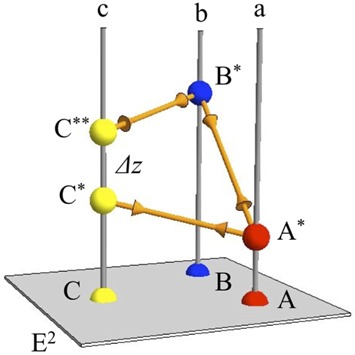
The basic inconsistency in multiple pointing results is best brought out for the ‘intransitive triangle’, like ABC in this figure. The points A, B, C lie in the visual field E2; they give rise to the visual directions a, b, c. Suppose one has the two-way directions for AB, BC, and CA. Fixing A∗ (arbitrarily), one may then find B∗ and C∗. Once B∗ has been found one also finds C∗∗. Of course, C∗ and C∗∗ are unlikely to coincide, even in the best of worlds. The depth difference C∗ − C∗∗, that is Δz, is the ‘mismatch’ for the triangle ABC. In more complicated configurations every subtriangle is almost certainly intransitive. In practice one finds the ‘best’ configuration in the least squares sense. In this case one would simply put the point C in depth in the middle of C∗ and C∗∗. The more sophisticated algorithm distributes the resulting mismatches evenly over all subtriangles. For the five-point configuration, there are ten such triangles.
In figure 14 we show scatter plots of the explained depth gaps against the observed depth gaps for all observers. The R2 values (shown on top of the panels in figure 14) are in the 0.73–0.86 range. These values indicate that the observations are at least reasonably consistent with the interpretation of a point configuration in three-dimensional space. In order to address this important issue, which implicates the very existence of pictorial space, in detail, a more intricate analysis is required. Such an analysis can be based on an appropriate Monte Carlo simulation. This analysis can be used to determine whether the observed spread in repeated sessions accounts for the deviations of the observed depth gaps from a five-point configuration.
Figure 14.
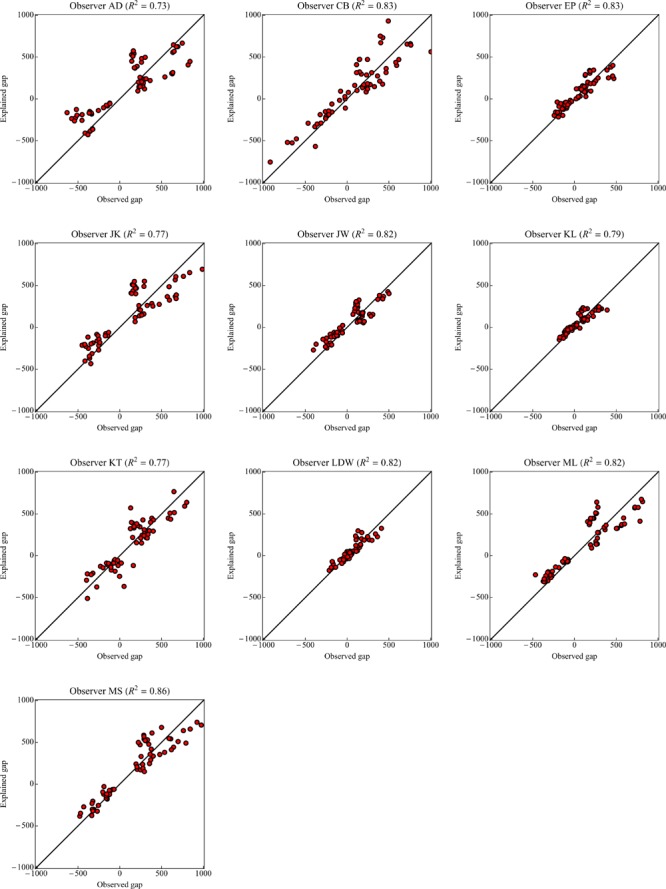
Scatter plots of the explained depth gaps against the observed depth gaps for all observers. Note that the correlations are quite high (coefficients of variation 0.73–0.86).
Repeated sessions allow one to study the variation in slant settings and thus in the observed depth gaps. Intuitively, the smallest discrepancies between observed slants and a set of slants obtained from a three-dimensional point configuration should be of the same magnitude as the variability of the observed slants over repeated sessions. If this is not the case, then the observations cannot be accounted for by any point configuration, and one would be forced to agree that pictorial space is a nonentity in a formal, geometrical sense. This affects the very way one discusses the issue of spatiality in pictorial viewing.
In order to assess this important question we need to address two topics: one is the nature of the slant variability, the other the implication for the geometrical configuration. In figure 15 we consider both points.
Figure 15.
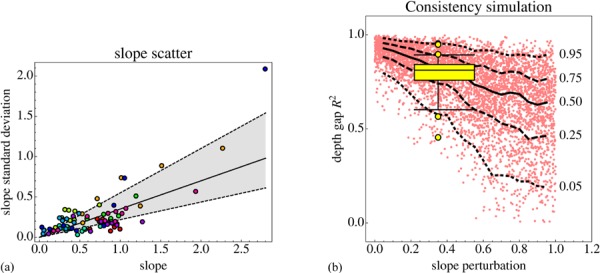
(a) The standard deviations of the slope (the slope is the tangent of the slant) as a function of the magnitude of the slopes for all observers (color indicates observers). The line indicates a Weber law with Weber fraction 0.35 (median value); the range between the dashed lines shows the interquartile range (0.22–0.55). The lowest value of the slope standard deviation is 0.032. (b) The result of a simulation that finds the coefficient of variation between the estimated and observed depth gaps as a function of the Weber fraction. A ‘true’ geometry of 200 times the first principal component (see text) was used, which is roughly the median configuration. The simulation is composed of 5000 runs. Quartiles and 0.05 and 0.95 quantiles were calculated in 0.1 width moving windows. The yellow whisker dot plot indicates the range of empirical coefficients of variation; shown are the quartiles, 5% and 95% quantiles, and the outliers. The width suggests the uncertainty in the Weber fraction. As the interquartile regions overlap, and the range of outliers is similar, we conclude that the observed Weber fraction explains the coefficients of variation encountered in the empirical data.
In figure 15a we plotted the standard deviation in the slope—that is, the tangent of the slant—as a function of the slope itself. There are several formal reasons why the tangent may be preferable to the angle here. We find an approximate Weber law behavior with Weber fraction 35%. Since the data are rather noisy, we infer that the Weber fraction lies roughly in the range 22–55% (interquartile range). Note that such a ‘Weber fraction’ is categorically unlike some threshold measure because the slopes are produced by the microgenetic process, rather than detected.
In order to find the influence of slant scatter on the three-dimensional point configuration we used a Monte Carlo procedure. We decided on a ‘true’ point configuration that was about the median of that obtained for all observers and computed the ‘fiducial’ slants for that configuration. Then we perturbed these slants with normally distributed noise with zero mean and standard deviation according to the Weber law deduced from figure 15a. These perturbed slants then entered the calculation of a best-fitting point configuration. This causes inevitable inconsistencies between the depth gaps implied by the perturbed slants and the depth gaps from the calculated depths. We repeated this simulation five thousand times for Weber fractions distributed uniformly in the range 0–100%. The result is shown in figure 15b. We calculated moving quartiles and 5% and 95% quantiles for a 0.1 width window, also indicated in the figure. The empirically determined coefficients of variation (from figure 14) are indicated by the yellow whisker dot plot. We conclude that the data (twenty slant settings) are consistent with a three-dimensional configuration of five points (five depth values). Thus, judging from the present data, the hypothesis of the existence of a pictorial space is a useful one.
4.3.4. Overall spatial attitude and shape of the five-point configuration.
In appendix A it is explained how the observed slants are used to compute the three-dimensional configuration. Since the picture plane coordinates of the fiducial points are known by selection, one merely needs to calculate the five depth values. Because absolute depth is not revealed by pointings, one conveniently sets the average depth to zero, thus the solution contains only four degrees of freedom. Since it is inconvenient to work with such four-dimensional entities, it is useful to distinguish a number of mutually independent partial descriptions with immediate geometrical meaning. The first such entity is the overall spatial attitude of the three-dimensional configuration.
The overall spatial attitude is found by fitting a function z(x, y) = a + Gxx + Gyy to the depths. Here z denotes the depth of a point (x, y) in the picture plane. The offset a is irrelevant, the gradient G—that is, a vector (Gx, Gy)—is the interesting entity. Figure 16 is a scatter plot of the gradients for all sessions of all observers; in figure 17 histograms of the direction and the magnitude (that is, the tangent of the slope) of the gradients are presented.
Figure 16.
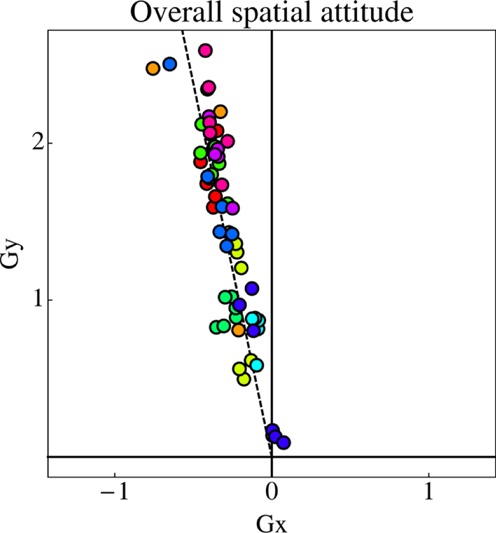
Scatter plot of the gradients for all sessions of all observers. Note that the points cluster about a single direction in gradient space; the dashed line is the best fit. It is directed at 102°, thus close to the y-direction (90°).
Figure 17.

(a) A histogram of gradient directions; (b) a histogram of gradient magnitude (converted to obliqueness) for all sessions of all observers. The direction peaks sharply at about 100°, whereas the obliqueness ranges over a few degrees to about eighty degrees.
There is evidently little spread in the direction (median 101°, interquartile range 99–103°), but a huge spread in the magnitude of the gradient (median 58°, interquartile range 42–63°, extremes 7° and 69°). The direction of the gradient is very close to that of the sloping ‘ground plane’ of the stage behind the classical proscenium arch. The slope (‘obliqueness’) has a wide range. In the one extreme case the ground plane is actually close to a frontoparallel plane: the variation one sees here is roughly between a stage that runs into depth and a mere backdrop.
If one conceives of the picture plane as of a conventional proscenium arch, with pictorial space extending behind it like a stage, one may draw the model shown in figure 18.
Figure 18.
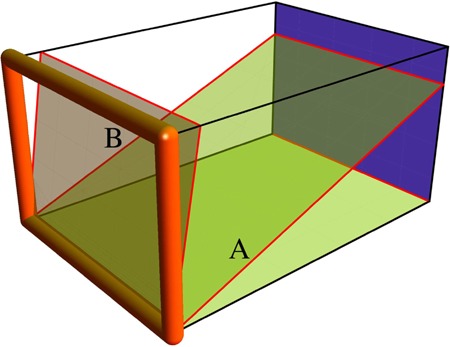
A classical stage with proscenium arch. The slightly sloping ground plane A corresponds to the deepest pictorial space found in the experiment; the plane B, which already approaches the attitude of the frontoparallel backdrop (blue), corresponds to the shallowest.
Reckoning depth from the best-fitting overall plane leaves one with a ‘pure relief’. Since subtracting the overall plane removes two degrees of freedom, the pure reliefs have two degrees of freedom left. A principal components analysis bears this out: one finds only two principal components, P1 and P2 (say). The ratio of singular values involved is 4.66, thus both components are significant. Projection of all data on the plane of principal components reveals that essentially all line up with P1.
The projections are very close to P1, as is evident from the projections on the P1P2 plane for the ten observers (figure 19). The projections are prominently along the first principal component. This is also evident from figure 20, which is perhaps the more intuitive representation of this fact. Thus all ten observers ‘see the same shape’ (give or take a little slope—that is, the projection along the second principal component), albeit with mutually very different magnitudes.
Figure 19.
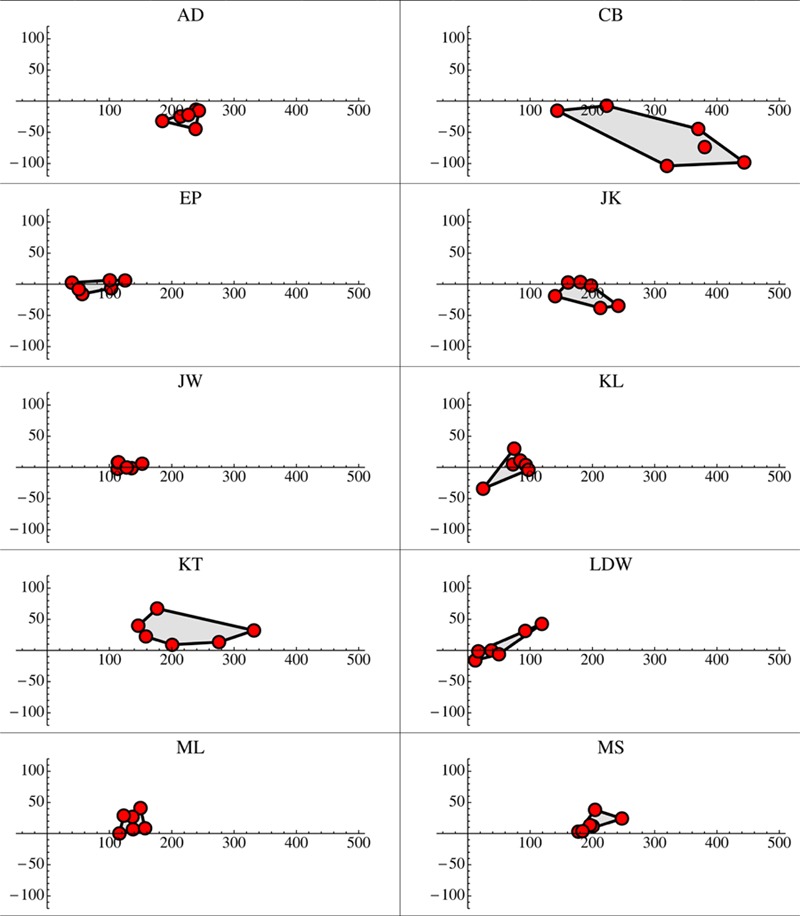
Projections on the plane spanned by the principal components for all ten observers. The first component is horizontal, the second vertical, in these plots. The red dots indicate the individual sessions, the gray polygonal areas their convex hulls in the plane. Apparently, the first component dominates the responses, indicating that all observers ‘see the same shape’, at least qualitatively.
Figure 20.
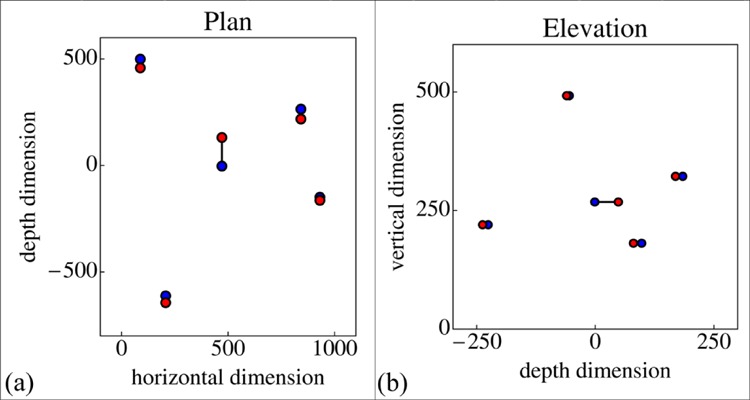
The principal shape components: (a) in the ground plan; (b) in the elevation. Each connected point pair shows P1 ± a P2, where a is half the interquartile range of the projections along P2. The sign is indicated by color.
Although ‘shape space’—that is, the principal components P1P2 space—is two dimensional, it is only the direction with respect to the origin that encodes ‘shape’ in the true sense. (This may be specified by the ‘shape angle’; see appendix B.) The distance from the origin has to do with depth of relief, rather than shape in the proper sense. The depth of relief can also be measured as the standard deviation of the depths after subtraction of the overall best-fitting plane. This ‘depth range’ (not to be confused with the total depth range as used in figure 5) is a parameter that is of obvious interest by itself. The quartiles of the depth ranges for all sessions of all observers are plotted in figure 21.
Figure 21.
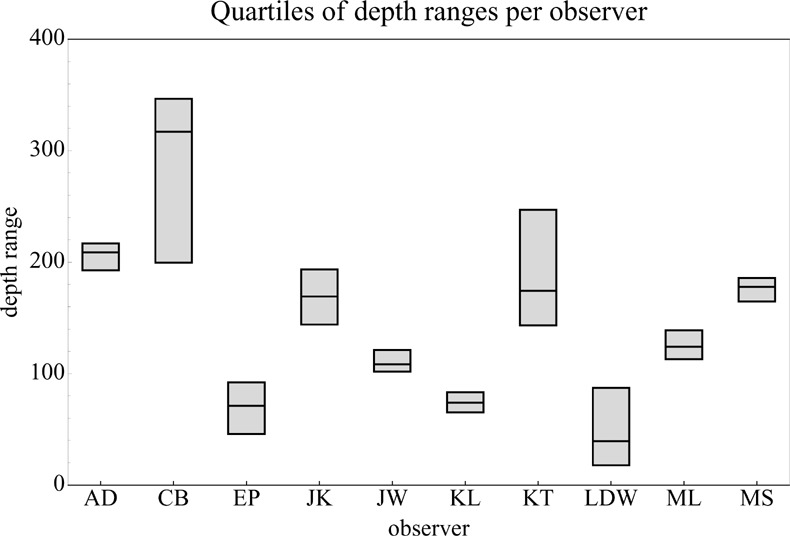
Quartiles of the depth ranges for all sessions of all ten observers; depth range in pixels.
There is a wide variety of depth ranges, the extremes differing by about a factor of four. Interquartile ranges are relatively narrow, indicating that the depth range is relatively well defined for each individual observer and must be considered an idiosyncratic quantity. Such variations have been reported before with very different methods (Koenderink and van Doorn 2003, Koenderink et al 1992, 1994, 2001).
One might expect the depth range to correlate with the gradient magnitude, as a small obliqueness indicates a tendency towards frontoparallelity. This is explored in the scatter plot shown as figure 22b. The coefficient of variation is 0.58, thus indeed quite remarkable. The basic structure of the data is also apparent from the plots in figure 22a.
Figure 22.

(a) The overall plane and the depth range in a plane that runs into depth (left to right in the figure) and has the vertical picture coordinate ranging from bottom to top. (Note that this graph does not require numerical scales: the total vertical extent is simply the picture height and the depth is on the same scale as the height. (b) The same data are shown as a scatter plot, with a regression line in black. Note that the ‘slope’ is the tangent of the corresponding angle (range in pixels).
Almost all of the properties that were quantified above can be traced in the combined plot of the point configurations in figure 23, though it takes perhaps a little determination. The huge difference between observers with respect to overall spatial attitude and depth range is apparent, but also the fact that the pure shape (that is to say, the geometry modulo overall attitude and range) is remarkably similar. Apparently, all observers are aware of the same configuration (the qualitative aspect), albeit in somewhat idiosyncratic ways (the quantitative aspect).
Figure 23.
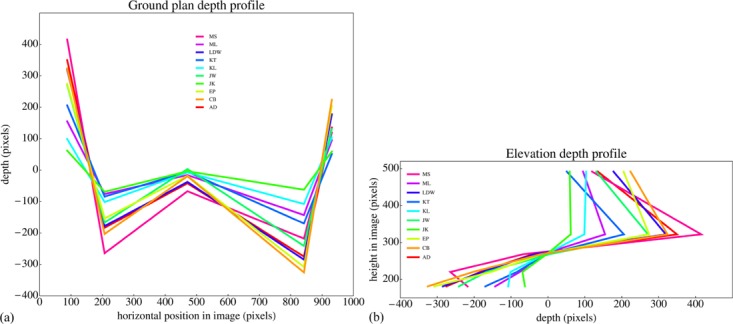
Median configurations for all observers in (a) ground plan and (b) elevation. The points have been arbitrarily connected to increase the readability of the figure. Compare with figure 12.
5. Second experiment
Might the perhaps surprising deviations illustrated in figure 7 (for the slant) and figures 8 and 9 (for the tilt) be due to the design of the pointing device? After all, the pointer looks different as seen ‘from above’, looking at the tip, and as seen ‘from below’, looking at the tail. This is the methodologically important issue which is addressed in this second experiment. The first experiment was repeated, but this time the task was changed to ‘inverse pointing’ (figure 24).
Figure 24.

(a) The normal procedure, where the pointer is supposed to ‘point’ to the target. (b) ‘Inverse pointing’, where the observer adjusts the pointer such as to point away from the target. In both cases illustrated here the target is closer than the pointer, yet in the left case one looks at the tip, in the right case at the tail of the target.
Observers AD, JK, and JW (the authors), also observers in the first experiment, performed six sessions each. This should allow some conclusions as to the importance of the pointer design.
5.1. Methods used in the second experiment
Methods used were identical to those that pertain to the first experiment, except from the instructions given to the observers. Although the instruction might seem an awkward one, no one of the observers had any particular trouble with it. They performed sessions in the same time as in the first experiment.
The methods of analysis were identical to those for the first experiment. In fact, the same programs were used after an initial stage in which the observed directions were inverted. Thus the observations are immediately comparable.
5.2. Results from the second experiment
In figure 25 the deviations of the tilt from the veridical values are plotted. The graph is based on the quartiles for all sessions and all observers. The correlation between the observed and veridical tilts is 0.9982 (it was 0.9975 in the first experiment, for the same observers), but the deviations near the horizontal directions are pronounced. These deviations are not different from the previous experiment, thus the asymmetries in the pointer design (which would possibly matter if the tilt is accompanied by a nonzero slant) appear to be irrelevant.
Figure 25.
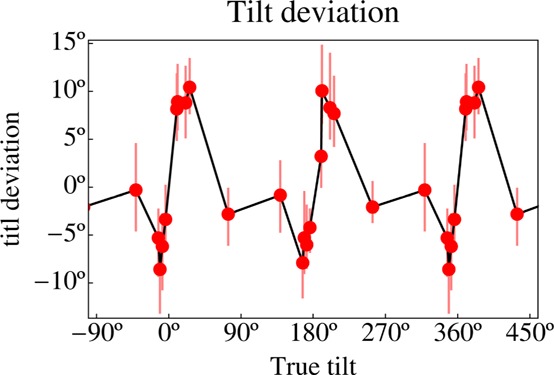
Tilt deviations in the case of inverse pointing (compare with figure 8b). The same type of deviations are encountered in both cases. This plot shows pooled data of observers AD, JK, and JW.
Figure 26 shows the histogram of differences of absolute slant from NF and FN pointings. It is not essentially different from the result found in the first experiment. The correlation between NF and FN slants is 0.92, and the offset is 7.46°. For these observers the correlation between NF and FN slants in the first experiment was 0.83, whereas the offset was 8.47°.
Figure 26.
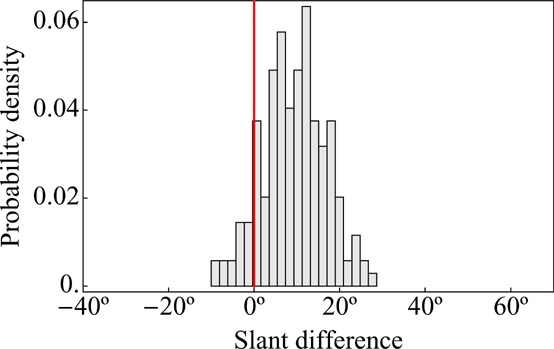
Histogram of the differences of absolute values of near-to-far and far-to-near slants (compare with figure 7b, which is based on a much larger group of observers). The same type of deviations are encountered in both cases. This plot shows pooled data of observers AD, JK, and JW.
5.3. Further analysis of the second experiment
The data for observers AD, JK, and JW in the first and second experiments are not significantly different. We conclude that there is no reason to assume that the asymmetrical design of the pointer has biased the results in the first experiment. Most importantly, we conclude that the curvatures reported in the first experiment reflect intrinsic properties of the structure of pictorial space as they apply to the individual observers, and cannot be attributed to the singular geometry of the pointer.
6. Third experiment
In the third experiment we explored the consequences of oblique viewing of a picture. This has important applications in practical settings (Cutting 1986, 1987; Deregowski et al 1994; Deregowski and Parker 1995; Goldstein 1979, 1987, 1988; Hagen 1976; Halloran 1993; Koenderink et al 2004; Perkins 1973; Pirenne 1970; Sedgwick 1991). It has also some interest in relation to the first experiment in which the edges of the picture were seen at an oblique angle of about 72° instead of head-on (90°) as at the center. Since cos(90−72) = 0.951, which is close enough to 1.00, only minor effects are to be expected, but it is useful to obtain some insight as to the possible consequences. In the third experiment the foreshortening is much larger since we used 45° oblique viewing angles, thus the foreshortening at the center of the picture is cos(45) = 0.707 (figure 27).
Figure 27.
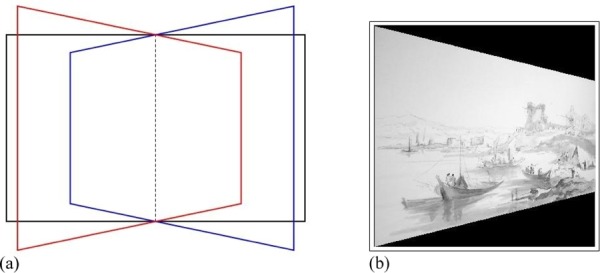
The perspective deformations induced by the oblique viewing conditions used in the third experiment.
In line with this objective we changed nothing but the viewing direction. That is to say, the target and pointer were drawn on the screen exactly as in the frontal condition, thus were seen foreshortened in the oblique conditions. The construction of the three-dimensional configuration was also done using exactly the same algorithm—that is to say, we did not use horizontally foreshortened distances in the calculation. This allows an immediate appreciation of the effects of oblique viewing on the results obtained in normal (frontal) viewing.
A total of ten observers (AD, CB, DA, FA, JJ, JK, JW, KVC, ML, and SP) participated in the experiment, the authors AD, JK, and JW among them. Five observers also participated in the first experiment. Each observer did all three tasks (viewing from the left, frontally, and from the right) two times.
6.1. Methods used in the third experiment
Apart from the frontal viewing, as in the first experiment, we rotated the monitor through the central vertical axis in the picture plane over 45°, both clockwise and anticlockwise, thus obtaining three distinct viewing conditions.
Otherwise, all methods and conditions are identical to those reported for the first experiment.
6.2. Results from the third experiment
The results for the various observers span a wide range, although the qualitative effects of oblique viewing are similar for each. The examples presented in figure 28 roughly span the range. The three-dimensional configuration is seen to shear. The rather large differences in total depth range remain in the instances of oblique viewing.
Figure 28.
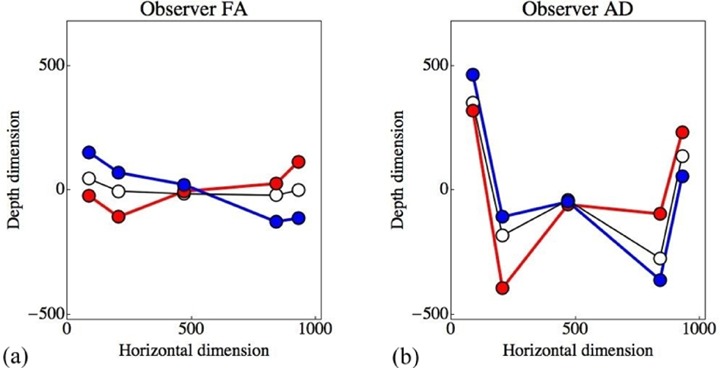
Pictorial configurations projected in the ground plan for observers (a) FA and (b) AD. These observers are very different, observer FA yielding remarkably shallow depth, observer AD ample pictorial depth. Yet both observers (as all the others) show very much the same effect. The overall best-fitting plane rotates in the direction of the picture plane, though not by ±45° but by rather less. All measures are in terms of pixels; blue denotes ‘clockwise’, red denotes ‘anticlockwise’, white denotes ‘frontal’.
The same results may be represented in a perhaps more intuitive way as in figure 29. In this figure the primary viewing direction is drawn vertically and the plane of the picture (in this case the LCD monitor screen) is indicated by a thick black line. This picture clearly shows the foreshortening of the picture plane and the attitude of the three-dimensional configuration with respect to the primary viewing direction. This representation is especially apt when the observer has little notion of the exact spatial attitude of the picture plane, as has been reported for similar set-ups (Koenderink et al 2004).
Figure 29.

A representation of the projections of the three-dimensional configuration in the ground plan for observers (a) FA and (b) AD (compare with figure 28). The picture plane has been added (the thick black line segment) and has been placed such as to suggest the attitude corresponding to the clockwise (blue), frontal (white), and anticlockwise (red) viewing conditions. The viewing direction is always along the dashed lines.
6.3. Further analysis of the third experiment
In figure 30 the changes of the overall best-fitting plane have been plotted for all observers and all viewing conditions. Figure 30a depicts the turns of the best-fitting plane about the vertical and figure 30b the slope angle in the sagittal plane.
Figure 30.
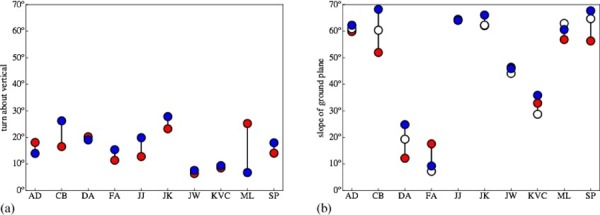
(a) The turn about the vertical (red for anticlockwise, blue for clockwise) and (b) the slope angle in the sagittal plane (red for anticlockwise, blue for clockwise, white for frontal) for the best-fitting plane for all observers. Although there are a few differences between clockwise and anticlockwise, they do not go systematically in one direction.
Note that, whereas the picture plane turns over forty-five degrees as one switches from oblique to frontal viewing, the turns of the best-fitting plane are rather less, in the ten to thirty degrees range. All observers show the same effect albeit to somewhat different degrees. The oblique direction evidently has a systematic effect of roughly one fourth to one half of the turn of the direction of view.
The slopes in the sagittal plane are very different for the ten observers, an effect that was also reported in the first experiment. The influence of the viewing direction is only slight.
One would perhaps expect the total depth range to shrink in cases of oblique viewing because the pictorial cues would be expected to deteriorate in cases of extreme foreshortening. However, such an effect, if any, is small and not always present. As a rough summary the depth range is hardly affected by changes of viewing directions in the range ±45° (see figure 31). We detect no systematic relation between the total depth range and the viewing direction.
Figure 31.
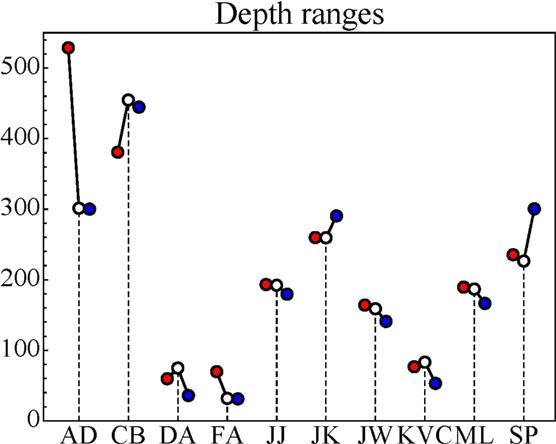
The depth ranges for the three viewing angles (red for anticlockwise, blue for clockwise, white for frontal) for all ten observers (depth range in pixels). For a comparison with the first experiment, see figure 21.
7. General discussion
Observers found the task on the whole a natural and in most cases easy one. The study of responses in repeated sessions corroborate this. In a few cases we found indications of the observer apparently becoming gradually accustomed to the task (the term ‘learning effect’ seems out of place here); in most cases observers performed similarly over sessions. The relevant parameter is the variance of repeated slant settings, since the slants must be completely attributed to the process of monocular stereopsis. The standard deviation over all observers and sessions follows a Weber law with Weber fraction in the 20–60% range, bottoming out in about five degrees.
Unexpected features of the results of the pointing task were the tilt deviations from the veridical values near the horizontal direction, and the difference in slant setting for the cases of NF and FN pointings. The tilt deviations can be as large as five to ten degrees and occur in the immediate neighborhood of the horizontal. There may well be an interaction with the slant; this was not further analyzed because of the paucity of data points. The difference in NF and FN slant settings is—in retrospect—not that surprising, since it has also been found in cases of exocentric pointing by a stationary visual observer in physical space (Koenderink and van Doorn 2008). Such differences can easily be modeled through the introduction of suitable nonlinearities in the various representations of distance and depth. However, such a phenomenological fitting procedure can hardly be taken for a causal explanation, which is why the present study leaves the issue open. From a methodological point of view the difference poses no problem in the construction of a three-dimensional configuration on the basis of pointings, but it detracts from the value of such a configuration as a concise description of the data. This is because it allows for equal slants (except for sign) only in the case of NF and FN pointings between two points on the basis of Euclidean geometry. Again, the introduction of suitable nonlinearities would ‘solve’ this problem, albeit in an ad hoc manner.
A possible explanation for the differences in NF and FN slants might be the fact that viewing is not orthographic. Apparently observers differ appreciably. One aspect that appears to be common is that for a given observer the curvature is relatively well defined—that is, independent of the angular distance subtended by the locations of pointer and target.
These idiosyncratic differences are hardly surprising in view of the (well-documented) large differences in the extent of the apparent visual field (Koenderink et al 2009) and the large differences in commonly encountered depth ranges in the normal population (Koenderink and van Doorn 2003). Unfortunately, at present no generally accepted tests exist to quantify such important properties conveniently.
A striking fact in the first and third experiments is that there is a wide range of depth articulation over a group of a little over a dozen observers, most of them naive, but all normal visual observers. Another striking fact is that these differences are largely confined to the depth ranges, to a somewhat lesser extent to differences in the apparent frontoparallel, but hardly at all in the shape domain. All observers responded with essentially the same configuration (as quantified through the shape angle in shape space, see appendix B).
These experiments result in a reasonably clear insight into the structure of pictorial space as it is constructed by way of the pointing technique, although a few topics in need of further research remain. Note that we say ‘constructed’, because pictorial space is only operationally defined. Thus it cannot be ‘probed’ or ‘measured’ as one would in the traditional geodesy of landscapes, because it does not exist prior to the probing. It is possible to inquire into the ‘existence’ of pictorial space, though, if one interprets existence in an appropriate sense. In this case pictorial space may be said to exist if it offers a simple model that accounts for the data within the empirical spread of the observations. In the case of the pointing method for N points, one has N(N−1) degrees of observational freedom (the slants) for which one attempts to account in a model with N−1 free parameters (the depths of the points minus one because the depth origin is arbitrary). Since in the present case the number of degrees of observational freedom [5(5−1) = 20] exceeds the number of free parameters (5−1 = 4) by a factor of five (generally N), we may indeed test for the existence.
We find that this variation in repeated settings indeed accounts for the inconsistencies encountered in the construction of a three-dimensional point configuration. That is to say, within the limits of these empirical data it makes pragmatic sense to hold that pictorial space exists. This opens up an extensive field of endeavor.
Of course, pictorial space, being a mental entity, is necessarily idiosyncratic. One expects individual pictorial spaces to be similar only to the degree that they depend on the pictorial cues. There are a number of distinct factors to regard here. One is that the pictorial cues are inherently ambiguous, although this has only been formalized in a few cases like the shading cue. Thus the individual pictorial spaces must be expected to differ by transformations that cannot be detected by the cues, like depth scalings and shears. This indeed accounts for the major part of the variation. Another factor is that different observers might conceivably select different cues. After all, cues are not imposed on the observer—rather, the observer has to interpret pictorial structure as ‘cue’, for better or worse (eg an observer might take a smudge for a shadow, and so forth). Yet another factor is that observers might inject idiosyncratic ‘beholder's shares’, depending upon their histories, present state of mind, and expectations.
8. Conclusions
We have developed and investigated a method that allows one to measure the three-dimensional configuration of point sets in pictorial space. A somewhat similar method was described by Wijntjes and Pont (2010) in a rather different context, namely in photographic stereo pairs, with ground truth data present. Here we apply it to items of the visual arts for which no such ground truth data exist. We have quantified the effect of oblique viewing, considered the effect of pointer design, and studied variations over a group of generic observers.
In this experiment we used a set of five fiducial points on a copy of a drawing by Francesco Guardi, one of this painter's many capriccios, or imaginary landscapes. There is hardly any limit to what could be used as a stimulus in such an experiment. The major constraint is that the points should be immediately localizable in pictorial space. This implies that the point be either on a pictorial surface, or a curvilinear or punctate entity: a point in the blue sky would probably be a bad choice. A failure to make such judicious choices will in all likelihood result in considerable differences between responses of different observers and difficulties in the interpretation of the results. The picture itself need not be ‘consistent’ in the way a photograph is, though. (But note that consistent does not imply ‘informative’. A photograph taken in a dense fog is consistent, but hardly informative.) The Guardi drawing is an example where various ‘inconsistencies’ can readily be detected if one decides to hunt for them. This renders the method useful to study the reaction of various groups of observers on a variety of styles of spatial depiction. A limitation of the method is in the number of points, since the magnitude of the task grows quadratically with this number. Five is a minimum for the kind of analysis presented here (see appendix B); about ten is close to the limit if sessions less than an hour in duration are desired. The latter is indeed desirable because one may not expect observers to remain in exactly the same state for longer periods or repeated sessions. Such a limited number of points will often enough suffice for the problem at hand, though.
We find that the various pictorial spaces for our observers have a similar ‘shape’ (the first principal component) but rather different overall spatial attitudes and extensions. Since these latter can be transformed away by transformations to which the cues are insensitive, we conclude that our observers must have used very similar bouquets of cues and that the structure inherent in these cues was far more important than their beholder's shares. This is important in daily-life settings; it apparently makes sense when human observers mutually discuss pictorial space in front of a painting, instead of limiting their discussion to the distribution of pigments over the surface. This conclusion need not necessarily generalize over the human population at large, of course. Our observers were all mature Caucasians of Western education.
Apparently all observers apply the same or similar depth cues, although their monocular stereopsis articulates depth relief to various degrees and estimates different spatial attitudes. This neatly corroborates the intuitive analyses of the German sculptor Adolf Hildebrand (1901), who, in his now classical treatise On the Problem of Form dating from the early 1890s [first (German) edition 1893], identified the depth range as very volatile and suggested that observers are sensitive to ‘relief’ (German: Reliefauffassung) which is depth articulation modulo arbitrary depth scalings. Using modern, quantitative methods this could be verified for articulated surfaces. In the present experiment this could be extended to configurations of mutually disconnected elements in the pictorial space elicited by a drawing of an imaginary landscape. Apparently Hildebrand's transformations apply to pictorial space as a volume, not just pictorial surfaces. There are theoretical reasons to expect this, which are based upon the essential ambiguity of optical structure in the case of pictorial perception, or monocular vision in motionless situations (Belhumeur et al 1999, Koenderink et al 2001).
We used a classic landscape as a stimulus because we intended this study as a ‘proof of principle’ of a novel method to measure pictorial depth. Of course, there are many familiar cases of pictures in which no coherent pictorial space appears to exist. Examples include depictions of ‘impossible figures’, illustrations of the wrong use of pictorial or perspective cues, and so forth. One may speculate about what would happen in such cases and whether the method would break down. It seems obvious that one cannot determine a consistent geometrical structure if there is not one, which is why we have avoided this in the present study. Such cases are of much conceptual interest, though, and we believe that the method proposed here will be of considerable value in their study.
A possible point of concern might be that target and pointer, when overlaid on the picture, might themselves alter the pictorial space. Indeed, as a matter of principle they will, as any overlay would, because they change the pictorial structure. This is not a simple matter to control for these effects. We did our best to minimize such possible effects by creating the overlaid items in a visually immediate different style from the picture itself and by using the smallest reasonable sizes. It is our intuitive conviction that the influence is certain to be small.
The depths determined by this method are in the range of minus to plus infinity. Thus they are different from the distance range for a monocular observer in visual space, which is from zero to infinity. This is of course to be expected since the depth domain has no natural origin—after all, the eye is not in pictorial space. In monocular visual space it is natural to compare distances reckoned from the eye by their ratios, whereas in pictorial space it is natural to compare depths by their differences, due to the lack of a common origin. Thus the formal relation between depths and distances is apparently of a logarithmic nature. Of course, a strict causal relation does not exist due to the distinct ontological nature of distance (physical) and depth (mental).
The variation in depth range for different observers confronted with the same picture is very large. It is quite unclear what the reasons for this variation may be: in this experiment no obvious correlations with age, gender, or physiological parameters were evident. It cannot be said that some observers lack monocular stereopsis, though: even the observer with the shallowest depth range still responded with a shape that was in the same range as those of observers who responded with a deep pictorial space. It may be that the depth range is influenced by the fact that physiological cues (though very weak) identify the picture plane as flat, or, perhaps more likely, by the knowledge that the picture plane was indeed flat. Such effects were demonstrated in studies of pictorial relief (Koenderink et al 1994).
The differences in the overall attitude and depth range are impressive enough though (see figures 18, 21, 22, and 23). The proscenium arc model (figure 18) depicts the ‘stage floor’ for our two extreme cases (selected over all sessions of all observers over all experiments). The range is evidently very large. Note that even in case B the shape was essentially the same as that for case A (approximately the first principal component; see figures 19 and 20). Thus, even for case B, the same cues were exploited as in all other instances. We have reason to believe (using two-point depth order judgments; see van Doorn et al forthcoming) that the depth resolution is very similar in all cases. If so, then the slope of the stage floor is a quale.
Acknowledgments
This work was supported by the Methusalem program by the Flemish Government (METH/08/02), awarded to JW. We would like to acknowledge technical support by Frank Amand, administrative support by Stephanie Poot, and useful comments on a previous version by two anonymous reviewers. JK was a visiting fellow at the Flemish Academic Centre for Science and the Arts (VLAC) at the time this research was started.
Appendix A
Construction of spatial configuration from pairwise pointings
Consider the construction of a point set from pairwise pointings in pictorial space. Suppose one has N fiducial points given in the picture plane by their Cartesian coordinates (Xi, Yi), i = 1 … N. We need to find the corresponding depths Zi in pictorial space, based on observations of directional pointings between point pairs (i,j), say. A pointing is given through two angles, a tilt tij, which is the component in the visual field, and a slant sij, which is a component in depth (figure A1). Both tilt and slant are Euclidean angles that specify the view of the pointer that will be superimposed upon the image. Thus slant and tilt have immediate meaning in terms of conventional computer graphics, and a somewhat more esoteric meaning as directions in pictorial space. After all, the picture is just a physical entity, whereas pictorial space is a figment of the mind.
Figure A1.
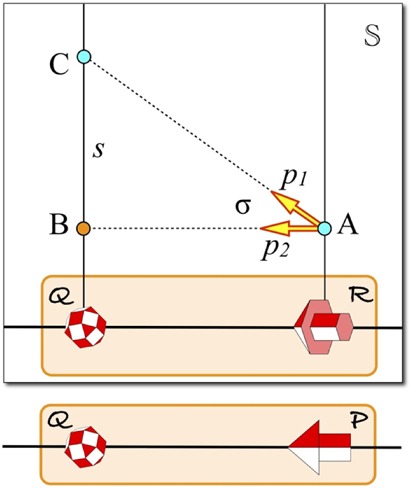
Pointers P, R, and target Q are drawn as they would be shown in the picture plane. The picture plane itself is indicated by the faint orangish rounded rectangles. Notice that we show only one line of the picture plane—that is, the line that connects pointer and target. The rectangle S, with the drop shadow, represents a plane of pictorial space through this line PQ (= RQ). This plane contains the depth dimension, the depth dimension being represented by the vertical in the figure. One may conceive of P and R as a single pointer in two different attitudes. Thus points B and C in pictorial space are at the same point Q in the picture plane (‘parallel points’). The pointer P ‘points from A to B’ along the direction p2; this is the operational definition of ‘frontoparallel’. A representation in S would be AB (note that the height is arbitrary). Thus the pointer P induces a horizontal section through the relation between the habitus of the pointer P and the direction p2. (Note that the habitus of pointer P would mean ‘orthogonal to the visual direction’ in visual space, thus the frontoparallel will be a spherical surface centered at the eye.) The habitus of the pointer R indicates a direction p1 and thus to a point C distinct from B. The angle σ subtended by p1 and p2 indicates a depth gap s, the length of BC. Thus one obtains a relation between the pictorial plane and the plane S in pictorial space through the habitus of the pointer.
The tilt may be supposed to be trivial, essentially specified by the image coordinates of the fiducial points. Thus
In that sense one does not even have to measure it. As discussed in the main text, things are not quite that simple (see figure 8), but deviations from this simple notion find their explanation in the visual field. For the sake of this appendix they are ignored. The relevant data are the observed slants sij.
There is a complication in that pointing from i to j may (and often does) yield a different result from a pointing in the opposite direction—that is, from j to i. Ideally, one should find tij = tji + 180° and sij = −sji; in practice one often finds a systematic slant offset. The implication is that observers do not point by straight lines, but by curves. Ignoring the tilt (for the tilt one finds only random differences between settings from opposite directions), there exists a unique parabolic arc with the empirical slants at the end points. This arc defines a unique depth difference dZij for the two-way pointing (see figure A2). This should be considered to be an operational definition of ‘depth difference’. We use this value in the calculation.
Figure A2.
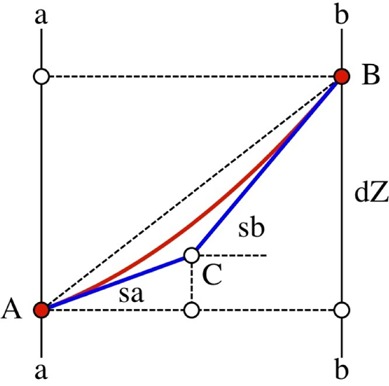
The visual rays aa and bb correspond to fiducial points in the picture. Let the observed slants be sa and sb. Then the depth difference dZ is determined by a unique parabolic arc, here drawn in red. Since AB corresponds to a distance in the picture plane, it is measured in pixels, and, consequently, so is the depth difference dZ. This illustrates the equation used in the text. The point C lies halfway between A and B in the picture plane. This easily shows dZ = ½AB [tan (sa) + tan (sb)], thus fitting the parabolic arc is equivalent to averaging the slopes (tangents of the slant angles).
Suppose pointing from (Xi, Yi) to (Xj, Yj) involves a depth difference dZij. This implies the linear equation
Thus one obtains a total of ½N(N−1) linear equations involving the mutual depth differences and the observed slants. Since these are homogeneous equations, they do not allow for a solution of the depths. The independent equation
completes them to an overdetermined system [one has ½N(N−1)+1 equations for N unknowns, where N ≥ 2]. This equation forces the mean depth to be zero, which is arbitrary, but reasonable, since absolute depth cannot be measured anyway. Since the system is overdetermined for N > 2 one seeks a solution in the least squares sense. Such a ‘best’ solution automatically filters out inconsistencies inherent in the observed slants data.
The equations are conveniently written in matrix notation as AZ = dZ, where A is a matrix containing mostly zeroes, with some −1s and +1s, dZ is the list of depth differences appended with a final 0, whereas Z contains the list of unknown depth values. The solution is immediate and involves the pseudo inverse, thus Z = (ATA)−1 AT dZ (although the expression is formally correct, one should preferably use the singular values decomposition, rather than this formula, for the sake of numerical stability).
Appendix B
The geometry of spatial attitude, depth range, and shape
A configuration of N points in pictorial space can be described in many ways. One method that is particularly useful in our experiment (and similar cases, which are frequent) distinguishes between overall spatial attitude, overall depth range, and ‘shape’. (The specific meaning of the shape is discussed below.)
It is useful to consider the overall spatial attitude in case the configuration as a whole is mainly extended in two dimensions. This typically holds for the case of landscapes and so forth. Another reason to extract the overall attitude is that many pictorial cues fail to specify absolute attitude, rendering the overall attitude particularly idiosyncratic. A well-known example is offered by the shading cue: a uniform patch in the visual field could be due to any planar surface element on the basis of shape from shading. The spatial attitude is fully indeterminate. In the computer vision community this specific ambiguity goes by the name of ‘additive plane’.
One finds the overall attitude by fitting a plane to the three-dimensional points of the configuration. Subtracting the depths of the corresponding points of this plane from the observed depth removes the overall slant from the data.
Once corrected for the overall attitude, the distribution of depths corresponds to the deviations from planarity—that is to say, pure relief. Subtracting the mean is not necessary, as zero mean was already forced on the data by construction. The standard deviation of the depths is a measure of the depth range of relief. It is well known to be highly idiosyncratic (Hildebrand 1901). This, again, is most likely related to the ambiguity of pictorial cues. The computer vision community refers to this as the ‘bas-relief ambiguity’ in the case of shape from shading (Belhumeur et al 1999). Dividing the depths by the standard deviation factors this ambiguity out of the equation. What is left after correcting for overall attitude and depth range will be referred to as the ‘canonical relief’.
The canonical relief is characterized by pure shape. For a configuration of N points the canonical relief has only N−4 degrees of freedom, as we have removed four degrees of freedom: overall depth (1 df), overall attitude (2 df, slant and tilt, say), and range (1 df). For a configuration of five points, as in the case of our experiment, only a single degree of freedom is left, thus shape may be characterized by a single parameter in this case.
The nature of the shape parameter becomes clear when one performs a principal components analysis of the relief (the depths minus the mean depth and the additive plane). The simplest way to do this is to find the singular values decomposition of a matrix composed of the depths (the depths of a session is a list of five depths, one for each point; these depths come from the rows of the matrix) collected from many sessions, perhaps of a single observer, or perhaps of a group of observers, like in our experiment. One finds that there are only two nonzero singular values. This is expected, because three of the five df were already removed. The two principal components span a (two-dimensional) plane. Each single session (the vector of five depths) is represented as a point in this plane. The distance to the origin of this plane is the depth range, thus the pure shape parameter is the direction of the point, which may be specified via a ‘shape angle’.
In the results reported here almost any session yields a shape that is very close to the direction of the first principal component.
Appendix C
The curvature of connecting arcs
Consider the geometrical configuration depicted in figure C1a. The picture surface is indicated as the linear segment LR; the eye is shown at the location E. Thus the picture is seen head-on, so to speak. The angular width of the picture in the visual field is supposed to be α, the size in physical space d. Pointing from L to R in physical space evidently implies the blue arc, which is straight. Pointing from L to R in directions that are perpendicular to the visual rays EL and ER implies the curved arc drawn in red, a circular arc concentric with the eye. That an observer might prefer this arc over the straight connection to point from L to R is suggested by the shapes of the pointers in the picture plane for these two hypothetical cases. In the latter case the pointers look orthogonal to the (single!) visual direction implied by the picture plane, which is the normal direction of the picture plane. This is illustrated in figure C2.
Figure C1.
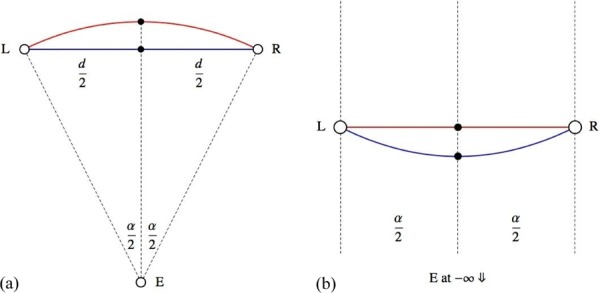
(a) Picture surface LR in physical space, with the eye at E. The diameter of the picture is d, its angular subtense in the visual field is α. (b) The configuration at left transformed into angle–log distance space. The location of the eye is at minus infinity, all visual rays are parallel. The circles concentric with the eye in physical space appear as the straight orthotomics of the visual rays. In this space the blue line is curved.
Figure C2.

(a) How the (physical) pointers at L and R would appear if they pointed along the blue line. (b) How the pointers at L and R would appear if they pointed along the red arc. The pointers at left appear as if they might ‘point out of the picture’.
For a monocular observer the optical input is invariant with respect to arbitrary dilations and rotations about the vantage point. Such transformations can be understood as ‘translations of pictorial space’. Such considerations lead to a model of visual space illustrated in figure C1b. Here the visual rays are parallel and the eye is not in the space (the image of the point E is at minus infinity). Circles centered at the eye appear as the straight lines orthotomic to the visual rays. The map from figure C1a to figure C1b is conformal (it is essentially the complex logarithmic, or log polar, map). In general, equiangular spirals in physical space map on straight lines in log polar space. The visual rays and their orthotomic circles are simply special cases of such spirals.
In the space of figure C2b the straight blue line of figure C2a becomes the curved blue arc drawn on the right. The slants at the endpoints differ by an angle α. The curvature κ of a parabolic arc defined through the slants sleft and sright at the end points would be
where α denotes the angular distance between the end points L and R. For α ≫ 1, an approximation that commonly holds in cases of pictorial perception, the curvature is simply 1, independent of α.
Of course, this analysis can be only suggestive. The pictorial space as operationally defined by the pointing method is by no means constrained to have the log polar structure, whether it has (or rather, to what extent it has) such a structure is an empirical issue. The analysis suggests one possible interpretation of the empirically found differences between pointings from L to R and from R to L.
Footnotes
One might wonder how an eight-parameter group might imply a simpler space than a seven-parameter group? This is because fewer parameters imply stronger constraints. There are many conventional examples—for instance, projective geometry is simpler (in the sense of ‘more primitive’) than affine geometry although (or, rather, because) its group of transformations is larger, affine geometry is simpler than Euclidean geometry although its group is larger than the Euclidean group, and so forth (see also Van Gool et al 1994). The geometry of the model of visual space is simpler than Euclidean space because it has a perfect (even metrical) duality between points and planes, whereas Euclidean geometry has not. As a consequence, many theorems are simple in visual space, but imply awkward ‘exceptions’ in the case of Euclidean space. The additional parameter involves a scaling of angles, which is ruled out in the Euclidean case because the Euclidean angle measure is elliptic whereas the Euclidean distance measure is parabolic. In contradistinction, both are parabolic for visual space. Such considerations were the reason why Strubecker (1941) recommended the teaching of the geometry of visual space (he used a different term, of course) in schools as ‘simpler’ than the conventional Euclidean course. The charming book by Jaglom (1979) makes the same point.
Contributor Information
Johan Wagemans, University of Leuven, Laboratory of Experimental Psychology, Tiensestraat 102-box 3711, 3000 Leuven, The Netherlands; e-mail: johan.wagemans@psy.kuleuven.be.
Andrea J van Doorn, Delft University of Technology, Industrial Design, Landbergstraat 15, 2628 CE Delft, The Netherlands; e-mail: a.j.vandoorn@tudelft.nl.
Jan J Koenderink, University of Leuven, Laboratory of Experimental Psychology, Tiensestraat 102-box 3711, 3000 Leuven, The Netherlands, Delft University of Technology, EEMCS, and The Flemish Academic Centre for Science and the Arts; e-mail: j.j.koenderink@tudelft.nl.
References
- Andrews D P. Perception of contour orientation in the central fovea part I: Short lines. Vision Research. 1967;7:975–997. doi: 10.1016/0042-6989(67)90014-4. [DOI] [PubMed] [Google Scholar]
- Appelle S. Perception and discrimination as a function of stimulus orientation: The ‘oblique effect’ in man and animals. Psychological Bulletin. 1972;78:266–278. doi: 10.1037/h0033117. [DOI] [PubMed] [Google Scholar]
- Belhumeur P N, Kriegman D J, Yuille A L. The bas-relief ambiguity. International Journal of Computer Vision. 1999;35:33–44. doi: 10.1023/A:1008154927611. [DOI] [Google Scholar]
- Berkeley G. An Essay towards a New Theory of Vision. Dublin: Aaron Rhames; 1709. [Google Scholar]
- Bian Z, Andersen G J. The advantage of a ground surface in the representation of visual scenes. Journal of Vision. 2010;10:1–19. doi: 10.1167/10.8.16. [DOI] [PMC free article] [PubMed] [Google Scholar]
- Bouma H, Andriessen J J. Perceived orientation of isolated line segments. Vision Research. 1968;8:493–507. doi: 10.1016/0042-6989(68)90091-6. [DOI] [PubMed] [Google Scholar]
- Bouma H, Andriessen J J. Induced changes in the perceived orientation of line segments. Vision Research. 1970;10:333–349. doi: 10.1016/0042-6989(70)90104-5. [DOI] [PubMed] [Google Scholar]
- Brown J W. Self-Embodying Mind: Process, Brain Dynamics and the Conscious Present. Barrytown, NY: Barrytown/Station Hill Press; 2002. [Google Scholar]
- Cutting J E. The shape and psychophysics of cinematic space. Behavior Research Methods, Instruments, & Computers. 1986;18:551–558. doi: 10.3758/BF03201428. [DOI] [Google Scholar]
- Cutting J E. Rigidity in cinema seen from the front row, side aisle. Journal of Experimental Psychology: Human Perception and Performance. 1987;13:323–334. doi: 10.1037/0096-1523.13.3.323. [DOI] [PubMed] [Google Scholar]
- de la Gournerie . Traité de perspective linéaire contenant les tracés pour les tableaux plans et courbes, les bas—reliefs et les décorations théatrales, avec une théorie des effets de perspective. Paris: Dalmont et Dunod/Mallet-Bachelier; 1859. [Google Scholar]
- Deregowski J B, Parker D M. Viewing angle and the perceived orientation of pictorial elements: geometric or representational effects. Perception. 1995;24:1139–1153. doi: 10.1068/p241139. [DOI] [PubMed] [Google Scholar]
- Deregowski J B, Parker D M, Massironi M. The perception of spatial structure with oblique viewing: An explanation for byzantine perspective? Perception. 1994;23:5–13. doi: 10.1068/p230005. [DOI] [PubMed] [Google Scholar]
- Goldstein E B. Rotation of objects in pictures viewed at an angle. Journal of Experimental Psychology: Human Perception and Performance. 1979;5:78–87. doi: 10.1037/0096-1523.5.1.78. [DOI] [PubMed] [Google Scholar]
- Goldstein E B. Spatial layout, orientation relative to the observer, and perceived projection in pictures viewed at an angle. Journal of Experimental Psychology: Human Perception and Performance. 1987;13:256–266. doi: 10.1037/0096-1523.13.2.256. [DOI] [PubMed] [Google Scholar]
- Goldstein E B. Geometry or not geometry? Perceived orientation and spatial layout in pictures viewed at an angle. Journal of Experimental Psychology: Human Perception and Performance. 1988;14:312–314. doi: 10.1037/0096-1523.14.2.312. [DOI] [PubMed] [Google Scholar]
- Gombrich E H. Art and Illusion: A Study of the Psychology of Pictorial Representation. London: Phaidon Press; 1960. [Google Scholar]
- Hagen M A. Influence of picture surface and station point on the ability to compensate for oblique view in pictorial perception. Developmental Psychology. 1976;12:57–63. doi: 10.1037/0012-1649.12.1.57. [DOI] [Google Scholar]
- Halloran T O. The frame turns also: factors in differential rotation in pictures. Perception & Psychophysics. 1993;54:496–508. doi: 10.3758/BF03211772. [DOI] [PubMed] [Google Scholar]
- Hansen B C, Essock E A. A horizontal bias in human visual processing of orientation and its correspondence to the structural components of natural scenes. Journal of Vision. 2004;4:1044–1060. doi: 10.1167/4.12.5. [DOI] [PubMed] [Google Scholar]
- Hildebrand A. Das Problem der Form in der bildenden Kunst. Strassburg: Heitz & Mündel; 1901. [Google Scholar]
- Jaglom I M. A Simple non-Euclidian Geometry and its Physical Basis: An Elementary Account of Galilean Geometry and the Galilean Principle of Relativity. New York: Springer; 1979. [Google Scholar]
- Klein F. Vergleichende Betrachtungen über neue geometrische Forschungen (The ‘Erlangen Program’) Programm zu Eintritt in die philosophische Fakultät und den Senat der Universität zu Erlangen. Deichert: Erlangen; 1872. [Google Scholar]
- Koenderink J J, van Doorn A J. Relief: pictorial and otherwise. Image and Vision Computing. 1995;13:321–334. doi: 10.1016/0262-8856(95)99719-H. [DOI] [Google Scholar]
- Koenderink J J, van Doorn A J. Looking into Pictures: An Interdisciplinary Approach to Pictorial Space. Cambridge, MA: MIT Press; 2003. Pictorial space; pp. 239–299. [Google Scholar]
- Koenderink J J, van Doorn A J. The structure of visual spaces. Journal of Mathematical Imaging and Vision. 2008;31:171–187. doi: 10.1007/s10851-008-0076-3. [DOI] [Google Scholar]
- Koenderink J J, van Doorn A J, Kappers A M L. Surface perception in pictures. Perception & Psychophysics. 1992;52:487–496. doi: 10.3758/BF03206710. [DOI] [PubMed] [Google Scholar]
- Koenderink J J, van Doorn A J, Kappers A M L. On so-called paradoxical monocular stereoscopy. Perception. 1994;23:583–594. doi: 10.1068/p230583. [DOI] [PubMed] [Google Scholar]
- Koenderink J J, van Doorn A J, Kappers A M L. Depth relief. Perception. 1995;24:115–126. doi: 10.1068/p240115. [DOI] [PubMed] [Google Scholar]
- Koenderink J J, van Doorn A J, Christou C, Lappin J S. Shape constancy in pictorial relief. Perception. 1996;25:155–164. doi: 10.1068/p250155. [DOI] [PubMed] [Google Scholar]
- Koenderink J J, van Doorn A J, Lappin J S. Direct measurement of curvature of visual space. Perception. 2000;29:69–79. doi: 10.1068/p2921. [DOI] [PubMed] [Google Scholar]
- Koenderink J J, van Doorn A J, Kappers A M L, Todd J T. Ambiguity and the ‘mental eye’ in pictorial relief. Perception. 2001;30:431–448. doi: 10.1068/p3030. [DOI] [PubMed] [Google Scholar]
- Koenderink J J, van Doorn A J, Kappers A M L. Pointing out of the picture. Perception. 2004;33:513–530. doi: 10.1068/p3454. [DOI] [PubMed] [Google Scholar]
- Koenderink J, van Doorn A, Todd J. Wide distribution of external local sign in the normal population. Psychological Research. 2009;73:14–22. doi: 10.1007/s00426-008-0145-7. [DOI] [PubMed] [Google Scholar]
- Perkins D N. Compensating for distortion in viewing pictures obliquely. Perception & Psychophysics. 1973;14:13–18. doi: 10.3758/BF03198608. [DOI] [Google Scholar]
- Pirenne M H. Optics, Painting and Photography. Cambridge, MA: Cambridge University Press; 1970. [Google Scholar]
- Sachs H. Isotrope Geometrie des Raumes. Braunschweig/Wiesbaden: Vieweg; 1990. [Google Scholar]
- Sedgwick H A. Pictorial Communication in Virtual and Real Environments. London: Taylor & Francis; 1991. The effects of viewpoint on the virtual space of pictures; pp. 460–479. [Google Scholar]
- Strubecker K. Differentialgeometrie des isotropen Raumes I. Sitzungsberichte der Akademie der Wissenschaften Wien. 1941;150:1–43. [Google Scholar]
- Timney B N, Muir D W. Orientation anisotropy: incidence and magnitude in Caucasian and Chinese subjects. Science. 1976;193:699–701. doi: 10.1126/science.948748. [DOI] [PubMed] [Google Scholar]
- van Doorn A J, Koenderink J J, Wagemans J. Depth order in pictures. forthcoming.
- Van Gool L, Moons T, Pauwels E, Wagemans J. Invariance from the Euclidean geometer's perspective. Perception. 1994;23:547–561. doi: 10.1068/p230547. [DOI] [PubMed] [Google Scholar]
- Wijntjes M W A, Pont S C. Pointing in pictorial space: quantifying the perceived relative depth structure in mono and stereo images of natural scenes. ACM Transactions on Applied Perception. 2010;7 unpaginated. [Google Scholar]


