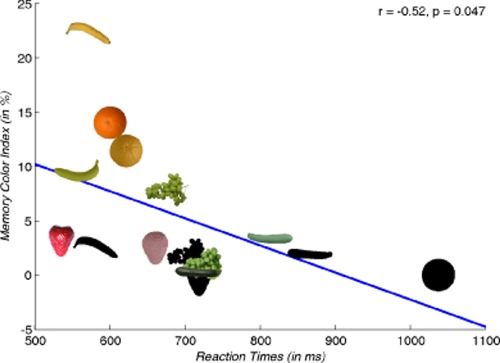
Figure 1.

Correlation between reaction times and memory colour effects for the stimuli used in the second part of the first experiment in Olkkonen et al (2008). The x-axis shows the reaction times measured as indices for colour diagnosticity and recognisability. The y-axis shows the memory colour effect as measured through the memory colour index.
