Figure 3.

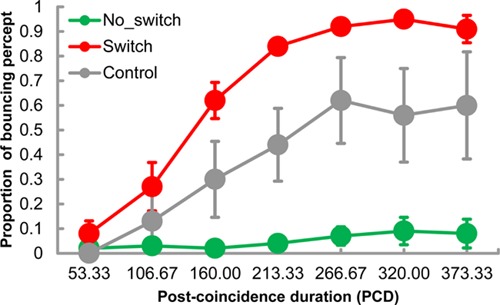
Mean critical postcoincidence duration from curves fitted to the individual data of the switch condition for participants in each experiment. Error bars denote standard errors of mean (n = 5).

Mean critical postcoincidence duration from curves fitted to the individual data of the switch condition for participants in each experiment. Error bars denote standard errors of mean (n = 5).