Abstract
Visual illusions constitute an interesting perceptual phenomenon, but they also have an aesthetic and affective dimension. We hypothesized that the illusive nature itself causes the increased aesthetic and affective valence of illusions compared with their non-illusory counterparts. We created pairs of stimuli. One qualified as a standard visual illusion whereas the other one did not, although they were matched in as many perceptual dimensions as possible. The phenomenal quality of being an illusion had significant effects on “Aesthetic Experience” (fascinating, irresistible, exceptional, etc), “Evaluation” (pleasant, cheerful, clear, bright, etc), “Arousal” (interesting, imaginative, complex, diverse, etc), and “Regularity” (balanced, coherent, clear, realistic, etc). A subsequent multiple regression analysis suggested that Arousal was a better predictor of Aesthetic Experience than Evaluation. The findings of this study demonstrate that illusion is a phenomenal quality of the percept which has measurable aesthetic and affective valence.
Keywords: visual illusions, collative aspects of illusion, aesthetic experience, subjective judgment of a form, a-ha experience
1. Introduction
The intriguing properties of visual illusions have attracted attention from ancient thinkers, philosophers, art impressionists, op artists, and contemporary artistic illusionists (Wade 2005). Psychologists have been searching for cognitive principles or rules of illusory effects because illusions have been considered relevant for testing perceptual theories. Furthermore, people often become fascinated or moved by various visual illusory effects, and it seems that such a visual experience is both perceptually and emotionally rewarding. This observation might be supported by the popularity of trompe l'oeil or illusion art.
For centuries the study of visual or aesthetic preference has focused on stimulus properties such as symmetry, proportion, or complexity, which were regarded as determinants of preference that tended to yield agreement across individuals. However, recent approaches to visual aesthetics have argued against those classic ideas and have suggested a “knowledge-based” view of aesthetic preference, stressing the importance of subjective evaluative processes and semantic associations with visual stimuli. Furthermore, these studies have argued that cognitive and evaluative processes are intertwined in Aesthetic Experience (Martindale 1988; Nadal et al 2008; Silvia 2005a; Reber et al 2004; Vessel and Rubin 2010; see also Wagemans [2011] for further discussion).
In recent studies cognitive factors, such as meaning, novelty, or semantic interpretability, have been regarded as more essential than perceptual factors in determining visual preference. This new approach to aesthetics advocates that proximal determinants of preferences are internal factors that reflect subjective and therefore inherently individual evaluations (Vessel and Rubin 2010). These evaluative meanings attributed or projected to the external world are referred to as “subjective,” “connotative,” or “implicit.” It is commonly opposed to denotative meaning, referred to as “objective,” “referential,” or “explicit” (objective properties such as angular, light, and wooden) (Janković in press). Given this, we would argue that aesthetic processes do not necessarily involve evaluative processes of artistic works alone, but can also be related to any object in the environment with which we are interacting. Berlyne (1971, 1974b; also see Moles 1968) defined aesthetic stimuli as those possessing greater qualitative diversity than everyday stimuli, incorporating syntactic (ie, stylistic) as well as semantic (ie, subject matter) information. Others (Zeki 2002) argued that ambiguity is a highly prized characteristic of great art because it offers an observer the option of choosing from many alternatives. Exactly like artworks, visual illusions can also be discussed in terms of ambiguity and qualitative diversity. This leads us to propose that visual illusions possess aesthetic attributes common to any other aesthetic object.
In the 1970s, Berlyne suggested that stimulus attributes such as novelty, complexity, surprisingness, and incongruity (conflict) play a major role in aesthetic responses (Berlyne 1971; Cupchik and Berlyne 1979). In addition, observers need to understand or resolve ambiguity. Silvia (2005a) claimed that once observers understand the meaning of an observed object, their emotional interest becomes high, which elicits a strong Aesthetic Experience. Russell and Milne (1997; Russell 2003) have empirically proven that people enjoy modern art more if they grasp its meaning. Paintings accompanied by brief descriptions were judged as easier to understand and also more enjoyable and interesting. In addition, Biederman and Vessel (2006) argued that the key concept for understanding human preference is the subject's ability to understand the stimuli. Their findings indicate that repeated exposure to stimuli leads to increased pleasure (see Carbon 2011 for more discussion). This is related to the “click” of comprehension (Biederman and Vessel 2006), often accompanied by an “A-ha” experience (see Van de Cruys and Wagemans 2011 for more discussion). In this study, we first examined the Aesthetic Experience and evaluative meaning of visual illusions (referred to as “implicit features” of visual illusions) by using dynamic stimuli that enable observers to discern the included illusions.
1.1. Importance of “surprisingness” and “incongruity” in the aesthetic study of visual illusions
There was, in fact, a precursor in the area of the experimental aesthetics of visual illusions. Noguchi's (2003) study addressed aesthetic preference regarding several geometrical illusions, including the Oppel–Kundt grid and concentric circles, Helmholtz radials, the Delboeuf illusion, the Morinaga–Noguchi illusion, the Ehrenstein figure, or the Kanizsa–Noguchi square. His study revealed a strong correlation between affective and perceptual judgments. Strong affective preference occurred with strong effects of illusion; thus, Noguchi suggested that aesthetic as well as perceptual processes should be investigated. Furthermore, most of the stimuli Noguchi and his colleagues used (Noguchi 2003; Yoshino et al 2009) were so simple that they were unlikely affected by additional meanings or learned contexts.
In contrast, in the present study, we first selected much richer types of geometrical illusions as well as other related illusory phenomena, such as ambiguous figures (eg, Rubin's vase profile or duck-rabbit) and impossible figures (eg Penrose's triangle or M C Escher's drawings of impossible buildings), as we assumed that certain properties of miscellaneous illusory effects could be closely related to Berlyne's (1965) concept of surprisingness and incongruity (conflict). As mentioned before, these stimulus attributes considered by Berlyne are important aesthetic properties of objects that play a major role in aesthetic responses. He defined surprisingness as a certain degree of uncertainty that exists when any number of alternative events occurs. Informational theory expresses uncertainty as a sum across alternatives, and its maximum is reached when a large number of alternatives are equally likely. For example, in understanding ambiguous figures, creative processes of a lower order are initiated. Observers need to consider only a limited number of alternative meanings that could be attributed. Most observers primarily see only one, although additional explanation and guidance would reveal other possible meanings. Other good examples would be the tasks of discovering a hidden meaning or a hidden figure within complex surroundings, eg, Dalmatians among rocks and similar ambiguous images.
The second aesthetic property suggested by Berlyne (1965) is “incongruity (conflict),” which refers to received information differing from existing information, such as expectancy violation, or perceiving incongruent parts within a complete object (see Silvia 2006 for more discussion). For example, impossible figures are paradoxical, and the paradox is between what we see and what we know to be possible (Kanizsa 1979). It is also about the contradiction created between different parts of the same image, which creates a perceptual paradox resulting in a psychological sense of astonishment (Pinna 2007) and fascination. The perceptual paradox arises from the conflict between the local and global distribution of elements, for example, where parts of a figure or scene are possible, but their combination is impossible.
In other examples of illusions, such as the Optimized Fraser Wilcox illusion or the Rotating Snakes illusion (Kitaoka 2003, 2007; Kitaoka and Ashida 2003), we experience a conflict between what we see and what is objectively there, described as an expectancy violation. For example, although the Rotating Snakes illusion is a static image, most observers perceive illusory movement. When viewing illusion printed on paper, one remarks the conflict is even higher than on a PC display. That is, on first seeing an illusory figure, most novice viewers do not expect to watch a scene that is not veridical, ie, which does not correspond to what is objectively there. Certain illusory figures are perceived as illusory only when their actual physical properties are revealed. In a striking variant of the Craik-O'Brien-Cornsweet effect (Cornsweet 1970; Purves et al 1999), most observers perceive and believe that the upper gray surface is darker than the lower one, although the brightness of both surfaces is exactly the same. This impression is created by the gradient region around the border between the two gray surfaces. If we can cover this region, it would be easy to see that actually both surfaces are the same in luminance. A surprising moment of the discovery of what is illusory in an observed scene (ie, when the “A-ha” experience is derived) sparks fascination, and thus the excitement of the moment of discovery may be followed by an Aesthetic Experience. This reasoning is highly compatible with a view on the pleasure of art as derived from a predictive coding account (see Van de Cruys and Wagemans 2011). Thus, we hypothesized that our stimuli that showed how the illusion can be disambiguated or those showing gradual transformation starting from weak-or-no illusory figures to fully illusory figures should be regarded as more interesting and more fascinating than the visual patterns with no illusory effect or with “unnoticed” illusion.
1.2. Study of subjective judgment of a form (SJF 12) and Aesthetic Experience (AE3)
In the early 1970s, Daniel Berlyne initiated numerous studies in which semantic differential scales were used to investigate the judgments of paintings (Berlyne 1971; Berlyne and Ogilvie 1974; Cupchik 1974), photographs (Libby et al 1973), and miscellaneous visual patterns (Berlyne 1974a; Berlyne et al 1974; Ertel 1973; Evans and Day 1971). Factor analyses of elementary judgments in these studies showed great similarity among the extracted factors. The most commonly extracted factors can be classified in three groups: (1) Evaluation or Hedonic tone (good–bad, pleasant–unpleasant, etc), (2) Potency or Arousal (strong–weak, interesting–uninteresting, etc), and (3) Activity or Uncertainty (active–passive, complex–simple, etc). Similar factors extracted from studies by Tucker (1955) and Osgood et al (1957, 1975) suggest that the elementary implicit features converge into three more general categories, irrespective of the object of judgment (paintings or non-artistic visual patterns).
Marković and Janković (2001) focused on the latent structure of the subjective or evaluative meaning. They analyzed whether the numerous evaluative attributes that we find in natural language could converge to a smaller number of latent dimensions that might indicate the underlying mental structures responsible for a great variety of the evaluative attributes by which we assess our surroundings (see also Augustin et al 2011, for a similar approach). This approach was based on the lexical hypothesis that relative frequency of the attributes in the language corpus indicates their relative importance in the relevance of their usage for evaluating objects around us. In a similar manner, subsequent studies analyzed the latent structure of visual stimuli's subjective, evaluative meaning—ie, the subjective judgments of artistic and non-artistic pictorial content. Through the use of a production task, a set of descriptors of the subjective experience of visual patterns was obtained. Participants were asked to list the attributes that expressed their impression of (imagined) visual patterns. In summary, a set of 65 descriptors was selected. All were given in the form of adjectives, and this form was used to construct a set of bipolar 7-point scales. In the main experiment, participants rated 16 abstract visual stimuli on the 65 descriptors. The stimuli were constructed and selected to cover a wide spectrum of visual Gestalten (from simple geometric figures to abstract artistic drawings). In the factor analysis (the principal component method plus Promax rotation), the following three factors were obtained: Evaluation (pleasant, cheerful, serene, clear, etc), Arousal (interesting, imaginative, diverse, complex, tc), and Regularity (harmonious, coherent, definite, realistic, etc; see Table 1). These factors formed the instrument that measured subjective judgment of a form on 12 scales, hereinafter referred to as SJF12.
Table 1. Results from the Principal Component Analysis + Promax rotation. The first three factors with percentage of explained variance. The coefficients of saturation were obtained from the pattern matrix.
| Regularity | 20.32 % | Arousal | 18.22 % | Evaluation | 7.94 % |
| Coherent | 0.882 | Imaginative | 0.915 | Cheerful | 0.941 |
| Realistic | 0.862 | Diverse | 0.825 | Serene | 0.882 |
| Harmonious | 0.824 | Interesting | 0.782 | Transparent | 0.734 |
| Definite | 0.803 | Complex | 0.782 | Pleasant | 0.659 |
| Regular | 0.787 | Expressive | 0.757 | Warm | 0.644 |
| Sensible | 0.78 | Extraordinary | 0.745 | Clear | 0.643 |
| Organized | 0.735 | Complicated | 0.685 | Bright | 0.621 |
| Integral | 0.716 | Instigative | 0.656 | Good | 0.591 |
| Arranged | 0.611 | Rich | 0.654 | Relaxing | 0.59 |
| Complete | 0.499 | Exhaustive | 0.64 | Tender | 0.519 |
| Balanced | 0.452 | Impressive | 0.632 | Beautiful | 0.487 |
| Full | 0.503 |
A similar procedure was used to specify the structure of the aesthetic and emotional domains of viewers’ experience of paintings. Twenty four paintings used in Marković and Radonjić (2008) were selected as stimuli for their study. First, 100 paintings were randomly selected from a larger set of 200 figural and 200 semi-figural paintings (50 from each category). Next, participants in a preliminary study were asked to select 24 paintings to cover the widest possible spectrum of different styles and motifs (themes). In the main experiment, participants rated the 24 paintings on 31 descriptors (7-point bipolar scales). The factor analysis revealed two general factors: the bipolar factor, Affective Tone (descriptors on the positive pole: lovely, charming, cheerful, etc; descriptors on the negative pole: scary, disgusting, hateful, etc) and Aesthetic Experience (descriptors: exceptional, fascinating, irresistible, etc.). The three most loaded scales with the obtained factor constituted the instrument for measuring Aesthetic Experience, hereinafter referred to as AE3. The scales ranged from 1 to 7, where number 1 was equivalent to the assessment of a stimulus as “slightly fascinating” and 7 was equivalent to the assessment of the stimulus as “extremely fascinating.”
In our study, we chose to test illusion patterns using both instruments SJF12 and AE3 assuming that Aesthetic Experience and implicit features of illusions are conceptually different aspects that may govern visual preference of illusory patterns. Given the results of the study of the implicit and explicit features of paintings (Marković and Radonjić 2008), we expected the Aesthetic Experience of visual illusions to correlate positively with Arousal and Evaluation. Observation time was also measured. Previous studies demonstrated significant correlation between the observation time and collative variables (complexity, novelty, etc; Berlyne and Lewis 1963; Berlyne and Lawrence 1964; Berlyne 1971, 1974b, 1958), as with Silvia's construct of coping potential check (ability to understand the object or a scene; Silvia 2005b). If our hypothesis is correct, significant correlations between observation time and Evaluation, Arousal, Regularity, and Aesthetic Experience should be obtained, in addition to longer observation times for illusory stimuli compared with stimuli with reduced-or-no illusory effect.
2. Experiment 1
2.1. Methods
2.1.1. Participants
Thirty-one high school students (18 female and 13 male; mean age 17.0 years old), who visited the Petnica Science Center, participated in this experiment. We avoided university students from the psychology department because they might have substantial knowledge about the visual illusions used in this study.
2.1.2. Stimuli
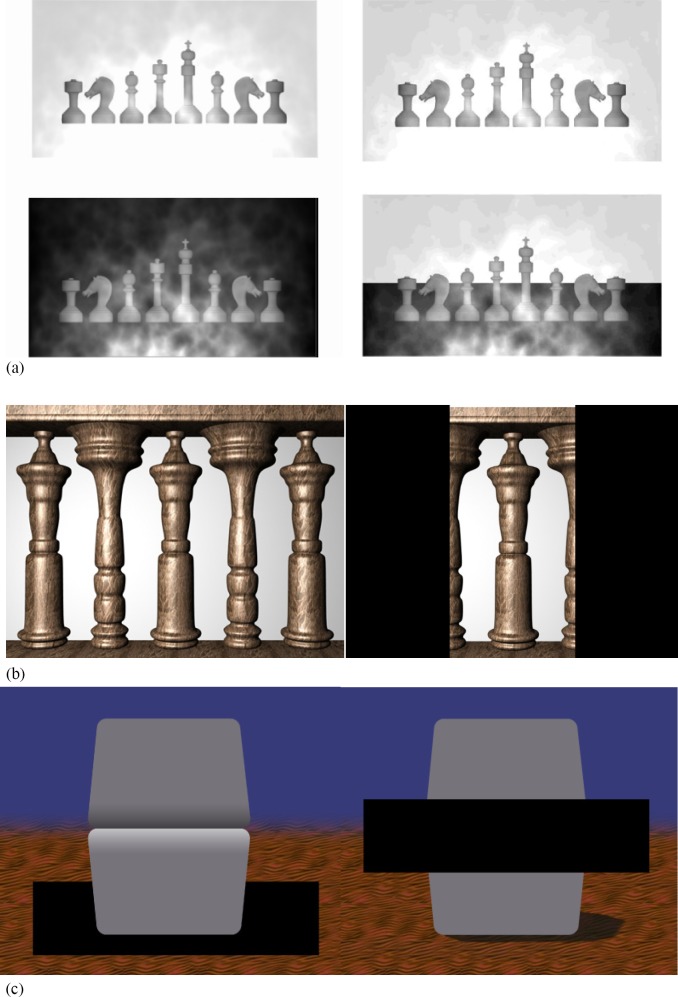
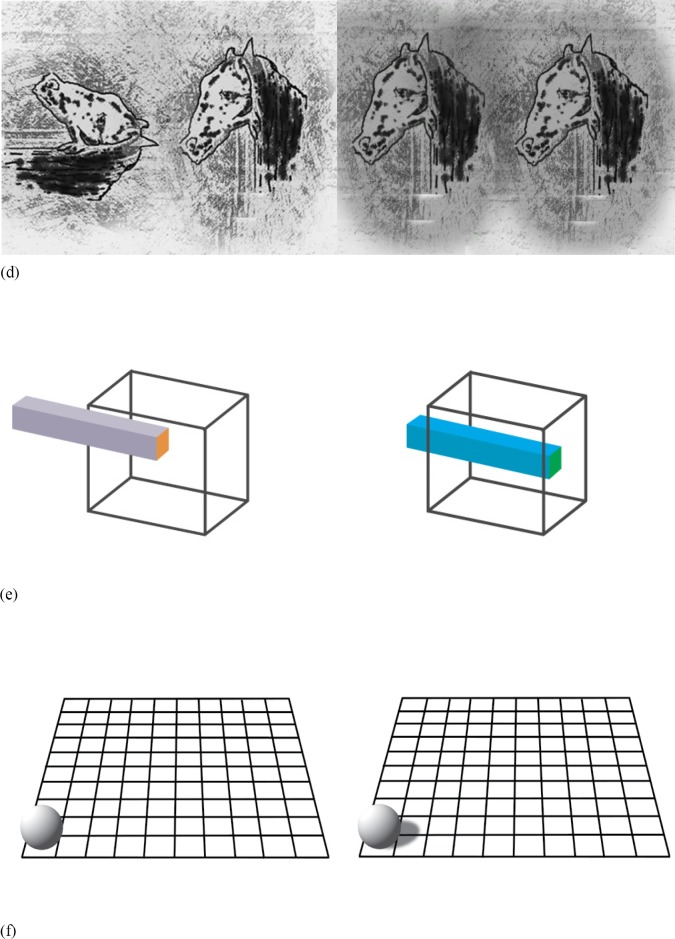
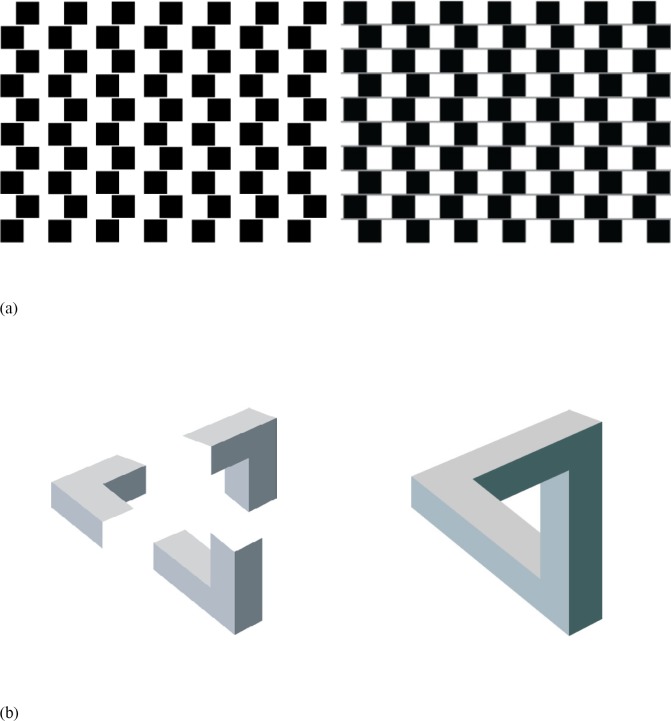
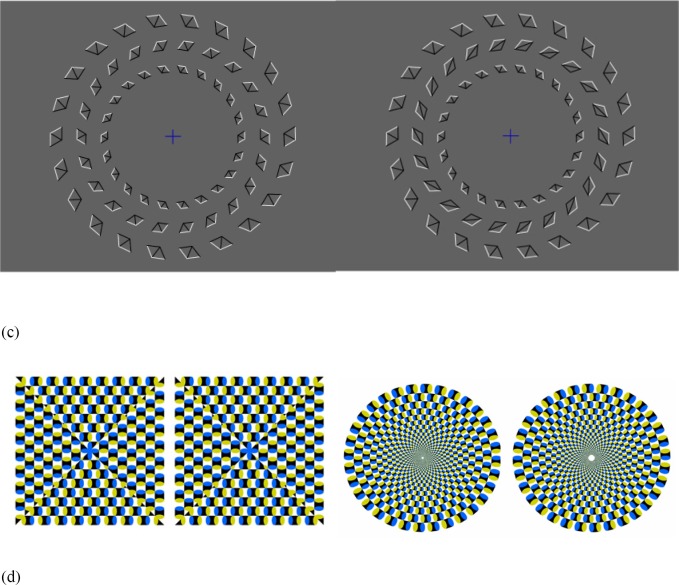
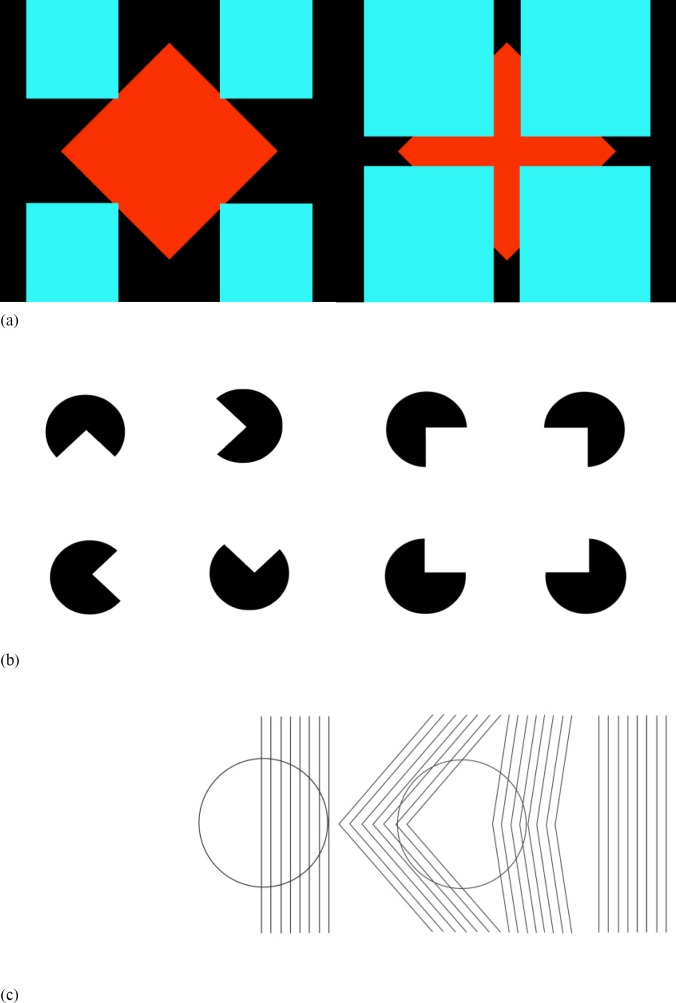
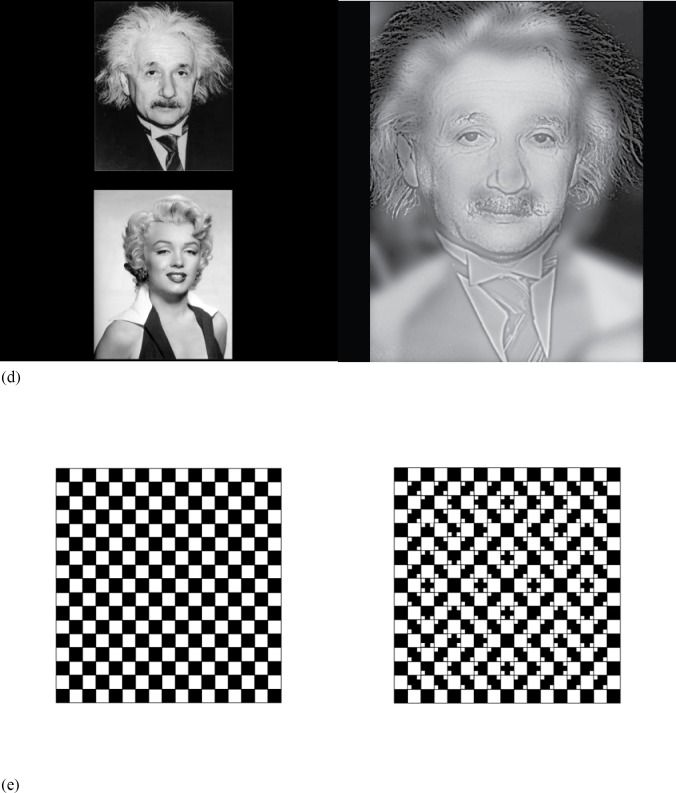
We produced dynamic stimuli, which showed gradual transformation starting from weak-or-no illusory figures to fully illusory figures. Our general idea was to show the process of how the illusion emerges or how the illusion can be revealed. Figures with reduced-or-no illusory effect looked much similar to illusory figures in the number of elements and visual appearance; however, those patterns either generated weak illusory effect or could give an illusion once observers became aware of it. There were 15 pairs of images. For each pair, one was an illusory image and the other was an image with reduced-or-no illusory effect. The illusory images included the Anderson illusion (Anderson 2005; Figure 1a), the Angel columns figure–ground reversible figure (see http://www.psy.ritsumei.ac.jp/∼akitaoka/illnews14e.html; Figure 1b), the enhanced Cornsweet effect (Cornsweet 1970; Purves et al 1999; Figure 1c), the frog–horse figure (19th-century art work, USA; Figure 1d), the Necker cube (Necker 1832; Figure 1e), the shadow ball illusion (Kersten et al 1991; Figure 1f), the modification of the Münsterberg checkerboard figure, the Café Wall illusion (Fraser 1908; Gregory and Heard 1979; Figure 2a), the Penrose triangle (Penrose and Penrose 1958; Figure 2b), the Pinna illusion (Pinna and Brelstaff 2000; Figure 2c), the Rotating Snakes illusion (Kitaoka 2005; Figure 2d), the Breathing Square illusion (Shiffrar and Pavel 1991; Figure 3a), the Kanizsa Square illusion (Kanizsa 1955, 1976; Figure 3b), the Luckiesh pattern (Luckiesh 1922; Figure 3c), the Marilyn–Einstein hybrid image (Oliva 2007; Oliva et al 2006; Figure 3d), and the Sound Wave illusion (Kitaoka 1996; Figure 3e).
Figure 1.
The first column shows original illusory patterns that were presented first. Modified counterparts are shown in the second column and they were presented subsequently: (a) Anderson illusion (Anderson 2005), (b) Angel columns figure, (c) Enhanced Cornsweet effect (Purves et al 1999), (d) Frog–horse figure, 19th-century art work, USA, (e) Necker cube (Necker 1832), (f) Shadow ball illusion (Kersten et al 1991). Click on image to see animation preview.
Figure 2.
The first column shows weak illusory patterns that were presented first. Strong illusory patterns are shown in the second column and they were presented subsequently: (a) Modification of the Münsterberg checkerboard figure, the Café wall illusion (Gregory and Heard 1979), (b) Penrose triangle, (c) Pinna illusion (Pinna and Brelstaff 2000), (d) Rotating snakes illusion (Kitaoka 2005). Click on image to see animation preview.
Figure 3.
The first column shows non-illusory patterns that were presented first. Original illusory patterns are shown in the second column, and they were presented subsequently: (a) Breathing Square illusion (Shiffrar and Pavel 1991), (b) Kanizsa Square illusion (Kanizsa 1955), (c) Luckiesh pattern (Luckiesh 1922), (d) Marilyn–Einstein hybrid image (Oliva 2007), (e) Sound Wave illusion (Kitaoka 1996). Click on image to see animation preview.
First, we describe the group of stimuli that was perceived as illusory once their actual physical properties were revealed to observers and how original illusory patterns were modified for that purpose. This group includes the six stimuli and the actual animations as shown in Figure 1.
For example, when seeing the Anderson illusion for the first time (Figure 1a), most novice viewers would not perceive it as an illusory figure, as they would not believe that the chess pieces of the two images are of the same luminance. The upper chess figures are usually seen as dark objects behind a light cloud, and the lower chess figures as light objects behind a dark cloud. This image could be noticed or perceived as illusory once observers saw both chess sets being physically identical in luminance. For that reason, the black background in the lower image was slowly unveiled, revealing the bright background of the upper image, and then turned back to the original black background (click on figure to view animation). In this way, observers were supposed to become aware that the chess figures in the upper image were of the same luminance as those in the lower image. One movie sequence was 8 s long and was played in a loop until the observers pressed the button to move to the next trial.
The Angel columns image (Figure 1b) shows silhouettes of persons standing between columns, but it is primarily seen as columns in front of the light background because the columns appear to be realistic objects. In order to demonstrate how the figure and the background can reverse, black masks emerged from the right and left borders of the image until the image was covered such that only two white background tiles remained. We assumed that by blacking out the columns in this manner, the observers would experience a perceptual flip from the foreground figure to that of the background region, thereby redirecting their focus from the columns to the human figures. One movie sequence was 6 s long and was played in a loop until the participants pressed the button to move to the next trial.
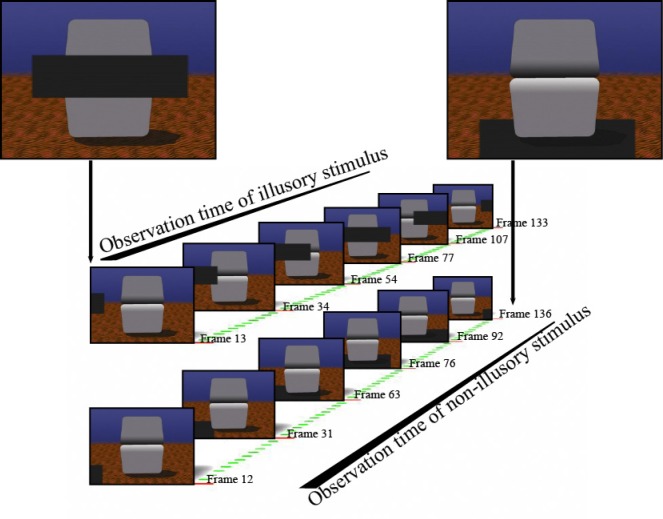
When seeing the enhanced Cornsweet effect (Figure 1c), most novice viewers believe that the upper surface is darker than the lower one, although the brightness of both surfaces is exactly the same. However, if the region containing the sharp border between the two gray surfaces and the gradient around the border is hidden under the black mask, it becomes evident that the brightness of both surfaces is the same. At first, we showed a dark rectangle passing behind the gray surfaces, in which case the rectangle did not cover the key region and hence observers should perceive the brightness of the surfaces as being different. In the next scene, the dark rectangle passed in front of the gray surfaces blacking out the key region when the observers were supposed to see that the brightness of both surfaces was the same. In both stimuli, one cycle was 6 s long and played in a loop until the participants pressed the button to move to the next trial.
The frog–horse figure (Figure 1d) is an example of an ambiguous figure in which observers tend to see a frog in the left of the image and a horse on the right. In order to make observers discern this ambiguity, we made a dynamic stimulus in which the left “frog” was continuously rotated counterclockwise through 90° to make it identical to the right “horse”. In this way, observes could experience a flip between two very different alternative percepts. Each rotation sequence was 7 s long and was repeated until the participants pressed the button to move to the next trial.
The Necker cube (Figure 1e) is an ambiguous line drawing showing a cube in which observers perceive a cube flipping between two perspectives. In the first scene (Figure 1e), a rod passed in front of the cuboid in oblique perspective. We expected that observers would not see reversals in perspective because their attention should be focused on the fast-moving rod. In the next scene, one rod moved rightward along the cuboid of one perspective while the other rod moved downward along the cuboid of the alternative perspective. This movie was expected to make participants understand how the cube could change its perspective by changing the sides of the cube appearing behind the rod. The movie was looped in 4-s cycles.
The Shadow Ball illusion (Figure 1f) demonstrates how the motion of the “shadowless” ball is perceived ambiguously: It can be perceived as either rolling diagonally across the floor or as rising diagonally along the same depth plane. It is believed that our visual system cannot decide between the two simplest possibilities for the movement of the ball. The trajectory of the ball without a shadow is consistent with a ball rising on the same depth plane as well as a ball receding into the distance against a level surface. A shadow is a strong cue for both the ball's trajectory and its depth. Thus, in the first scene presented to participants a gray ball without a shadow moved along a diagonal trajectory. The participants were supposed to perceive it as either rolling diagonally across the floor or as rising diagonally along the same depth plane. The movie sequence was 10 s long and was played in a loop. In the following scene, we added the diagonal and “zig-zag” moving shadow, which should have made the ball appear to roll diagonally across the floor in the first case or to bounce along the floor in the second case. Participants who saw this series of stimuli were supposed to understand that the ball's perceived motion depends on the shadow's motion. One movie sequence was 10 s long and was played in a loop until the participants pressed the button to move to the next trial.
In the second group of stimuli, each pair contained one figure with reduced illusory effect and one figure with the highest possible intensity of illusory effect. This group includes the four stimuli shown in Figure 2.
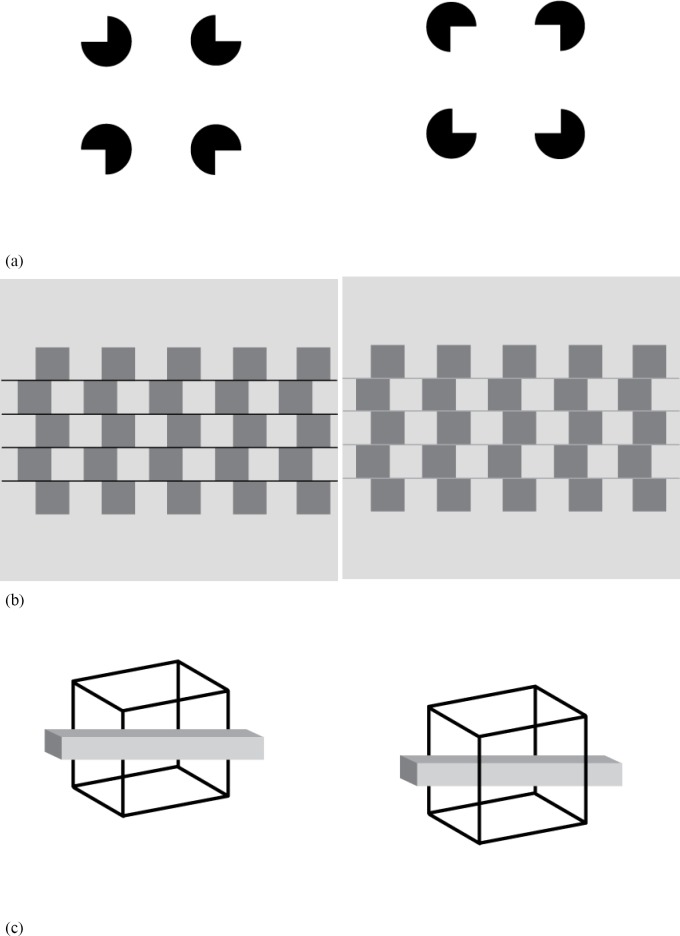
A modification of the Münsterberg checkerboard figure (Figure 2a) has the checkerboard pattern with horizontal borders isoluminant with the light regions. When the position of the dark and light tiles deviates from the standard checkerboard pattern, the alternate horizontal lines appear to be slightly tilted in opposite directions. The strongest effect occurs when the rows of the tiles are separated by a thin line of mortar and its luminance is between the luminance of the dark and light tiles. This was demonstrated by Gregory (1979) as the Café Wall illusion. In the first scene presented to our participants, mortar lines between rows were of the same luminance as the light tiles. Alternate rows were moving horizontally in the same direction at a constant speed. Observers were supposed to perceive the mortar lines being slightly tilted when the position of the dark and light tiles deviated from the usual checkerboard pattern. However, in the following scene, we changed the mortar lines’ luminance to gray. Participants should have experienced a strong tilt illusion. One cycle was 5 s long and was played in a loop until the participants pressed the button to move to the next trial.
The Penrose triangle (Figure 2b) is a tribar that appears to be a solid object made of three straight beams of a square cross section that meet pairwise at right angles at the vertices of the triangle they form. Parts of the triangle are not ambiguous, but they are drawn in incompatible perspectives and thus cannot be realized by any three-dimensional object in ordinary Euclidean space. In such ambiguous figures, there is a perceptual conflict between the local and global distribution of the elements. In order to create “disambiguous” figures, we needed to resolve the local–global perceptual conflict. The first scene presented to the participants had a triangle split into three pieces shaped like the letter V, and we called it a “disambiguous” figure because the two tiles of each letter V are drawn in a possible perspective. In the following scene the three V-shaped pieces were joined at the ends to form a triangle, but in this case, the triangle they formed had sides drawn in incompatible perspectives. We used dynamic demonstration to show how the illusion can emerge and to allow time for participants to discern how the ambiguity arose. One cycle was 6 s long and was played in a loop until the participants pressed the button to move to the next trial.
The Pinna illusion (Figure 2c) has the parallelograms delineated by two white and two black edges, each of which are grouped by proximity in three concentric rings. All the parallelograms have the same width, length, and orientation in relation to the center of their circular arrangements. When the observers’ heads are slowly moved toward the figure with the gaze fixed at the center, the inner ring of the parallelograms appears to rotate counterclockwise while the outer ring clockwise. The direction of rotation is reversed when the observers move away from the figure. In the first scene presented to the participants, the rings of the parallelograms expanded and contracted physically as if the observers were moving their heads toward and away, respectively, from the figure. We added shorter parallelogram diagonal lines, which were supposed to even out the local distribution of elements in all rings, and therefore, participants should have perceived a weak illusory effect (Fermüller and Malm 2004). While expanding, the inner ring of the parallelograms should have appeared to rotate slightly in the counterclockwise direction and the outer ring slightly in the clockwise direction. The perceived direction of rotation should have been reversed when the image contracted. In the following scene, instead of the short lines, we added longer diagonal lines to the middle ring squares, which were supposed to enhance the illusory effect caused by the uneven distribution of elements (Fermüller and Malm 2004). In both stimuli, one cycle was 5 s long and was played in a loop until the participants pressed the button to move to the next trial.
The Rotating Snakes illusion (Figure 2d) is a static image that appears to move slowly and “spontaneously.” The strongest illusory effect is seen in the radial circular pattern. To reduce the strength of the Rotating Snakes illusion, we rearranged its constituent elements into a columnar pattern, as it gives weak or no illusory motion. Participants were presented first with a columnar pattern and then with a circular radial pattern.
In the third group of stimuli, each pair contained one non-illusory figure and one illusory figure. This group includes the five stimuli shown in Figure 3.
The Breathing Square illusion (Figure 3a) has a red square rotating at a constant speed around an imaginary y-axis. The rotating red square is partially hidden by four blue squares (occluders). What is commonly perceived is that the red square appears to grow and shrink as it turns, but in fact, its size does not change. This illusion depends on the size of the occluders, and thus in the first scene presented to the participants, the width of the cross arms formed by the blue occluders was 50% to 60% of the length of the side of the rotating square. What most observers were supposed to see was the square rotating but not changing in size. In the next scene we changed the size of the occluders, forming a cross of small arm width. When the red square rotated, most observers were supposed to perceive the square changing in size so that it appeared to “breathe”—contract and expand. After a few seconds, occluders began to contract, and once the occluders were small enough (the same size as that in the first scene), the illusion disappeared. In both stimuli, one cycle was 8 s long and played in a loop until participants pressed the button to move to the next trial.
The Kanizsa Square (Figure 3b) image has four black Pac-Men facing inward that create an impression of the white illusory square superimposed on the four black circles. If four Pac-Men are randomly placed on a white canvas, most observers should not perceive anything else besides those four Pac-Men. Thus, to show how the illusion arises, the four randomly placed Pac-Men were put in rotation until they were facing inward to form the illusory square, although none was drawn. The illusory square was supposed to disappear once the Pac-Men began rotating backward to return to their initial position. One cycle was 6 s long and played in a loop until participants pressed the button to move to the next trial.
The Luckiesh pattern (Figure 3c) is an optical illusion that demonstrates how bounding objects such as circles can appear distorted in the presence of radiating lines. The first dynamic stimulus presented to the participants showed a circle passing through the vertical parallel lines in which case the circle should not appear distorted. In the next scene the circle passed through the set of radiating lines that made the circle appear distorted. Observers who saw these dynamic stimuli series were supposed to understand that the circle would appear distorted only in the presence of the radiating lines but not in the presence of the vertical parallel lines. In both stimuli, one movie sequence was 17 s long and played in a loop until the participants pressed the button to move to the next trial.
Combining a low-spatial-frequency and a high-spatial-frequency image yields a hybrid image that can be interpreted differently depending on the viewing distance. We used the Marilyn–Einstein hybrid image (Figure 3d), which is a combination of the low-spatial-frequency Marilyn Monroe image and the high-spatial-frequency Albert Einstein image. When seeing it close up, most observers can recognize the face of Albert Einstein, but if they step back, the image of Marilyn Monroe becomes clear. In the scene presented first to the participants, we used high spatial frequency images of Marilyn and Albert whose interpretation does not depend on the viewing distance (size of the image on the screen—large vs thumbnail size is irrelevant). In the following scene we presented a large size hybrid image of Albert Einstein and Marilyn Monroe, and most observers were supposed to see only the image of Albert Einstein. To reveal the presence of the low-spatial-frequency image of Marilyn Monroe, after a few seconds, the hybrid image shrank to thumbnail size when the thumbnail image of Marilyn Monroe appeared below and most observers were supposed to see notable resemblance in these pictures. In both stimuli, one “zoom in zoom out” sequence was 5 s long and played in a loop until the participants pressed the button to move to the next trial.
The Sound Wave illusion (Figure 3e) has the checkerboard pattern as the basic image. The rows of dark and light tiles are separated by a thin line of mortar. The mortar lines do not appear to be distorted or tilted in a typical checkerboard pattern; however, if small white squares are added in the corners of the larger black squares, the vertical or horizontal mortar lines appear distorted. Using animation, we gradually added the small white squares to the larger black squares of the checkerboard pattern and then in the same fashion gradually removed them. In this way, observers were supposed to understand that the mortar lines appear distorted only when small white squares are present in the corners of the larger black squares. One cycle was 8 s long and played in a loop until participants pressed the button to move to the next trial.
2.1.3. Procedure
Subjects were individually tested. Participants sat approximately 50 cm away from the computer screen. Each participant was presented with all experimental trials. Thirty stimuli were presented one at a time in 15 pairs of trials. For each pair, one was an illusory image while the other was an image with reduced-or-no illusory effect. The presentation of the no-or-weak illusory stimulus always preceded that of the illusory stimulus (Figure 3). Subjects were given the task to look at the object or the scene as long as they wanted or needed to until the image became boring. Their observation time was measured. They were instructed to observe each scene carefully, paying attention to changes. In each trial, participants indicated their judgments of implicit features and Aesthetic Experience (choosing the value on the SJF 12 and AE3 scales) for the image shown in that particular trial. The presentation time was individual because subjects decided how long they wanted or needed to see each scene. When they were ready, they pushed the forward button, and the next trial began. There was no interstimulus interval. Pairs of stimuli were randomized in order to neutralize the possible effect of sequence and practice. In addition, the order of the scales was randomized for each participant and each stimulus.
3. Results and discussion
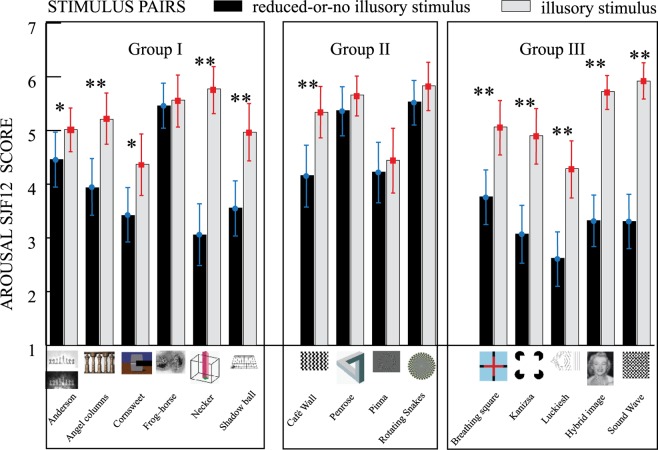
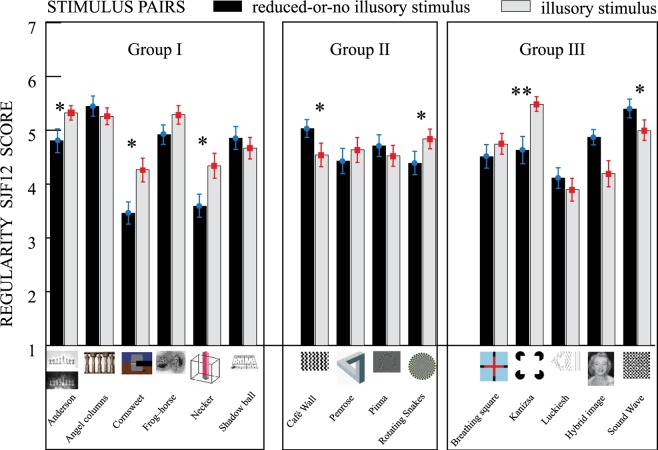
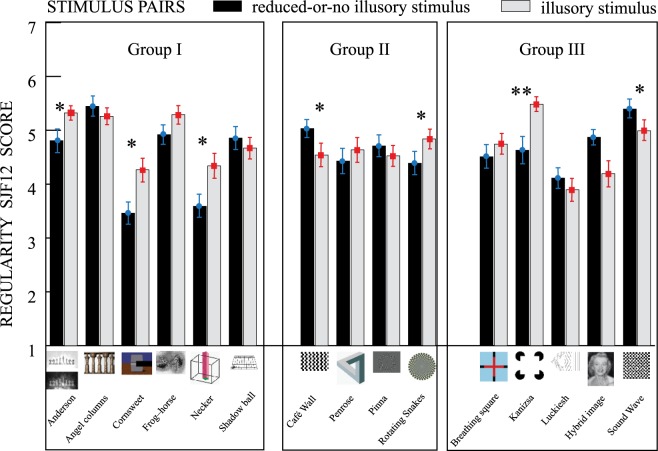
For Evaluation scores, the pooled average rating of the illusory stimuli (Mean 4.67, SD 1.18) was higher than that of the stimuli with reduced-or-no illusory effect (Mean 4.29, SD 1.04)(F(1,30) = 23.41, p < 0.01). For Arousal scores, the pooled average rating of the illusory stimuli (Mean 5.20, SD 1.29) was higher than that of the stimuli with reduced-or-no illusory effect (Mean 3.95, SD 1.39) (F(1,30) = 151.06, p < 0.01). For Regularity scores, the pooled average rating of the illusory stimuli (Mean 4.61, SD 1.14) was lower than that of the stimuli with reduced-or-no illusory effect (Mean 4.73, SD 1.09), but this difference was not statistically significant (F(1,30) = 2.45, ns). Finally, the pooled average of Aesthetic Experience scores for the illusory stimuli (Mean 4.08, SD 1.61) was higher than that of the stimuli with reduced-or-no illusory effect (Mean 2.92, SD 1.42) (F(1,30) = 96.79, p < 0.01). These results revealed that illusory stimuli were judged significantly higher than stimuli with reduced-or-no illusory effects for Arousal, Evaluation, and Aesthetic Experience, but not for Regularity.
Figure 4.
The lower sequence of images shows the stimulus presented first, and the upper sequence of images shows the subsequent stimulus. The lower sequence of images shows the enhanced Cornsweet effect, in which the upper gray surface is commonly perceived as darker than the lower one, although the brightness of both surfaces is exactly the same. Novice viewers do not see this illusion until it is demonstrated that the brightness of both surfaces is exactly the same. Thus, by covering the gradient region containing the border between the two gray surfaces (upper sequence of images), observers are supposed to see that the brightness of both surfaces was the same.
In addition, the results revealed a significant effect of “stimuli” on judgments of Evaluation (F(14,30) = 6.46, p < 0.01), Arousal (F(14,30) = 13.03, p < 0.01), Regularity (F(14,30) = 8.83, p < 0.01), and Aesthetic Experience (F(14,30) = 9.85, p < 0.01). There was also a significant interaction between “illusion” and “stimuli” for judgments of Evaluation (F(14,420) = 2.41, p < 0.01), Arousal (F(14,420) = 12.78, p < 0.01), Regularity (F(14,420) = 5.18, p < 0.01), and Aesthetic Experience (F(14,420) = 6.89, p < 0.01).
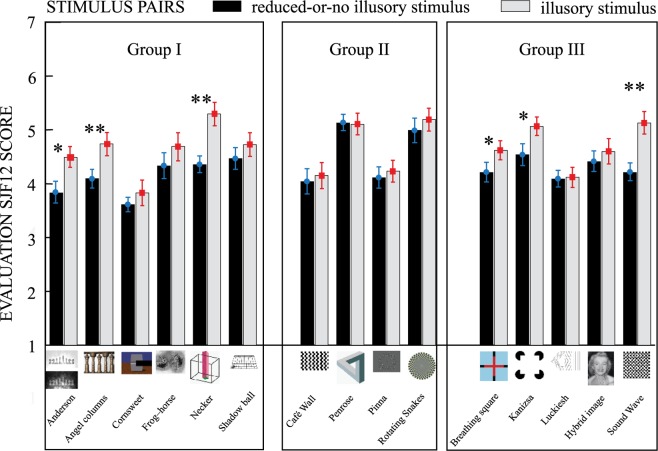
For Evaluation scores (Figure 5), certain stimuli got relatively high average ratings; for example, the Penrose triangle, Rotating Snakes figures, Necker cube, Kanizsa square, and the Sound Wave illusion. The Cornsweet effect figure was rated significantly lower than all other illusions used in this study. Furthermore, for Arousal scores (Figure 6), the Cornsweet effect figure, together with the Kanizsa square and the Luckiesh pattern, received statistically lower average ratings than the Rotating Snakes figure, Penrose triangle, frog–horse figure, Café Wall, Anderson, and Sound wave illusions. Similarly, for Regularity scores (Figure 7), the Luckiesh pattern, Cornsweet effect figure, and Necker cube figure received lower ratings than the Angel columns, Anderson illusion, frog–horse, and Kanizsa square figures. Finally, the Penrose triangle, Rotating snakes pattern, frog–horse figure, Café Wall, and Sound wave illusion received statistically higher aesthetic scores compared to the Luckiesh pattern, Cornsweet effect figure, and Kanizsa square (Figure 8). The Necker cube was rated significantly lower than the Penrose triangle, Rotating snakes pattern, and frog–horse figure.
Figure 5.
Evaluation scores for each stimulus pair. Black columns show the scores of the stimuli with reduced-or-no illusory effect, and gray columns indicate those of the illusory stimuli. Vertical bars denote +/− standard errors. ∗∗ stands for p < 0.01 and ∗ for p < 0.05 of the partial differences between reduced-or-no illusory and illusory pattern in a stimulus pair.
Figure 6.
Arousal scores for each stimulus pair. Black columns show the scores of the stimuli with reduced-or-no illusory effect, and gray columns indicate those of the illusory stimuli. Vertical bars denote +/− standard errors. ∗∗ p < 0.01 and ∗ p < 0.05 of the partial differences between reduced-or-no illusory and illusory pattern in a stimulus pair.
Figure 7.
Regularity scores for each stimulus pair. Black columns show the scores of the stimuli with reduced-or-no illusory effect and gray columns indicate those of the illusory stimuli. Vertical bars denote +/− standard errors. ∗∗ p < 0.01 and ∗ p < 0.05 of the partial differences between reduced-or-no illusory and illusory pattern in a stimulus pair.
Figure 8.
Aesthetic experience scores for each stimulus pair. Black columns show the scores of the stimuli with reduced-or-no illusory effect and gray columns indicate those of the illusory stimuli. Vertical bars denote +/− standard errors. ∗∗ p < 0.01 and ∗ p < 0.05 of the partial differences between reduced-or-no illusory and illusory pattern in a stimulus pair.
Interestingly enough, the largest differences between illusory and reduced-or-no illusory patterns were obtained for Arousal and Aesthetic Experience scores of the Necker cube and Sound wave stimuli. Relatively large differences between illusory and reduced-or-no illusory patterns were also obtained for the Marilyn–Einstein hybrid image, Shadow ball illusion, Breathing square, Kanizsa square, Luckiesh pattern, and Café Wall stimulus pairs. However, certain partial differences for Arousal and Aesthetic Experience scores were not significant; for example, the frog–horse stimulus pair, Penrose triangle stimulus pair, Pinna illusion stimulus pair, and Rotating snakes stimulus pair. Partial differences between aesthetic scores of illusory patterns and patterns with reduced-or-no illusory effects were significant except for the Rotating snakes stimulus pair (Figure 8).
3.1. Correlation and regression analysis between SJF12 and AE3
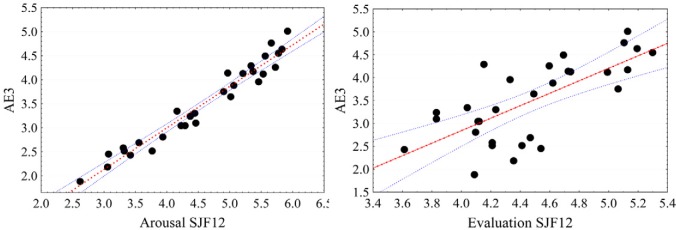
Previous studies of Aesthetic Experience and implicit features of paintings (Marković and Radonjić 2008; Marković 2010) demonstrated significant correlation between Aesthetic Experience and judgments of implicit features of paintings. Our results agreed with these studies because significant Pearson's correlation coefficients between Evaluation and Aesthetic Experience (r(28) = 0.70, p < 0.01) and between Arousal and Aesthetic Experience (r(28) = 0.97, p < 0.01) were obtained. For the correlation and regression analysis, we calculated the mean rating score for each stimulus (15 illusory and 15 with reduced-or-no illusory effect) on Evaluation, Arousal, Regularity, and Aesthetic Experience. Multiple regression analysis of the data matrix consisting of SJF12 and AE3 dimensions in columns and stimuli in rows (4 × 30) showed that the SJF12 factors were good predictors of AE3: r2 = 0.96, F(3,26) = 224.92, p < 0.001. Arousal, β = 0.88, t(26) = 17.69, p < 0.001, and Evaluation, β = 0.12, t(26) = 2.57, p < 0.05, significantly predicted Aesthetic Experience scores (Figure 9), whereas Regularity was not found to be a significant predictor of Aesthetic Experience, t(26) = 0.74, p > 0.05). Beta coefficients implied that Arousal might be a better predictor than Evaluation, but in order to determine whether Arousal was a significantly better predictor than Evaluation, we used an additional test. First, we examined multicolinearity between Arousal and Evaluation because the correlation between them was 0.61. If there was multicolinearity, we could not argue their independent contributions to the regression model. Colinearity statistics indicated that the tolerance for Evaluation was 0.567 and for Arousal was 0.571, which was much higher than 0.02 (a lower boundary that would suggest multicolinearity). Furthermore, the average VIF value was 1.53, which was lower than 10 (an upper boundary). Thus, we found no problem of multicolinearity and could proceed with testing which of the two independent variables would better predict aesthetic responses. We used a test proposed by Meng et al (1992), a simple extension of Dunn and Clark's (1969) work, which uses Fisher's Z transformation and includes the test and confidence interval for comparing two correlated correlations. The Z test value was 5.86 when comparing the correlation between Arousal and Aesthetic Experience (r1 = 0.976) with the correlation between Evaluation and Aesthetic Experience (r2 = 0.712). The 95% confidence interval was 1.32+/−0.43, (0.89, 1.75), two-tailed p < 0.01. Thus, we may conclude that Arousal predicts Aesthetic Experience responses significantly better than Evaluation.
Figure 9.
Scatterplot of the regression analysis: (a) Arousal and (b) Evaluation were predictors, and Aesthetic Experience was a criterion variable.
3.1.1. Observation time for the illusory and non-illusory stimuli; Correlation with SJF12 and AE3
Previous studies demonstrated significant correlation between observation time and collative variables: complexity and novelty (Berlyne and Lewis 1963; Berlyne and Lawrence 1964; Berlyne 1958, 1971, 1974c), as with Silvia's construct of coping potential check (ability to understand an object or a scene) (Silvia 2005b). We expected significant correlations between observation time and Evaluation, Arousal, Regularity, and Aesthetic Experience, in addition to longer observation time for illusory stimuli compared to stimuli with reduced-or-no illusory effect. Some of these expectations were confirmed by the results of this study, but others were not. The pooled average of the observation time for illusory stimuli (Mean 21.69 s, SD 17.58 s) was significantly longer than the observation time for stimuli with reduced-or-no illusory effect (Mean 12.79 s, SD 11.89 s) (F (1,30) = 57.87, p < 0.001), which suggests that subjects spent more time viewing illusory stimuli. In addition, there was a significant main effect of “stimuli” (F(14,30) = 9.39, p < 0.001) and significant interaction between “stimuli” and “illusion” (F(14,30) = 3.78, p < 0.001), showing no significant differences in observation time between certain illusory patterns and patterns with reduced-or-no illusory effect for the frog–horse stimulus pair, Café Wall stimulus pair, Penrose triangle stimulus pair, Rotating snakes stimulus pair, and Kanizsa square stimulus pair (Table 2).
Table 2. Observation time of illusory stimuli and stimuli with reduced-or-no illusory effect.
| Observation time (s) | Reduced-or-no illusory stimulus | Illusory stimulus | Significance level |
| Anderson illusion | 11.76 | 21.02 | ∗ |
| Angel columns | 11.47 | 28.58 | ∗∗ |
| Enhanced Cornsweet effect | 14.00 | 26.46 | ∗∗ |
| Frog–horse figure | 22.14 | 24.65 | ns |
| Necker cube | 10.67 | 17.86 | ∗ |
| Shadow ball illusion | 14.83 | 30.18 | ∗∗ |
| Café Wall illusion | 12.33 | 14.95 | ns |
| Penrose triangle | 10.20 | 13.81 | ns |
| Pinna illusion | 15.38 | 22.57 | ∗ |
| Rotating Snakes illusion | 17.43 | 13.84 | ns |
| Breathing square illusion | 13.49 | 25.38 | ∗∗ |
| Kanizsa square illusion | 8.36 | 8.36 | ns |
| Luckiesh pattern | 21.61 | 41.53 | ∗∗ |
| Marilyn–Einstein hybrid image | 9.09 | 18.12 | ∗∗ |
| Sound Wave illusion | 8.42 | 18.08 | ∗∗ |
∗∗ p < 0.01;
∗ p < 0.05W
We found non-significant positive correlations between observation time and Arousal (r(28) = 0.36, p > 0.05), as well as with Aesthetic Experience (r(28) = 0.32, p > 0.05). In addition, regression analyses showed that none of the SJF12 factors or AE3 were significant predictors of observation time: r2 = 0.20 F(4,25) = 1.61, p > 0.05 (Table 3). Future studies could test these tendencies on a greater number of illusion examples. Other physiological measures that may reflect affective changes should also be taken into account, eg, the psychogalvanic reflex or heart rate.
Table 3. Multiple regression analysis: The relationship between observation time (criterion variable) and SJF12 and AE3 judgments (predictor variables).
| t(25) | Significance level | |
| Evaluation | −1.47 | 0.15 |
| Arousal | 0.44 | 0.66 |
| Regularity | −1.17 | 0.25 |
| Aesthetic Experience | 0.22 | 0.83 |
To summarize, we can say that some of our hypothesis were confirmed: the stimuli that enabled observers to discern the included illusions (which showed how the illusion can be disambiguated or showing gradual transformation starting from reduced-or-no illusory figures to fully illusory figures) were regarded as more interesting and more fascinating than the visual patterns with reduced-or-no illusory effect. In other words, we would argue that the illusive nature itself, if revealed to observers, increases the aesthetic and affective valence of visual patterns. This is most evident with the stimuli which are rather simple in shape or with fewer details like the Necker cube and Kanizsa square. The large differences in aesthetic scores obtained between illusory and their non-illusory counterparts speak in favor of this idea. In order to test the generalizability of this finding and to try to establish a better experimental control, we conducted the second experiment.
4. Experiment 2
In Experiment 1, reduced-or-no illusory stimuli always preceded illusory stimuli, suggesting a possibility that this fixed order might have affected the results. To examine whether the order of presentation has an effect on aesthetic and affective scores, Experiment 2 compared the order when non-illusory stimuli were followed by illusory stimuli with its reversed order when illusory stimuli were followed by non-illusory stimuli.
Non-illusory and illusory patterns were matched in as many perceptual features as possible: the number of elements, visual appearance and the presence or duration of the motion, hence the notable difference was whether or not illusion was included and discerned. We selected a few pairs of stimuli that showed remarkable differences in Experiment 1, such as the Necker cube or Kanizsa square to obtain better control stimuli and to test generalizability of the findings of Experiment 1. In this respect, we asked university students to participate in this experiment, rather than to merely replicate the first experiment.
4.1. Methods
4.1.1. Participants
Students of the Ritsumeikan University from the psychology and history departments (4 females and 17 males; mean age 25.6 years old) participated.
4.1.2. Stimuli
We chose to develop further the four stimulus pairs used in the first experiment, which had yielded the largest differences between reduced-or-no illusory and illusory figures: The Kanisza square stimulus pair, the Café Wall stimulus pair, the Necker cube stimulus pair, and the Sound Wave stimulus pair. As the fifth stimulus pair, we added the modification of the optimized Fraser–Wilcox illusion type IIa (Kitaoka, 2008a, 2008b) as a variation of the Rotating snakes pattern. In the first experiment, only the Rotating snakes stimulus pair received no significant differences in Aesthetic Experience scores. The version we used in the present study is rather novel to participants, which is one of the reasons why we did not include the Rotating snakes illusion as many participants may have been familiar with it.
Figures with no illusory effect looked as similar to the illusory figures as possible in the number of elements and visual appearance but without illusory effect (Figure 10). In the first experiment, we used several stimulus pairs in which the reduced-or-no illusory figure was stationary and the illusory figure was dynamic. One may argue that the motion might have increased aesthetic scores; thus, all stimuli used in the present study were dynamic (ie no stationary images were used).
Figure 10.
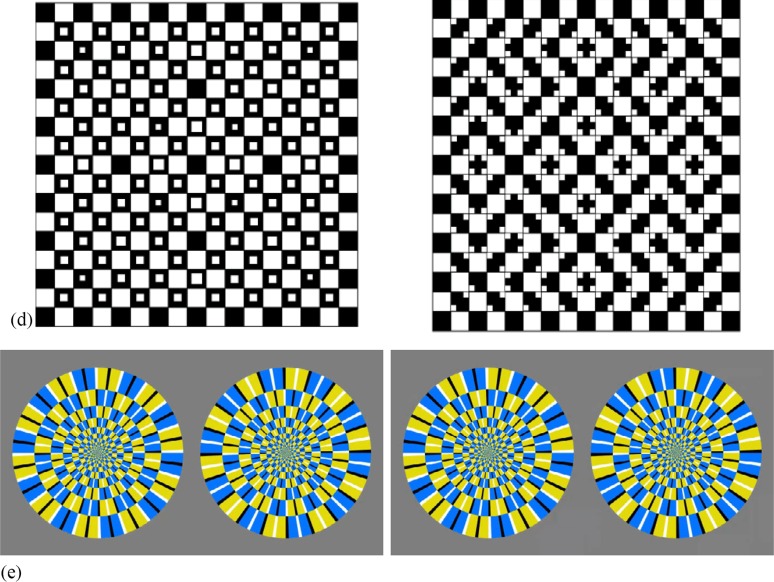
Modified versions of the original illusory patterns are shown in the first column and original illusory patterns in the second column: (a) Kanizsa square illusion (Kanizsa 1955, 1976), (b) Café Wall illusion (Gregory and Heard 1979), (c) Necker cube (Necker 1832), (d) Sound Wave illusion (Kitaoka 1996), (e) The modification of the optimized Fraser Wilcox illusion, type II (Kitaoka 2008a, 2008b). Click on image to view animation.
For example, in the first experiment, the modification of the Kanizsa square was a stationary image with the four Pac-Men randomly placed on a white canvas, hence no illusory square could be observed. In the second experiment, we made dynamic modification of the same image. Those four Pac-Men rotated simultaneously until they were aligned outward and for the illusory stimulus, the Pac-Men rotated simultaneously until they were facing inward (Figure 10a). In this way the possible motion effect could be controlled.
The Café Wall illusion (Figure 10b) was a bit modified for the second experiment. For the non-illusory stimulus instead of using the mortar lines that are isoluminant with the light tiles, we followed Gregory's definition of the Café Wall illusion (Gregory and Heard 1979) and used the light and dark gray tiles separated by a thin line of mortar whose luminance wasn't between the luminance of the dark and light tiles ie they were black. For the illusory stimulus, the luminance of the mortar lines was exactly between the luminance of the dark and light tiles. Alternate rows were moving horizontally in the same direction at a constant speed. The version we created for the second experiment is not the typical version of the Café Wall illusion, thus participants should not be familiar with it.
For the modification of the Necker cube illusion (Figure 10c) we used a gray scale rod that moved along the horizontal and vertical trajectories in front of the cuboid in oblique perspective. In the first experiment, the rod was of a different color in illusory and non-illusory stimulus, thus we wanted to make them as similar as possible. For the illusory stimulus, one rod moved rightward along and through the cuboid of one perspective, and the other rod moved downward along and through the cuboid of the alternative perspective. This movie was expected to make participants understand how the cube could change its perspective by changing which cube side appeared behind the rod.
The non-illusory modification of the Sound wave illusion pattern was created by adding small white squares in the center of the larger black squares. In this way, the horizontal and vertical mortar lines did not appear to be distorted or tilted but the non-illusory and illusory stimulus were matched in visual appearance and presence of the motion. In dynamic version of the Sound wave illusion small white squares are added in the corners of the larger black squares, hence the vertical or horizontal mortar lines should appeared distorted (Figure 10d). The area of those small white squares was subtracted from that of the larger white squares placed in the center of the non-illusory pattern. Observers were supposed to understand that the mortar lines appear distorted only when the small white squares are present in the corners of the larger black squares.
The optimized Fraser Wilcox illusion type II pattern has an array of four regions of different luminance in the systematic order “black,” “dark grey (blue),” “white,” and “light grey” (yellow), which evokes the perception of a slow rotational illusory motion. If the color sequence between adjacent units is reversed, most observers do not perceive any rotational movement (Kuriki et al 2008). Thus, for the reduced-or-non illusory stimulus (Figure 10e), we created circular patterns with units of colors in the following order: blue, black, blue, white, yellow, black, yellow, white or blue, white, blue, black, yellow, white, yellow, black. Using a video transition that fades out one scene while fading in the next, after a few seconds, two adjacent blue units switched places with the two adjacent yellow units. Black and white units kept their positions. For the illusory stimulus the color sequence reversed between adjacent yellow and blue units to create the optimized Fraser Wilcox illusion type II pattern, which appears to rotate slowly and “spontaneously.”
4.1.3. Procedure
The procedure was very similar to Experiment 1. Subjects were individually tested. Participants sat approximately 70-cm away from the computer screen. Each participant was presented with all experimental trials. Ten stimuli were presented one at a time in five pairs of trials. For each pair, one was an illusory image and the other was a non-illusory image. One group of the participants was presented with the non-illusory stimulus followed by the presentation of the illusory stimulus. Another group of participants had the illusory followed by non-illusory stimulus. In each trial, participants indicated their judgments of implicit features and Aesthetic Experience (choosing the value on the SJF 12 and AE3 scales) for the image shown in that particular trial.
5. Results and discussion
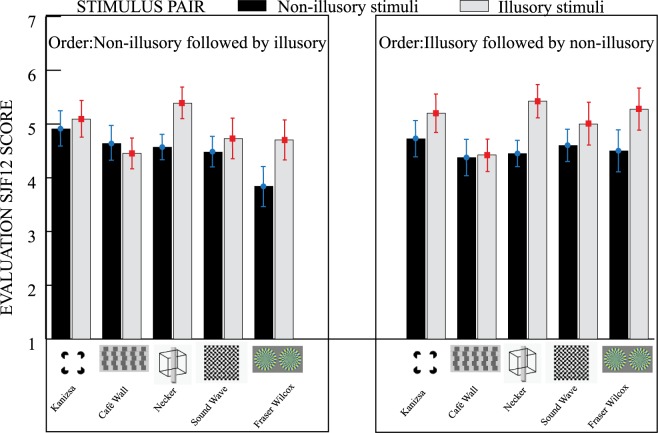
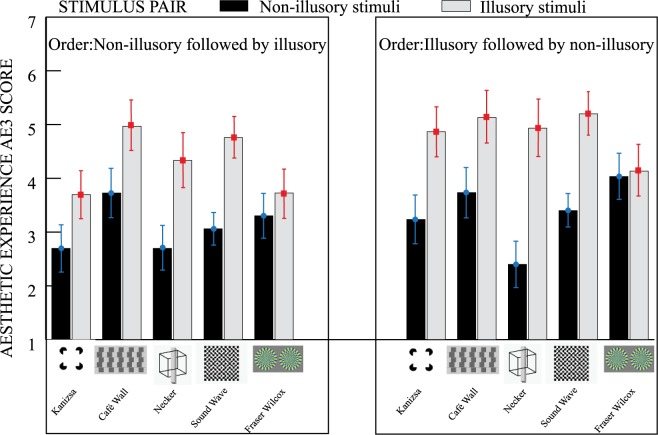
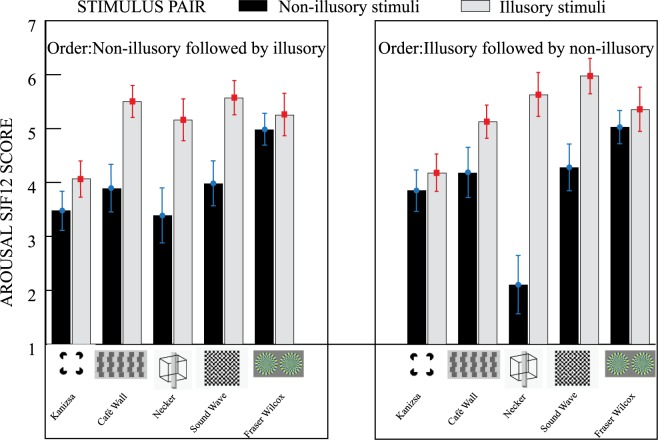
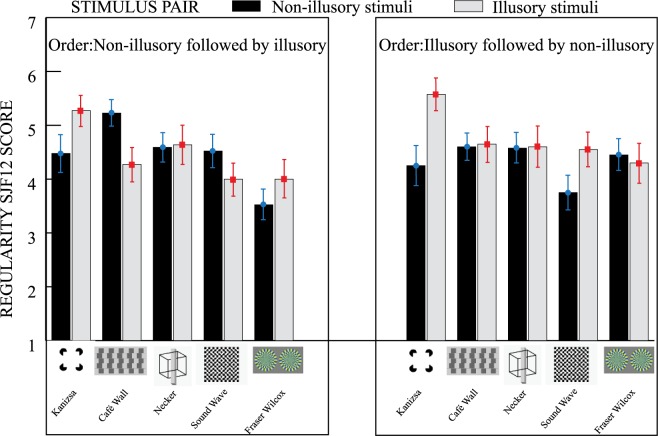
The mean rating scores for Evaluation, Arousal, Regularity, and Aesthetic Experience are shown in Figures 11–14. Results revealed that there was no significant effect of presentation order for each score (all F < 1). There were also no significant interactions between “illusion” and “stimuli” for each score. These results exclude the possibility that testing order might have played a part in Experiment 1.
Figure 11.
Evaluation scores for each stimulus by order of the presentation. Black columns show the scores of the non-illusory stimuli and gray columns indicate those of the illusory stimuli. Vertical bars denote +/− standard errors.
Figure 14.
Aesthetic experience scores for each stimulus by order of the presentation. Black columns show the scores of the non-illusory stimuli and gray columns indicate those of the illusory stimuli. Vertical bars denote +/− standard errors.
Figure 12.
Arousal scores for each stimulus by order of the presentation. Black columns show the scores of the non-illusory stimuli and gray columns indicate those of the illusory stimuli. Vertical bars denote +/− standard errors.
Figure 13.
Regularity scores for each stimulus by order of the presentation. Black columns show the scores of the non-illusory stimuli and gray columns indicate those of the illusory stimuli. Vertical bars denote +/− standard errors.
For Evaluation scores, the pooled average rating of the illusory stimuli (Mean 4.96, SD 1.12) was higher than that of the non-illusory stimuli (Mean 4.51, SD 1.02) (F(1,19) = 20.78, p < 0.01). For Arousal scores, the pooled average rating of the illusory stimuli (Mean 5.18, SD 1.23) was higher than that of the non-illusory ones (Mean 3.92, SD 1.51) (F(1,19) = 60.18, p < 0.01). For Regularity scores, the pooled average rating of the illusory stimuli (Mean 4.58, SD 1.13) was higher than that of the stimuli without illusory effect (Mean 4.40, SD 1.02), but this difference was not statistically significant (F(1,19) < 1). Finally, the pooled average of Aesthetic Experience scores for the illusory stimuli (Mean 4.56, SD 1.54) was higher than that of the non-illusory stimuli (Mean 3.22, SD 1.38) (F(1,19) = 39.35, p < 0.01). These results revealed that illusory stimuli were judged significantly higher than non-illusory stimuli for Arousal, Evaluation, and Aesthetic Experience, but not for Regularity. These results are entirely consistent with those of Experiment 1.
Furthermore, the results revealed a significant effect of “stimuli” on judgments of Arousal (F(4,19) = 6.67, p < 0.01), Regularity (F(4,19) = 5.35, p < 0.01), and Aesthetic Experience (F(4,19) = 3.4, p < 0.01). There was also a significant interaction between “illusion” and “stimuli” for judgments of Arousal (F(4,76) = 9.05, p < 0.01), Regularity (F(4,420) = 4.71, p < 0.01), and Aesthetic Experience (F(4,76) = 6.75, p < 0.01).
Furthermore, partial differences for Arousal scores between illusory and non-illusory patterns were not significant for the Kanizsa square stimulus pair and optimized Fraser Wilcox illusion type II stimulus pair. Interestingly enough, partial differences between aesthetic scores of illusory and non-illusory patterns were significant except for the optimized Fraser Wilcox illusion type II stimulus, which confirms the results of Experiment 1.
Similarly, large differences between illusory and non-illusory patterns were obtained for the Arousal and Aesthetic Experience scores of the Necker cube and Sound wave figures, which is in line with the results of Experiment 1. Furthermore, the Kanizsa square and the Necker cube received overall lower ratings on Arousal and Aesthetic Experience than the Café Wall, Sound wave, or optimized Fraser Wilcox illusion, although they showed significantly higher scores on Regularity than the Sound wave or optimized Fraser Wilcox illusion. These results also agree with those of Experiment 1.
6. General discussion
In this study we obtained judgments of implicit features and Aesthetic Experience for pairs of stimuli, an illusory pattern and its reduced-or-no illusory counterpart. The results suggest that illusory patterns (1) are more arousing, ie, they were judged as more interesting, imaginative, complex, diverse, etc, (2) have higher hedonic tone, ie, they were scored as more pleasant, cheerful, bright, clear, etc., and (3) possess aesthetic qualities, ie, they were judged as more fascinating, exceptional, irresistible, etc. However, variations in illusion strength did not affect cognitive clarity (definite, realistic, etc) or aesthetic balance (harmonious, coherent, etc). The stimuli we examined were designed to enable observers to discern the included illusions. Two stimuli sets were matched in as many perceptual features as possible, but the notable difference was whether or not illusion was included and discerned. Once the illusion was revealed to observers, it increased the aesthetic and affective valence of the visual patterns. This was the most evident with the stimuli which are rather simple in shape or with fewer details like the Necker cube and Kanizsa Square. As visual patterns, they received relatively low overall ratings on Arousal and Aesthetic Experience as compared to the more complex richly detailed visual patterns like the Rotating snakes, Café Wall, frog-horse or Marilyn–Einstein hybrid image. It agrees with the notion that the complexity–simplicity dimension of visual patterns affects aesthetic responses. However, the differences in Arousal and Aesthetic scores between illusory and their non-illusory counterparts were among the largest. In other words, the presence of illusion created a robust effect on Arousal and Aesthetic judgments.
One possible explanation of this finding is that stimulus properties are actually less important for aesthetic assessment of visual illusions than the ease of discerning the included illusion (ie, the ease of deriving an “A-ha” experience). Furthermore, this strongly agrees with the idea that objects which possess “high conceptual fluency due to meaningfulness” are processed more efficiently (achieving awareness of illusory effect) with less cognitive resources and therefore preferred over objects whose processing requires more of the cognitive resources (see Winkielman et al 2003; Reber et al 2004, for further discussion). In this respect, the understanding of the meaning of an object is weighted more heavily than stimulus factors in determining visual preference of the illusory patterns. We suggest that the Aesthetic Experience of visual illusions might reflect an interaction between assessments of the illusory effect (how fascinating it might be) and efficiency of cognitive processing in observers (how easy was to understand it).
One surprising result of this study is that variations in strength of the motion illusion effect, such as in Rotating snakes figures, did not affect judgments of Aesthetic Experience. Both figures with strong and weak motion illusion obtained overall high aesthetic scores. It might be possible that certain illusions do not have an effect on Aesthetic Experience judgments, but we also recognize the possibility that the weak illusory figures possess such abundant colorfulness and richness in details to equal the aesthetic contribution from the illusion.
Other findings of the present study suggest that Aesthetic Experience of visual illusions is closer to Curiosity (ie, preferring unusual and interesting contents) than to Hedonic tone (pleasantness) as results indicated that Arousal is a better predictor of Aesthetic Experience than Evaluation. In defining what is interesting, the theories generally agree. Most theories proposed Berlyne's family of collative variables (novelty, complexity, surprisingness, incongruity, etc.) or similar concepts like information conflict (Nuannlly 1981) and information gaps (Loewenstein 1994). Cupchik and Gebotys (1990) found that the underlying dimension of interest reflected the perception of novelty and meaningfulness, while that of enjoyment reflected the perception of emotional warmth. As mentioned earlier, we argued that visual illusions can be related to the concepts of “surprisingness” and “incongruity”, which were expected to play an important role in aesthetic assessment of visual patterns. The results of this study agree well with our theoretical assumptions (see also Van der Cruys and Wagemans 2011).
Previous studies (Noguchi 2003; Yoshino et al 2009) found that strong affective preference occurred with strong effect of illusion; however, most of the stimuli Noguchi and his colleagues used were simple geometrical illusions. In this study we tried to cover a much wider range of illusory patterns and to offer better understanding of the implicit features and aesthetic properties of the illusory figures. Moreover, we tried to isolate and capture the contribution of the illusion in assessment of the visual patterns, as a phenomenal quality that has measurable aesthetic and affective valence. Having in mind all constraints of the present study, we may say that it provides a useful framework for studying the Aesthetic Experience of visual illusions. Future studies could, using a variety of visual stimuli (both artistic and non-artistic, eg, visual illusions), identify those invariants that bind together diverse types of artistic and non-artistic aesthetic objects, scenes, and events.
Acknowledgments
Part of this research was supported by the Ministry of Science and Technological Development of Republic of Serbia, grant number 149039 D and by the Grant-in-Aid for Scientific Research (A) (22243044) awarded to Akiyoshi Kitaoka by the Japan Society for the Promotion of Science. We thank Dr Heiko Hecht, Dr Gerald Cupchik, Dr DejanTodorović, Dr Dragan Janković, Zorica Stevanov, Dr Vasilije Gvozdenović for helpful comments and our animators Željko Šešum and Slobodan Matić for creating stimuli and Predrag Stanić for software support. We would like to thank our subjects for their patience and Petnica Science center for their facilities.
Biography
 Jasmina Stevanov received an undergraduate degree in Psychology from the University of Novi Sad and a Master's degree from University of Belgrade, Serbia. She worked with professor Slobodan Marković and developed interest in experimental aesthetic, psychology of art and visual illusions. She moved to Japan for her PhD, where she is now a doctoral student under Kitaoka Akiyoshi's supervision. Her main research interest is in visual illusions and experimental aesthetics.
 Slobodan Marković received both his undergraduate degree and PhD at the Psychology Department, University of Belgrade, Serbia, where he is currently an associate professor and a member of the Laboratory of Experimental Psychology. His main research interests include experimental aesthetic, psychology of art and perceptual organization.
 Akiyoshi Kitaoka received his PhD from the University of Tsukuba, Japan. This was followed by a staff scientist in the Tokyo Metropolitan Institute for Neuroscience. His subsequent academic career has been at Ritsumeikan University, where he is now Professor. His research interests are in the study of visual illusions and the production of illusion works. For more information visit http://www.ritsumei.ac.jp/∼akitaoka/index-e.html.
Contributor Information
Jasmina Stevanov, Graduate School of Letters, Ritsumeikan University, Kyoto, 56-1 Toji-in Kitamachi, Kita-ku, Kyoto 603-8577, Japan; e-mail: gr0050fs@ed.ritsumei.ac.jp; jasminastevanov@yahoo.com.
Slobodan Marković, Laboratory of Experimental Psychology, Department of Psychology, University of Belgrade, Čika Ljubina 18-20, 11000 Belgrade, Serbia; e-mail: smarkovi@f.bg.ac.rs.
Akiyoshi Kitaoka, Graduate School of Letters, Ritsumeikan University, Kyoto, 56-1 Toji-in Kitamachi, Kita-ku, Kyoto 603-8577, Japan; e-mail: akitaoka@lt.ritsumei.ac.jp.
References
- Anderson B L. Winawer J. Image segmentation and lightness perception. Nature. 2005;434:79–83. doi: 10.1038/nature03271. [DOI] [PubMed] [Google Scholar]
- Augustin M D. Wagemans J. Carbon C-C. All is beautiful? Generality vs. specificity of word usage in visual aesthetics. Acta Psychologica. 2011. [DOI] [PubMed]
- Berlyne D E. The influence of complexity and novelty in visual figures on orienting responses. Journal of Experimental Psychology. 1958a;55:3–3. doi: 10.1037/h0043555. [DOI] [PubMed] [Google Scholar]
- Berlyne D E. Structure and Direction in Thinking. New York: John Wiley and Sons; 1965. [Google Scholar]
- Berlyne D E. Aesthetics and Psychobiology. New York: Appleton Century-Crofts; 1971. [Google Scholar]
- Berlyne D E. Novelty, complexity, and interestingness. In: Berlyne D E, editor. The New Experimental Aesthetics. Washington, DC: Hemisphere Publishing Corporation; 1974b. pp. 175–180. [Google Scholar]
- Berlyne D E. Concluding observations. In: Berlyne D E, editor. The New Experimental Aesthetics. Washington, DC: Hemisphere Publishing Corporation; 1974c. pp. 305–332. [Google Scholar]
- Berlyne D. Lawrence G. Effects of complexity and incongruity variables on GSR, investigatory behavior and verbally expressed preference. The Journal of General Psychology. 1964;71:21–45. doi: 10.1080/00221309.1964.9710286. [DOI] [PubMed] [Google Scholar]
- Berlyne D E. Lewis J L. Effects of heightened arousal on human exploratory behavior. Canadian Journal of Psychology. 1963;17:398–411. doi: 10.1037/h0083274. [DOI] [PubMed] [Google Scholar]
- Berlyne D E. Ogilvie J C. Dimensions of perception of paintings. In: Berlyne D E, editor. The New Experimental Aesthetics. Washington DC: Hemisphere Publishing Corporation; 1974. pp. 181–226. [Google Scholar]
- Berlyne D E. Robbins M C. Thompson R. A cross-cultural study of exploratory and verbal responses to visual patterns varying in complexity. In: Berlyne D E, editor. The New Experimental Aesthetics. Washington, DC: Hemisphere Publishing Corporation; 1974. pp. 259–278. [Google Scholar]
- Biederman I. Vessel E A. Perceptual pleasure and the brain. American Scientist. 2006;94:249–255. [Google Scholar]
- Carbon C-C. Cognitive mechanisms for explaining dynamics of aesthetic appreciation. i-Perception. 2011;2:708–719. doi: 10.1068/i0463aap. doi: 10.1068/i0463aap. [DOI] [PMC free article] [PubMed] [Google Scholar]
- Cornsweet T. Visual Perception. New York: Academic Press; 1970. [Google Scholar]
- Cupchik G C. An experimental investigation of perceptual and stylistic dimensions of paintings suggested by art history. In: Berlyne D E, editor. The New Experimental Aesthetics. Washington, DC: Hemisphere Publishing Corporation; 1974. pp. 235–257. [Google Scholar]
- Cupchik G C. Berlyne D E. The perception of collative properties in visual stimuli. Scandinavian Journal of Psychology. 1979;20:93–104. doi: 10.1111/j.1467-9450.1979.tb00688.x. [DOI] [PubMed] [Google Scholar]
- Cupchik G C. Gebotys R J. Interest and pleasure as dimensions of aesthetic response. Empirical Studies of the Arts. 1990;8:1–14. [Google Scholar]
- Dunn O J. Clark V A. Correlation coefficients measured on the same individuals. Journal of the American Statistical Association. 1969;64:366–377. doi: 10.2307/2283746. [DOI] [Google Scholar]
- Ertel S. Exploratory choice and verbal judgment. In: Berlyne D E, editor; Madsen K B, editor. Pleasure, Reward, Preference. New York: Academic Press; 1973. pp. 115–132. [Google Scholar]
- Evans D R. Day H I. The factorial structure of responses to perceptual complexity. Psychonomic Science. 1971;22:357–359. [Google Scholar]
- Fermüller C. Malm H. Uncertainty in visual processes predicts geometrical optical illusions. Vision Research. 2004;44:727–749. doi: 10.1016/j.visres.2003.09.038. [DOI] [PubMed] [Google Scholar]
- Fraser J. A New Visual Illusion of Direction. British Journal of Psychology. 1908;2:307–320. [Google Scholar]
- Gregory R L. Heard P. Border locking and the Café Wall illusion. Perception. 1979;8:365–365. doi: 10.1068/p080365. [DOI] [PubMed] [Google Scholar]
- Janković D. Cross-modal nature of evaluative meaning. In: Galmonte A, editor; Actis-Grosso R, editor. Different Psychological Perspectives on Cognitive Processes: Current Research Trends in Alps-Adria Rregion. Cambridge, UK: Cambridge Scholars Publishing; in press. [Google Scholar]
- Kanizsa G. Margini quasi-percettivi in campi con stimolazioneomogenea. Rivistadi Psicologia. 1955;49:7–30. (Also published as “Quasi-perceptual margins in homogeneously stimulated fields”, trans. W Gerbino, The perception of Illusory Contours, Eds S Petry, G E Meyer (New York, Berlin: Springer Verlag, 1987) pp 40–49. [Google Scholar]
- Kanizsa G. Subjective contours. Scientific American. 1976;23:44–44. doi: 10.1038/scientificamerican0476-48. [DOI] [PubMed] [Google Scholar]
- Kanizsa G. Organization in Vision. New York: Praeger; 1979. [Google Scholar]
- Kersten D J. Mamassian P. Knill D. Moving cast shadows generate illusory object trajectories. Investigative Ophthalmology and Visual Science. 1991;32:1179–1179. [Google Scholar]
- Kitaoka A. Sound wave illusion. 1996. Personal Communication, http://www.psy.ritsumei.ac.jp/akitaoka/classic9e.html.
- Kitaoka A. Trick Eyes Graphics. Tokyo, Japan: Kanzen; 2005. [Google Scholar]
- Kitaoka A. Optimized Fraser-Wilcox illusions: A pictorial classification by Akiyoshi Kitaoka. 2008a. Talk in a workshop (WS005) in the 72nd Annual Convention of the Japanese Psychological Association, http://www.psy.ritsumei.ac.jp/∼akitaoka/nisshin2008ws.html.
- Kitaoka A. Trick Eye Mechanism. Tokyo, Japan: Kanzen; 2008b. [Google Scholar]
- Kitaoka A. Ashida H. Phenomenal characteristics of the peripheral drift illusion. Journal of the Vision Society of Japan. 2003;15:261–262. [Google Scholar]
- Kuriki I. Ashida H. Murakami I. Kitaoka A. Functional brain imaging of the Rotating Snakes illusion by fMRI. Journal of Vision. 2008;8:10–10. doi: 10.1167/8.10.16. [DOI] [PubMed] [Google Scholar]
- Libby W L. Lacey B C. Lacey J I. Pupilary and cardiatic activity during visual attention. Psychophysiology. 1973;10:270–294. doi: 10.1111/j.1469-8986.1973.tb00526.x. [DOI] [PubMed] [Google Scholar]
- Loewenstein G. The psychology of curiosity a review and reinterpretation. Psychological Bulletin. 1994;116:75–98. doi: 10.1037/0033-2909.116.1.75. [DOI] [Google Scholar]
- Luckiesh M. Visual Illusions. New York: Dover; 1922. [Google Scholar]
- Marković S. Janković D. Implicit and explicit features of visual Gestalten. 2001. Perception 30 ECVP Abstract Supplement.
- Marković S. Aesthetic experience and emotional content of paintings. Psihologija. 2010;43:47–65. doi: 10.2298/PSI1001047M. [DOI] [Google Scholar]
- Marković S. Radonjić A. Implicit and explicit features of paintings. Spatial Vision. 2008;21:229–259. doi: 10.1163/156856808784532563. [DOI] [PubMed] [Google Scholar]
- Martindale C. Moore K. Priming, prototypicality and preference. Journal of Experimental Psychology: Human Perception and Performance. 1988;14:661–670. doi: 10.1037/0096-1523.14.4.661. [DOI] [Google Scholar]
- Meng X. Rosenthal R. Rubin D B. Comparing correlated correlation coefficients. Psychological Bulletin. 1992;111:172–175. doi: 10.1037/0033-2909.111.1.172. [DOI] [Google Scholar]
- Moles A. Information Theory and Esthetic Perception. Urbana, Illinois: University of Illinois Press; 1968. [Google Scholar]
- Nadal M. Munar E. Capo M A. Rossello J. Cela-Conde C J. Towards a framework for the study of the neural correlates of aesthetic preference. Spatial Vision. 2008;21:379–396. doi: 10.1163/156856808784532653. [DOI] [PubMed] [Google Scholar]
- Necker L A. Observations on some remarkable optical phenomena seen in Switzerland; and on an optical phenomenon which occurs on viewing a figure of a crystal or geometrical solid. London and Edinburgh Philosophical Magazine and Journal of Science. 1832;1:329–337. [Google Scholar]
- Noguchi K. The relationship between visual illusion and aesthetic preference-An attempt to unify experimental phenomenology and empirical aesthetics. Axiomathes. 2003;13:261–281. doi: 10.1023/B:AXIO.0000007184.98668.bc. [DOI] [Google Scholar]
- Nunnally J C. Psychometric Theory. New Delhi: TataMcGraw-Hill; 1981. [Google Scholar]
- Oliva A. The Marylin Einstein hybrid image. 2007. New Scientist Magazine March 31st issue.
- Oliva A. Torralba A. Schyns P G. Hybrid Images. ACM Transactions on Graphics. 2006;25:527–532. doi: 10.1145/1141911.1141919. [DOI] [Google Scholar]
- Osgood C. May W. Miron M. Cross-cultural Universals of Affective Meaning. Urbana, Illinois: University of Illinois Press; 1975. [Google Scholar]
- Osgood C. Succi G J. Tannenbaum P. The Measurement of Meaning. Urbana, Illinois: University of Illinois Press; 1957. [Google Scholar]
- Penrose L S. Penrose R. Impossible objects: A special type of visual illusion. British Journal of Psychology. 1958;49:31–33. doi: 10.1111/j.2044-8295.1958.tb00634.x. [DOI] [PubMed] [Google Scholar]
- Pinna B. Art as a scientific object: toward a visual science of art. Spatial Vision. 2007;20:493–508. doi: 10.1163/156856807782758386. [DOI] [PubMed] [Google Scholar]
- Pinna B. Brelstaff G J. A new visual illusion of relative motion. Vision Research. 2000;40:2091–2096. doi: 10.1016/S0042-6989(00)00072-9. [DOI] [PubMed] [Google Scholar]
- Purves D. Shimpi A. Lotto R B. An Empirical Explanation of the Cornsweet Effect. The Journal of Neuroscience. 1999;19:8542–8551. doi: 10.1523/JNEUROSCI.19-19-08542.1999. [DOI] [PMC free article] [PubMed] [Google Scholar]
- Reber R. Schwarz N. Winkielman P. Processing fluency and aesthetic pleasure: Is beauty in the perceiver's processing experience? 2004. pp. 8364–382. Personality and Social Psychology Review. [DOI] [PubMed]
- Russell P A. Effort after meaning and the hedonic value of Paintings. British Journal of Psychology. 2003;94:99–110. doi: 10.1348/000712603762842138. [DOI] [PubMed] [Google Scholar]
- Russell P A. Milne S. Meaningfulness and the hedonic value of paintings: Effects of titles. Empirical Studies of the Arts. 1997;15:61–73. [Google Scholar]
- Shepard N R. Barker D. Figure-ground reversible objects Angel Columns. http://www.psy.ritsumei.ac.jp/akitaoka/illnews14e.html.
- Shiffrar M. Pavel M. Percepts of rigid motion within and across apertures. Journal of Experimental Psychology: Human Perception and Performance. 1991;17:749–761. doi: 10.1037/0096-1523.17.3.749. [DOI] [PubMed] [Google Scholar]
- Silvia P. Emotional responses to art: From collation and arousal to cognition and emotion. Review of General Psychology. 2005;9:4–4. doi: 10.1037/1089-2680.9.4.342. [DOI] [Google Scholar]
- Silvia P J. What is interesting? Exploring the appraisal structure of interest. Emotion. 2005b;5:89–102. doi: 10.1037/1528-3542.5.1.89. [DOI] [PubMed] [Google Scholar]
- Silvia P J. Exploring the Psychology of Interest. New York: Oxford University Press; 2006. [DOI] [Google Scholar]
- Tucker W T. Experiments in Aesthetic Communications. 1955. (Unpublished doctoral dissertation, University of Illinois) [Google Scholar]
- Van de Cruys S. Wagemans J. “Putting reward in art: A tentative prediction error account of visual art”. i-Perception. 2011;3:1035–1062. doi: 10.1068/i0466aap. [DOI] [PMC free article] [PubMed] [Google Scholar]
- Vessel E A. Rubin N. Beauty and the beholder: Highly individual taste for abstract, but not real-world images. Journal of Vision. 2010;10:1–14. doi: 10.1167/10.2.18. [DOI] [PMC free article] [PubMed] [Google Scholar]
- Wade N J. Perception and Illusion: Historical Perspectives. New York: Springer; 2005. [Google Scholar]
- Wagemans J. Towards a new kind of experimental psycho-aesthetics? Reflections on the Parallellepipeda project. i-Perception. 2011;2:648–678. doi: 10.1068/i0464aap. [DOI] [PMC free article] [PubMed] [Google Scholar]
- Winkielman P. Schwarz N. Fazendeiro T. Reber R. The hedonic marking of processing fluency: Implications for evaluative judgment. In: Musch J, editor; Klauer K C, editor. The Psychology of Evaluation: Affective Processes in Cognition and Emotion. Mahwah, NJ: Lawrence Erlbaum Associates; 2003. pp. 189–217. [Google Scholar]
- Yoshino D. Kimura A. Noguchi K. Visual Illusion and Aesthetic Preference Some Common Stimulus Properties. Gestalt Theory. 2009;31:29–42. [Google Scholar]
- Zeki S. Neural concept formation and art: Dante, Michelangelo, Wagner. Journal of Consciousness Studies. 2002;9:53–76. [Google Scholar]


