

Abstract
Agrochemicals, fecal indicator bacteria (FIB), and pathogens frequently contaminate water simultaneously. No significant direct effects of fertilizer, atrazine, malathion, and chlorothalonil on the survival of Escherichia coli, Enterococcus faecalis, Salmonella enterica, human polyomaviruses, and adenovirus were detected, supporting the assertion that previously observed effects of agrochemicals on FIB were indirect.
TEXT
Many endemic and emerging zoonotic pathogens, such as Escherichia coli strains, Salmonella enterica, Cryptosporidium spp., Giardia spp., and zoonotic influenza viruses (15, 26, 30, 31), can be of agricultural origin and shed in the feces of livestock (1, 2, 9). Many of these pathogens are waterborne and are, therefore, capable of entering water bodies via storm water and agricultural runoff as well as via subsurface transport. Testing directly for each pathogen in feces-impacted water bodies would be prohibitively costly and time-consuming. Consequently, regulatory standards have relied on the quantification of fecal indicator bacteria (FIB) for water quality assessment (27). The ability of FIB to predict human health risks has been supported by epidemiological studies (3, 8, 11, 33, 34).
The association between FIB levels and the risk of pathogens in recreational waters may be impeded by agricultural practices. In addition to fecal contamination, agricultural runoff is likely to contribute agrochemicals (i.e., fertilizers and pesticides), which have wide-ranging effects on ecosystems (4, 5, 7, 16, 20–22). However, the effects of agrochemicals on the fate of pathogen and FIB populations have received little attention (7). Agrochemicals may have adverse or beneficial effects on bacteria through direct mechanisms, such as through direct toxicity or by directly providing nutrients, or through indirect mechanisms, such as by altering predator-prey dynamics or biotic food sources. Further, FIB and waterborne pathogens may have similar or diverging responses to agrochemicals, potentially disconnecting the FIB-pathogen relationship.
Here, the direct effects of inorganic fertilizer, atrazine (herbicide), malathion (insecticide), and chlorothalonil (fungicide) on the concentrations of FIB (E. coli ATCC 9637 and Enterococcus faecalis ATCC 19433), zoonotic bacterial pathogens (E. coli O157:H7 EDL 933 and S. enterica serovar Typhimurium CBD777), and viruses (human polyomavirus [HPyV] BK and adenovirus type 2 [ATCC VR-846]) were investigated. Factors that can lead to indirect effects on survival, such as phytoplankton shading, competition from native bacteria, and predation by protozoa, were intentionally excluded from this study because the focus was strictly on direct effects. To isolate direct effects, two experiments, one in the dark and one exposed to light, were conducted using simplified microcosms that contained only autoclaved deionized water, disinfected sediments, and an agrochemical treatment (see the supplemental material for details). The use of sterilized water and disinfected sediment excluded algal and biofilm communities which may have resulted in indirect agrochemical effects seen previously in microcosms exposed to sunlight (24, 25).
In the first experiment, microcosms were treated with atrazine, malathion, chlorothalonil, or inorganic fertilizer singularly at the estimated environmental concentration (EEC; 102 μg/liter for atrazine, 101 μg/liter for malathion, 170 μg/liter for chlorothalonil, and 4,400 μg/liter N and 440 μg/liter P for fertilizer) or with one of all the possible pairwise combinations. Solvent and water controls were also included, resulting in 12 treatments. These agrochemicals were chosen because, in the United States, they are among the top two in usage for their agrochemical class (13). Every microcosm received all six of the focal microbial taxa (4 bacteria and 2 viruses) (see the supplemental material for details). Microcosms were covered to prevent light penetration, and the microbes were enumerated in both the water and sediment immediately before agrochemical application (T0) and 24 h (T24) and 1 week (T168) after agrochemical applications. The bacteria were quantified using both culture-dependent methods and quantitative PCR (qPCR), whereas the viruses were quantified using only qPCR (see the supplemental methods and Table S1 in the supplemental material).
In the environment, agrochemicals are also subject to photolytic degradation, resulting in intermediate compounds which may impact organisms differently than parent compounds (5, 6, 32). To examine the potential effect of photolysis-derived intermediates as well as parent compounds, the second experiment used the same microcosm setup as the first experiment except that the microcosms were exposed to natural light. There were other minor differences from the first experiment. For instance, treatments for this experiment consisted only of a singular agrochemical treatment at the EEC. Also, due to logistical constraints and the lack of observed significant effects in the dark microcosms (see below), viruses were excluded from this experiment and the four inoculated bacteria were enumerated only via culturable membrane filtration methods (14, 19, 28, 29). Further, previous research has indicated that viruses are significantly less susceptible to UV radiation than bacteria; therefore, it was not expected that the virus concentrations would be significantly different in the light microcosms (12).
Concentrations of target microbes were log transformed for all analyses. Repeated-measures statistical analysis was used to assess changes in bacterial concentrations over the 1-week experiment while taking into account the nonindependence of sampling the same microcosms over multiple time intervals. Specifically, multivariate analysis of variance (MANOVA), in which the repeated-measures factor was the microbial concentration on each of the three sampling intervals (T0, T24, and T168), was employed. In these analyses, interactions between among- and within-microcosm (repeated-measures) factors were always included, allowing for analysis of treatment-by-time interactions. In all MANOVAs, the response variables were the concentrations of the six (experiment 1) or four (experiment 2) microorganisms. Water and sediment were sampled and analyzed separately. Culturable and qPCR concentrations were also analyzed separately (see Table S2 in the supplemental material), but these responses were significantly correlated in general and were consistent with previously observed correlations (10, 17). Statistical analyses in which the response variables were the differences between the initial concentration and the T24 and T168 concentrations divided by the number of days which had passed (decay rates) (Table 1) were also conducted. Further, T90 (the amount of time required for a bacterial concentration to decrease by 90%) was calculated for the enterococci. No significant difference in T90 was observed among treatments in either experiment; therefore, the values were averaged among all agrochemical treatments. The average T90 for enterococci was ∼21 h in the water columns of the dark microcosms and ∼9 h in the light microcosm experiments. No other target microbe experienced a log decline throughout either experiment, likely as a result of the absence of predation and competition (Table 1).
Table 1.
T90 values and decay rates for all targets, averaged among all agrochemical treatmentsa
| Microcosm, target, and matrix | Decay rate (change in concn/no. of days) |
T90 (h)b | |
|---|---|---|---|
| T0 to T24 | T0 to T168 | ||
| Dark microcosm | |||
| E. coli | |||
| Water | −0.16 (1.1) | 0.11 (1.7) | NA |
| Sediment | −0.51 (1) | −0.07 (1.2) | NA |
| Enterococci | |||
| Water | 0.87 (0.6) | 0.58 (0.9) | 21 |
| Sediment | 0.02 (0.7) | 0.19 (1.4) | NA |
| E. coli O157:H7 | |||
| Water | −0.39 (0.8) | 0.03 (1) | NA |
| Sediment | −0.61 (0.7) | −0.09 (1) | NA |
| S. enterica | |||
| Water | 0.24 (1.8) | 0.33 (2.3) | NA |
| Sediment | −0.19 (1) | 0.09 (1.8) | NA |
| HPyV | |||
| Water | −0.12 (0.3) | 0.15 (0.4) | NA |
| Sediment | −0.15 (0.2) | 0.00 (0.2) | NA |
| Adenovirus | |||
| Water | −0.03 (0.2) | 0.09 (0.4) | NA |
| Sediment | 0.08 (0.1) | 0.01 (0.1) | NA |
| Light microcosm | |||
| E. coli | |||
| Water | −0.02 (0.4) | −0.50 (0.7) | NA |
| Sediment | −0.28 (0.9) | −1.59 (0.8) | NA |
| Enterococci | |||
| Water | 2.98 (1.6) | 5.05 (1) | 9 |
| Sediment | 0.30 (0.9) | 1.34 (1.9) | NA |
| E. coli O157:H7 | |||
| Water | −0.84 (1.9) | −1.24 (1.7) | NA |
| Sediment | −0.91 (1.5) | −1.93 (1.8) | NA |
| S. enterica | |||
| Water | −1.26 (3.4) | 0.64 (5.3) | NA |
| Sediment | −1.36 (3.1) | −1.00 (4) | NA |
Data are presented for both matrices in both dark and light microcosms. Values in parentheses are standard deviations.
NA, not applicable.
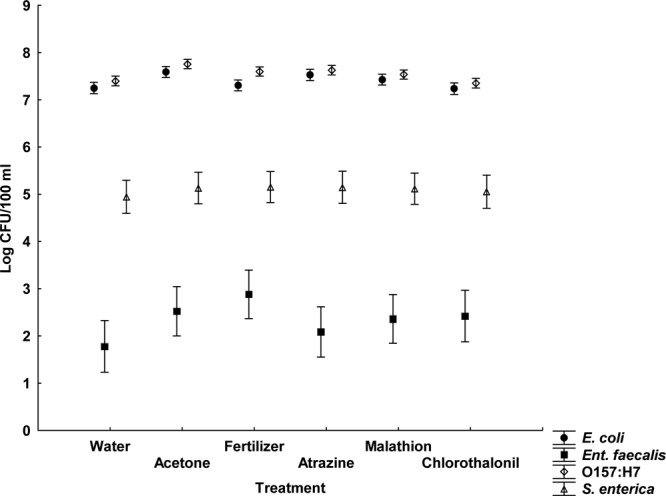
None of the agrochemicals significantly affected microbial concentrations at any of the time periods, regardless of whether the response variables used were the concentrations or the decay rates (Fig. 1 and 2 and Table 1). Furthermore, these results were consistent across quantification methods (culture or qPCR), sample location (water or sediment), and dark or light exposure (see Tables S3 and S4 in the supplemental material). Notably, in both dark and light microcosms, E. coli and E. coli O157:H7 exhibited greater survival than E. faecalis and S. enterica (Fig. 3 and 4). Based upon decay rates, the survival rates of adenovirus and HPyV genetic material were so similar that the data overlay one another precisely on the graph (Fig. 3). Viral survival more closely resembled that of the E. coli strains than that of E. faecalis and S. enterica (Fig. 3). t tests revealed significantly higher bacterial concentrations (P = 0.007) in dark microcosms than in light microcosms. As the deleterious effects of sunlight on bacterial survival have been well documented, this result is not surprising (18, 23).
Fig 1.

Average concentrations for E. coli (A), E. faecalis (B), E. coli O157:H7 (C), and S. enterica (D) for all agrochemical treatments in the water column of the dark microcosms (least-squares means ± the standard error [SE]; n = 4). This figure shows data from a repeated-measures analysis.
Fig 2.
Average bacterial concentrations for all agrochemical treatments in the water column of the light microcosms (least-squares means ± the SE; n = 4). This figure shows data from a repeated-measures analysis.
Fig 3.

Concentrations of target microbes in the dark microcosms, averaged for all agrochemical treatments (± the standard deviation [SD]). (A) Culturable concentrations of target bacteria in the water column. (B) Culturable concentrations of target bacteria in the sediments. (C) Concentrations of viruses in both matrices measured by qPCR.
Fig 4.

Concentrations of target bacteria in the light microcosms in the water column (A) and sediments (B), averaged for all agrochemical treatments (± the SD).
Previous experiments found no significant direct effects of agrochemicals on FIB survival (25); however, the present experiments expand on this conclusion and demonstrate that there are no significant direct effects of agrochemicals on some bacterial pathogens and viruses as well. Furthermore, actively replicating bacterial cultures exposed to agrochemicals (E. coli, E. coli O157:H7, E. faecalis, or S. enterica) (see the supplemental material) showed no significant difference in growth rates, and thus, there was no evidence that these agrochemicals either facilitated or hindered the growth of these organisms (see the supplemental methods and Table S5 in the supplemental material). In previous research, atrazine was found to significantly affect E. coli concentrations in microcosms exposed to light. However, in this previous work, pond water was used and algal and biofilm communities were allowed to establish, while in the present work, we excluded algal and biofilm communities. These results suggest that exposure to light alone does not result in agrochemical effects on microbial survival and that the previously observed effects on E. coli levels were more likely the result of an indirect effect of atrazine on the phytoplankton and biofilm communities (25). While our present study indicates that these agrochemicals have no direct impact on the tested bacterial pathogens and viruses, a limited suite of pathogens is included here. Furthermore, the indirect effect of agrochemicals on pathogens has not been tested thoroughly. Further studies are essential to understanding the impact of agricultural practices on potential human health risks and the relationship between FIB and the various waterborne pathogens that can impact human health.
Supplementary Material
ACKNOWLEDGMENTS
We thank Laurie Walker, Gordon Fox, and the USF Botanical Gardens for greenhouse space and logistical support. We also thank Kennon Hydock and Diana Contreras for their assistance on this project. Finally, we thank James T. Riordan for providing E. coli O157:H7 EDL933 and the USF Center for Biological Defense for providing S. enterica serovar Typhimurium CDB777.
Funding was provided by USDA-NIFA Water and Watershed program grant 2009-35102-05043.
Footnotes
Published ahead of print 7 September 2012
Supplemental material for this article may be found at http://aem.asm.org/.
REFERENCES
- 1. Berry ED, et al. 2007. Incidence and persistence of zoonotic bacterial and protozoan pathogens in a beef cattle feedlot runoff control vegetative treatment system. J. Environ. Qual. 36:1873–1882 [DOI] [PubMed] [Google Scholar]
- 2. Brooks JP, Adeli A, Read JJ, McLaughlin MR. 2009. Rainfall simulation in greenhouse microcosms to assess bacterial-associated runoff from land-applied poultry litter. J. Environ. Qual. 38:218–229 [DOI] [PubMed] [Google Scholar]
- 3. Cabelli VJ, Dufour AP, Levin MA, McCabe LJ, Haberman PW. 1979. Relationship of microbial indicators to health effects at marine bathing beaches. Am. J. Public Health 69:690–696 [DOI] [PMC free article] [PubMed] [Google Scholar]
- 4. Clements WH, Rohr JR. 2009. Community responses to contaminants: using basic ecological principles to predict ecotoxicological effects. Environ. Toxicol. Chem. 28:1789–1800 [DOI] [PubMed] [Google Scholar]
- 5. DeLorenzo ME, Scott GI, Ross PE. 2001. Toxicity of pesticides to aquatic microorganisms: a review. Environ. Toxicol. Chem. 20:84–98 [DOI] [PubMed] [Google Scholar]
- 6. de Souza ML, et al. 1998. Molecular basis of a bacterial consortium: interspecies catabolism of atrazine. Appl. Environ. Microbiol. 64:178–184 [DOI] [PMC free article] [PubMed] [Google Scholar]
- 7. Downing HF, et al. 2004. Effects of the agricultural pesticides atrazine, chlorothalonil, and endosulfan on south Florida microbial assemblages. Ecotoxicology 13:245–260 [DOI] [PubMed] [Google Scholar]
- 8. Dufour AP. 1984. Health effects criteria for fresh recreational waters. EPA-600/1-84-004. US Environmental Protection Agency, Washington, DC [Google Scholar]
- 9. Fratamico PM, Bagi LK, Bush EJ, Solow BT. 2004. Prevalence and characterization of Shiga toxin-producing Escherichia coli in swine feces recovered in the National Animal Health Monitoring System's Swine 2000 study. Appl. Environ. Microbiol. 70:7173–7178 [DOI] [PMC free article] [PubMed] [Google Scholar]
- 10. Harwood VJ, Gordon KV, Staley C. 2011. Validation of rapid methods for enumeration of markers for human sewage contamination in recreational waters. WERF report PATH3C09. Water Environment Research Foundation, Alexandria, VA [Google Scholar]
- 11. Heaney CD, et al. 2009. Contact with beach sand among beachgoers and risk of illness. Am. J. Epidemiol. 170:164–172 [DOI] [PubMed] [Google Scholar]
- 12. Hijnen WA, Beerendonk EF, Medema GJ. 2006. Inactivation credit of UV radiation for viruses, bacteria, protozoan (oo)cysts in water: a review. Water Res. 40:3–22 [DOI] [PubMed] [Google Scholar]
- 13. Kiely T, Donaldson D, Grube A. 2004. Pesticide industry sales and usage: 2000 and 2001 market estimates. U.S. Environmental Protection Agency, Washington D. C [Google Scholar]
- 14. Kornacki JL, Gurtler JB, Yan Z, Cooper CM. 2003. Evaluation of several modifications of an ecometric technique for assessment of media performance. J. Food Prot. 66:1727–1732 [DOI] [PubMed] [Google Scholar]
- 15. Lebbad M, et al. 2010. From mouse to moose: multilocus genotyping of Giardia isolates from various animal species. Vet. Parasitol. 168:231–239 [DOI] [PubMed] [Google Scholar]
- 16. McMahon TA, et al. 2011. The fungicide chlorothalonil is nonlinearly associated with corticosterone levels, immunity, and mortality in amphibians. Environ. Health Perspect. 119:1098–1103 [DOI] [PMC free article] [PubMed] [Google Scholar]
- 17. Noble RT, Blackwood AD, Griffith JF, McGee CD, Weisberg SB. 2010. Comparison of rapid quantitative PCR-based and conventional culture-based methods for enumeration of Enterococcus spp. and Escherichia coli in recreational waters. Appl. Environ. Microbiol. 76:7437–7443 [DOI] [PMC free article] [PubMed] [Google Scholar]
- 18. Noble RT, Lee IM, Schiff KC. 2004. Inactivation of indicator micro-organisms from various sources of faecal contamination in seawater and freshwater. J. Appl. Microbiol. 96:464–472 [DOI] [PubMed] [Google Scholar]
- 19. Novicki TJ, Daly JA, Mottice SL, Carroll KC. 2000. Comparison of sorbitol MacConkey agar and a two-step method which utilizes enzyme-linked immunosorbent assay toxin testing and a chromogenic agar to detect and isolate enterohemorrhagic Escherichia coli. J. Clin. Microbiol. 38:547–551 [DOI] [PMC free article] [PubMed] [Google Scholar]
- 20. Rohr JR, Crumrine PW. 2005. Effects of an herbicide and an insecticide on pond community structure and processes. Ecol. Appl. 15:1135–1147 [Google Scholar]
- 21. Rohr JR, McCoy KA. 2010. A qualitative meta-analysis reveals consistent effects of atrazine on freshwater fish and amphibians. Environ. Health Perspect. 118:20–32 [DOI] [PMC free article] [PubMed] [Google Scholar]
- 22. Rohr JR, Raffel TR, Sessions SK, Hudson PJ. 2008. Understanding the net effects of pesticides on amphibian trematode infections. Ecol. Appl. 18:1743–1753 [DOI] [PubMed] [Google Scholar]
- 23. Sinton LW, Hall CH, Lynch PA, Davies-Colley RJ. 2002. Sunlight inactivation of fecal indicator bacteria and bacteriophages from waste stabilization pond effluent in fresh and saline waters. Appl. Environ. Microbiol. 68:1122–1131 [DOI] [PMC free article] [PubMed] [Google Scholar]
- 24. Staley ZR, Rohr JR, Harwood VJ. 2010. The effect of agrochemicals on indicator bacteria densities in outdoor mesocosms. Environ. Microbiol. 12:3150–3158 [DOI] [PubMed] [Google Scholar]
- 25. Staley ZR, Rohr JR, Harwood VJ. 2011. A test of direct and indirect effects of agrochemicals on the survival of fecal indicator bacteria. Appl. Environ. Microbiol. 77:8765–8774 [DOI] [PMC free article] [PubMed] [Google Scholar]
- 26.US Environmental Protection Agency 2005. Detecting and mitigating the environmental impact of fecal pathogens originating from confined animal feeding operations. Rev. EPA-600/R-06/021. US Environmental Protection Agency, Washington, DC [Google Scholar]
- 27.US Environmental Protection Agency 2004. Implementation guidance for ambient water quality criteria for bacteria. EPA-823-B-04-002. US Environmental Protection Agency, Washington, DC [Google Scholar]
- 28.US Environmental Protection Agency 2002. Method 1600: enterococci in water by membrane filtration using membrane-enterococcus indoxy-B-d-glucoside agar (mEI). EPA-821-R-02-022. US Environmental Protection Agency, Washington, DC [Google Scholar]
- 29.US Environmental Protection Agency 2002. Method 1603: Escherichia coli (E. coli) in water by membrane filtration using modified membrane-thermotolerant Escherichia coli agar (modified mTEC). EPA 821-R-02-023. US Environmental Protection Agency, Washington, DC [Google Scholar]
- 30.US Environmental Protection Agency 2009. Review of published studies to characterize relative risks from different sources of fecal contamination in recreational water. EPA 822-R-09-001. US Environmental Protection Agency, Washington, DC [Google Scholar]
- 31.US Environmental Protection Agency 2009. Review of zoonotic pathogens in ambient waters. EPA 822-R-09-002. US Environmental Protection Agency, Washington, DC [Google Scholar]
- 32. Wackett LP, Sadowsky MJ, Martinez B, Shapir N. 2002. Biodegradation of atrazine and related s-triazine compounds: from enzymes to field studies. Appl. Microbiol. Biotechnol. 58:39–45 [DOI] [PubMed] [Google Scholar]
- 33. Wade TJ, et al. 2008. High sensitivity of children to swimming-associated gastrointestinal illness: results using a rapid assay of recreational water quality. Epidemiology 19:375–383 [DOI] [PubMed] [Google Scholar]
- 34. Wade TJ, et al. 2006. Rapidly measured indicators of recreational water quality are predictive of swimming-associated gastrointestinal illness. Environ. Health Perspect. 114:24–28 [DOI] [PMC free article] [PubMed] [Google Scholar]
Associated Data
This section collects any data citations, data availability statements, or supplementary materials included in this article.