

Abstract
Poly(3-hydroxybutyrate) (PHB) production and mobilization in Ralstonia eutropha are well studied, but in only a few instances has PHB production been explored in relation to other cellular processes. We examined the global gene expression of wild-type R. eutropha throughout the PHB cycle: growth on fructose, PHB production using fructose following ammonium depletion, and PHB utilization in the absence of exogenous carbon after ammonium was resupplied. Our results confirm or lend support to previously reported results regarding the expression of PHB-related genes and enzymes. Additionally, genes for many different cellular processes, such as DNA replication, cell division, and translation, are selectively repressed during PHB production. In contrast, the expression levels of genes under the control of the alternative sigma factor σ54 increase sharply during PHB production and are repressed again during PHB utilization. Global gene regulation during PHB production is strongly reminiscent of the gene expression pattern observed during the stringent response in other species. Furthermore, a ppGpp synthase deletion mutant did not show an accumulation of PHB, and the chemical induction of the stringent response with dl-norvaline caused an increased accumulation of PHB in the presence of ammonium. These results indicate that the stringent response is required for PHB accumulation in R. eutropha, helping to elucidate a thus-far-unknown physiological basis for this process.
INTRODUCTION
Many organisms have been reported to accumulate storage compounds when they encounter nutrient stress (10). One of the best-studied examples of such a storage compound is poly(3-hydroxybutyrate) (PHB). The accumulation of PHB has been observed for a wide range of organisms and under a wide range of stress conditions (2, 47). PHB accumulation has been intensively studied for both its industrial potential and its role in survival against environmental stress (36, 49, 59). PHB accumulation is regulated, in part, by PhaR, which represses the transcription of the phasin gene instrumental for PHB granule formation, phaP1 (42, 73). When PHB begins to accumulate in the cell, PhaR binds to the polymer instead of its DNA binding site, thus removing the repression of phaP1 expression (32, 71). A high level of expression of phaP1 subsequently results in the proper formation of PHB granules, coated predominantly by PhaP1, PhaR, the PHB synthase PhaC1, and the PHB depolymerase PhaZ1 (24, 48). Although this process is well studied, it is unclear thus far what governs the threshold accumulation to set this regulatory network in motion.
One possibility is that the initiation of PHB accumulation occurs as a result of the stringent response. This process is a mechanism that provides protection against nutrient stress in a wide range of organisms (for recent reviews, see references 33 and 41). The stringent response is governed by the nucleotide guanosine tetraphosphate (ppGpp), which destabilizes the RNA polymerase σ70 holoenzyme and thus strongly reduces the transcription levels of genes under the control of σ70 or its homologs in other organisms (22, 33). This inhibition of σ70-controlled genes results in a strong induction of genes under the control of alternative σ factors, such as σ54 (6). Additionally, ppGpp has been shown to directly inhibit translation (28, 60). This process could potentially reduce alternative carbon sinks, thus triggering PHB accumulation.
To determine if the physiological basis for PHB carbon storage could be found in the stringent response, we examined the model organism for polymer accumulation, Ralstonia eutropha H16. R. eutropha H16 is probably the most widely used model organism for the study of PHB accumulation. A large number of scientific works about the PHB production and utilization of R. eutropha (referred to in this work as the “PHB cycle”) have been published, including a number of reviews (47, 48, 58, 59). The genome sequence of R. eutropha H16 has become available in the past decade (40, 52), further establishing it as the organism of choice for the study of PHB accumulation. However, the stringent response in R. eutropha has not been studied previously.
Using the available sequence, genome-wide expression studies were designed to examine global gene expression under different culture conditions, to elucidate the myriad of changes that occur in the cell during the transition from growth to PHB production to PHB utilization. In the case of the R. eutropha PHB cycle, such a study can be validated by the many works in the literature that have closely studied the components of the cycle and can potentially shed new light on the physiology of PHB storage. Although there exists a previously reported analysis of genome wide-expression focusing on PHB production in R. eutropha, that study did not identify a physiological origin for the initial PHB accumulation (37). Furthermore, that study focused only on the comparison of growth to PHB accumulation and neglected the study of gene expression during PHB utilization.
In this study, we used custom-designed R. eutropha microarray chips to compare gene expression levels under three conditions: cell growth (with ammonium as a nitrogen source) in the presence of fructose as the sole carbon source, PHB production (after ammonium has been depleted) in the presence of fructose as the sole carbon source, and the utilization of PHB as the sole carbon source (after ammonium has been resupplied). The emerging global gene expression pattern was further studied through promoter identification of the regulated genes. The physiological origin of the observed global expression changes was studied in more detail by using an R. eutropha strain lacking the relA homolog and by chemically inducing the stringent response using dl-norvaline. The role of the σS gene, rpoS, in the PHB cycle was also examined.
MATERIALS AND METHODS
Bacterial strains and materials.
The bacterial strains and plasmids used in this study are listed in Table 1. All chemicals and commercial reagents were purchased from Sigma-Aldrich (St. Louis, MO), unless otherwise specified. Oligonucleotide primers were purchased from Integrated DNA Technologies (Coralville, IA). Pfu DNA polymerase and other DNA modification enzymes were purchased from New England BioLabs (Ipswich, MA).
Table 1.
Strains and plasmids used in this study
| Strain or plasmid | Genotype or characteristic | Reference |
|---|---|---|
| Strains | ||
| R. eutropha | ||
| H16 | Wild type; Genr | 68 |
| Re2411 | H16 Δ(H16_A1337) (ΔrelA) | This study |
| Re2424 | H16 Δ(H16_A2373) (ΔrpoS) | This study |
| Re2061 | H16 ΔphaCAB | This study |
| E. coli S17-1 | Strain for conjugative transfer of plasmids into R. eutropha | 54 |
| Plasmids | ||
| pJV7 | phaC deletion plasmid; confers kanamycin resistance | 12 |
| pBBR1MCS-2 | Broad-host-range cloning vector; confers kanamycin resistance | 27 |
| pDS1 | spoT2 deletion plasmid; confers kanamycin resistance | This study |
| pCB300 | rpoS deletion plasmid; confers kanamycin resistance | This study |
| pCJB-CAB | phaCAB deletion plasmid; confers kanamycin resistance | This study |
| pASCB1 | pBBR1MCS-2 with R. eutropha rpoS gene inserted into the multiple-cloning site | This study |
Design of custom Ralstonia eutropha H16 microarray chips.
Probe sets representing 6,626 protein-encoding genes and 3 rRNA genes from the R. eutropha H16 genome, as annotated previously by Pohlmann et al. (40), were printed on an 11-μm array (49-5241 format; Affymetrix, Santa Clara, CA), as described previously (9). Custom R. eutropha H16 gene expression microarray chips were constructed according to the quality control guidelines outlined by the manufacturer (Affymetrix), after the submission of design parameters.
Cell growth and total cellular RNA isolation procedure.
Individual colonies of R. eutropha H16 grown on a tryptic soy agar (TSA) plate were inoculated into 5 ml of dextrose-free tryptic soy broth (TSB; Becton Dickinson, Sparks, MD) and grown for 24 h. Cultures for microarray analysis were all performed in triplicate. Aliquots of 0.5 ml of cultures grown overnight were inoculated into 250-ml shake flasks containing 50 ml of minimal medium, modified from protocols described previously (35), containing 0.1% NH4Cl and 2% (wt/vol) fructose. These cultures were grown for 24 h. Cultures grown overnight were inoculated to an initial optical density at 600 nm (OD600) of 0.1 in 250-ml shake flasks containing 50 ml of minimal medium containing 0.05% NH4Cl and 2% (wt/vol) fructose. Cultures were grown for 12 h. Cultures for sampling were inoculated to an initial OD600 of 0.05 in 250-ml shake flasks containing 50 ml of minimal medium with 0.05% NH4Cl and 2% (wt/vol) fructose. All flask cultures were grown at 30°C with agitation (200 rpm). Unless otherwise mentioned, all growth media in this study contained 10 μg/ml gentamicin. For the selection of culture conditions for microarray analysis, we focused on logarithmic growth (when the nitrogen source in the culture was depleted by 50%), PHB production (when nitrogen in the culture was depleted), and PHB utilization (when cells were actively utilizing intracellular PHB stores as a carbon and energy source). The concentration of NH4+ in the growth medium was monitored by using an ammonia assay kit (Sigma-Aldrich), according to the manufacturer's instructions. An aliquot of cells (at an OD600 equivalent of 2.5) was harvested at an NH4+ concentration of approximately 0.025%, and another aliquot of cells (also at an OD600 equivalent of 2.5) was harvested 2 h after the depletion of nitrogen in the medium. For PHB utilization samples, cells were grown in PHB production medium for 48 h, washed, and transferred into PHB utilization medium, which was free of extracellular carbon and contained 0.1% NH4Cl, allowing cells to utilize PHB stores as the main carbon source. The intracellular PHB content was monitored (see below), and after 6 h of incubation, cells were harvested and later used for RNA isolation. All culture aliquots were treated with 2 volumes of RNA Protect reagent (QIAgen, Valencia, CA). Cells were centrifuged at 5,000 rpm, growth medium was removed, and cell pellets were stored at −80°C until RNA extraction.
Cellular RNA isolation, labeling, and hybridization to Affymetrix array chips were performed as described previously (9).
Microarray data analysis.
Microarray data analysis was performed as described previously (9), using Affymetrix GCOS v.1.4 for data extraction and robust multichip average (RMA) analysis (ArrayStar Software, Madison, WI) with quantile normalization for further analysis. The annotation of genes in the final output was performed based on the annotation described previously by Pohlmann et al. (40). Genes of interest with statistically significant changes in expression levels (P < 0.01) were selected for further study. Gene expression values are denoted as the log2 values of actual expression values, similar to what was reported previously (9).
Growth of strains and PHB quantitation.
A relA homolog (see Fig. S1 in the supplemental material) (spoT2; locus tag H16_A1337) was identified in the R. eutropha H16 genome by using the Genome Information Broker (GIB) (19). A deletion mutant strain, denoted Re2411 (Table 1), was constructed according to methods described previously (9), using primer pairs listed in Table S1 in the supplemental material. Four cultures of H16 and Re2411 were grown in 50 ml minimal medium containing 0.1% NH4Cl and 2% fructose for 70 h at 30°C with agitation (200 rpm). Aliquots of cultures (5 ml) were removed at 0, 12, 20, 44, and 69 h for intracellular PHB quantitation.
An rpoS homolog (H16_A2373) was also identified by using GIB (19). A deletion mutant strain, denoted Re2424 (Table 1), was constructed according to methods described previously (9), using primer pairs listed in Table S1 in the supplemental material. An rpoS complementation plasmid, pASCB1 (Table 1), was constructed by inserting the rpoS gene into pBBR1MCS-2, as follows. The R. eutropha rpoS gene was amplified by PCR using primers rpoScompFW and rpoScompFW (see Table S1 in the supplemental material). The PCR product was cut by using SalI and XbaI restriction endonucleases and ligated into SalI/XbaI-cut pBBR1MCS-2. Three cultures each of H16/pBBR1MCS-2, Re2424/pBBR1MCS-2, and Re2424/pASCB1 were grown in 50 ml minimal medium containing 0.1% NH4Cl and 2% fructose for 72 h at 30°C with agitation (200 rpm). Aliquots of cultures (5 ml) were removed at 0, 24, 48, and 72 h for intracellular PHB quantitation. The remaining cultures were washed twice with sterile 0.85% saline solution, and the cells were resuspended in PHB utilization medium containing 0.2% NH4Cl for 72 h at 30°C with agitation (200 rpm). Aliquots of cultures (5 ml) were removed at 0, 24, 48, and 72 h for intracellular PHB quantitation.
For the quantitation of intracellular PHB, 5-ml aliquots of cultures were transferred into preweighed borosilicate glass tubes at various time points during the PHB production cycle. Cells were pelleted, washed with 5 ml of cold water, pelleted again, and dried in vacuo at 80°C. The PHB content and cell dry weight (CDW) were determined from the dried samples according to established methods (7, 26).
Enzyme assays.
Cultures of H16 and Re2411 were grown in 50 ml minimal medium containing 0.1% NH4Cl and 2% fructose for 72 h at 30°C with agitation (200 rpm). Cells were grown for up to 24 h and then pelleted and stored at −80°C. Pellets were thawed on ice and resuspended in 20 mM Tris-HCl buffer (pH 7.5) for PHB synthase and malate dehydrogenase assays, 150 mM 4-(2-hydroxyethyl)-1-piperazinepropanesulfonic acid (EPPS) buffer (pH 8.0) for β-ketothiolase assays, 50 mM KH2PO4 (pH 6.0) for acetoacetyl coenzyme A (CoA) dehydrogenase assays, and 100 mM Tris-HCl (pH 8.0) for citrate synthase assays. One milliliter of suspended cells was placed, along with ∼100 μl 0.1-mm zirconia/silica beads (Biospec Products, Bartlesville, OK), into a 2-ml microcentrifuge tube and sealed. The tubes were loaded onto a FastPrep-24 machine (MP Biomedicals, Solon, OH) and treated twice at 6.0 m/s for 30 s, with a 5-min rest period between treatments. Following lysis, samples were centrifuged for 5 min at 4°C to pellet cell debris. Clarified cell extracts were removed into a clean tube, and enzyme assays were performed.
Discontinuous PHB synthase (PhaC) activity assays were performed, as described previously (15), by using 3-hydroxybutyrate (3HB)-CoA as the substrate. The 3HB-CoA sample was a generous gift from Mimi Cho and JoAnne Stubbe (Department of Chemistry, MIT). Activities in cell extracts were monitored for 5 min for each assay. β-Ketothiolase (PhaA) activity assays were performed as described previously (55). Acetoacetyl-CoA reductase (PhaB) assays were performed as described previously (12, 23). A citrate synthase assay was performed according to methods described previously (18, 56), using acetyl-CoA and oxaloacetate as the substrates. Malate dehydrogenase activity was monitored by monitoring the reduction of NAD+ to NADH during the production of oxaloacetate from malate. The assay mixture was composed of 600 μl 100 mM Tris-HCl (pH 7.6), 100 μl 8 mM MnSO4, 100 μl 5 mM NAD+, and 100 μl 8 mM malic acid. The reaction was started upon the addition of 100 μl cell extract, and the activity was monitored by monitoring the A340 over time. In all cases, 1 U of enzyme activity is the amount of enzyme needed to convert 1 μmol substrate to product per min at 25°C.
Reduced pyridine nucleotide cofactor quantitation.
Intracellular levels of NADH and NADPH were quantified in R. eutropha H16 and Re2411 cells during growth (6-h culture) and nitrogen limitation (24-h culture) in minimal medium containing 0.1% NH4Cl, 2% fructose, and 10 μg/ml gentamicin. A volume of cells equivalent to an OD600 of 5.0 was harvested, centrifuged for 5 min at 2,800 × g, washed in 5 ml of 0.85% saline, and stored at −80°C. Reduced pyridine nucleotides (NADH and NADPH) were extracted from cells according to methods described previously (20). Intracellular NADH concentrations were measured by using an alcohol dehydrogenase assay coupled to the reduction of phenazine ethosulfate (PES) and 3-(4,5-dimethylthiazolyl-2)-2,5-diphenyltetrazolium bromide (MTT), as described previously (20, 66). The substrate was 3% (vol/vol) ethanol. Intracellular NADPH concentrations were measured by coupled assay, with glucose 6-phosphate dehydrogenase coupled to the reduction of PES and MTT, as previously described (20, 74). The substrate was 25 mM glucose 6-phosphate. NADH and NADPH quantitations were performed by comparison with a standard curve for each nucleotide cofactor.
Chemical induction of the stringent response.
Six individual cultures of H16 were grown in 50 ml minimal medium containing 0.1% NH4Cl and 2% fructose at 30°C with agitation (200 rpm). During exponential growth (OD600 ≈ 0.7), 5-ml aliquots of cultures were sampled for CDW determinations and PHB quantitation. After 20 min, another 5-ml sample was taken, and dl-norvaline was added to three cultures of H16 to a final concentration of 0.1% (wt/vol). At the time of addition, 5 ml of the culture was sampled for CDW determination and PHB quantitation. Sampling was repeated every 20 min for 100 min after the addition of dl-norvaline. The PHB content and CDW were determined as described above.
Promoter analysis.
Upstream sequences of strongly regulated genes were retrieved from the GIB and further analyzed by using MEGA 5 (61). Potential σ54 promoters were manually identified based on a consensus sequence reported previously (3). Potential σ70 promoters were identified by using BPROM (Softberry).
Microarray data accession number.
Microarray data discussed in this work have been deposited in the NCBI Gene Expression Omnibus (GEO) (http://www.ncbi.nlm.nih.gov/geo/) and are accessible through GEO series accession number GSE21145.
RESULTS
Gene expression in R. eutropha H16 fructose cultures in the presence or absence of nitrogen.
We have examined global gene expression in R. eutropha H16 in the presence of nitrogen, under conditions of nitrogen depletion, and upon the reintroduction of nitrogen. A total of 2,263 genes exhibited a >2-fold change in expression (P < 0.01) when nitrogen was depleted in fructose cultures. Of these 2,263 genes, roughly half were observed to be upregulated and half were downregulated after nitrogen depletion. The magnitude of this change suggests that major physiological changes occur in R. eutropha upon entrance into PHB production.
Table 2 breaks down these 2,263 genes into functional groups, categorized according to functional categories described previously by Tatusov et al. (62). The transcriptions of several of these groups of genes were shown to be generally repressed during PHB production. The downregulated functional groups include genes involved in nucleotide metabolism (56% downregulated), DNA replication (32.2% downregulated), cell envelope biogenesis (28% downregulated), cell division (50.6% downregulated), and translation (67.6% downregulated) (Table 2). Additionally, cell motility and secretion genes were observed to be generally downregulated (30.6% downregulated) in the absence of nitrogen (Table 2). A previous study showed that R. eutropha stops producing flagella and that the amount of flagellin decreases in cells during nitrogen starvation (45). The fliC gene was also shown to be downregulated in stationary phase in a previously reported R. eutropha gene expression study (37). Our results show that the flagellin gene fliC (H16_B2360) is indeed downregulated, 9.3-fold, during PHB production compared to its expression during growth. Furthermore, genes of the tricarboxylic acid (TCA) cycle were all observed to be downregulated during PHB production (Table 3), although some exhibited more of a decrease in expression than others. These data suggest that there is a change in the flux of acetyl-CoA in the cell when R. eutropha enters the PHB production phase, providing a potential additional level of control for PHB production, since the precursor of PHB is produced using two molecules of acetyl-CoA.
Table 2.
R. eutropha H16 gene expression microarray experiment comparing samples of cells growing in the presence of nitrogen to samples with PHB production (without nitrogen)
| Functional category | Functional groupa | No. (%) of genesb |
|||
|---|---|---|---|---|---|
| Upregulated |
Downregulated |
||||
| 2- to 4-fold | >4-fold | 2- to 4-fold | >4-fold | ||
| Information storage and processing | |||||
| J | Translation, ribosomal structure, and biogenesis | 3 (1.7) | 2 (1.1) | 20 (11.2) | 101 (56.4) |
| K | Transcription | 42 (5.3) | 21 (2.7) | 30 (3.8) | 21 (2.7) |
| L | DNA replication, recombination, and repair | 5 (3.1) | 3 (1.9) | 27 (16.7) | 25 (15.5) |
| Cellular processes | |||||
| D | Cell division and chromosomal partitioning | 1 (3.6) | 1 (3.6) | 10 (36.1) | 4 (14.5) |
| O | Posttranslational modification, protein turnover, chaperones | 9 (5.7) | 25 (15.9) | 24 (15.3) | 24 (15.3) |
| M | Cell envelope biogenesis, outer membrane | 4 (1.7) | 6 (2.6) | 26 (11.2) | 39 (16.8) |
| N | Cell motility and secretion | 8 (4.4) | 6 (3.3) | 23 (12.8) | 32 (17.8) |
| P | Inorganic ion transport and metabolism | 12 (11.7) | 34 (33.2) | 14 (13.7) | 32 (31.3) |
| T | Signal transduction mechanisms | 9 (1.1) | 29 (3.7) | 13 (1.7) | 7 (0.9) |
| Metabolism | |||||
| C | Energy production and conversion | 35 (7.2) | 82 (16.9) | 13 (2.7) | 53 (10.9) |
| G | Carbohydrate metabolism and transport | 13 (8.7) | 57 (38.1) | 16 (10.7) | 26 (17.4) |
| E | Amino acid metabolism and transport | 28 (9.5) | 53 (17.9) | 35 (11.8) | 66 (22.3) |
| F | Nucleotide metabolism and transport | 2 (2.7) | 12 (16.0) | 19 (25.3) | 23 (30.7) |
| H | Coenzyme metabolism | 3 (1.9) | 7 (4.4) | 21 (13.3) | 15 (9.5) |
| I | Lipid metabolism (includes genes in the PHB cycle) | 20 (6.0) | 16 (4.8) | 21 (6.4) | 23 (7.0) |
| Q | Secondary metabolite biosynthesis, transport, and catabolism | 8 (8.2) | 8 (8.2) | 5 (5.1) | 9 (9.2) |
| Uncharacterized or poorly characterized | |||||
| R | General function prediction only | 51 (6.9) | 105 (14.5) | 85 (11.5) | 66 (9.0) |
| S | Function unknown | 121 (6.6) | 266 (14.5) | 87 (4.7) | 101 (5.5) |
| Total | 374 | 733 | 489 | 667 | |
Functional group categories are based on those described previously by Tatusov et al. (62).
Genes in the “upregulated” category underwent an upregulation of expression during PHB production compared to growth using fructose as a carbon source. Genes in the “downregulated” category underwent a downregulation of expression during PHB production compared to growth using fructose as a carbon source. The percentage of genes affected per functional group was based on the number of genes in each group exhibiting significant changes in expression as a percentage of the total number of R. eutropha genes in a given functional group based on data reported previously (40). For all genes represented in this table, the P value was <0.01.
Table 3.
Changes in expression levels of TCA cycle genes during nitrogen depletion in cultures in minimal medium with fructosea
| Gene | Log2 expression level |
|
|---|---|---|
| Fructose growth | PHB production | |
| Citrate synthase | 11.8 | 9.5 |
| Aconitase | 10.8 | 8.7 |
| Isocitrate dehydrogenase | 10.4 | 9.5 |
| α-Ketoglutarate dehydrogenase | ||
| odhA | 11.5 | 11.0 |
| odhB | 10.7 | 10.3 |
| odhL | 11.9 | 9.8 |
| Succinyl-CoA synthetase | ||
| sucC | 12.2 | 8.2 |
| sucD | 11.9 | 6.6 |
| Succinate dehydrogenase | ||
| sdhA | 12.1 | 10.0 |
| sdhB | 12.6 | 10.4 |
| sdhC | 13.1 | 11.0 |
| sdhD | 13.8 | 12.0 |
| Fumarase | 11.2 | 8.8 |
| Malate dehydrogenase | 11.2 | 8.3 |
All P values were <0.01, except for odhB (P value of 0.04).
The expression levels of a large group of genes involved in inorganic ion or carbohydrate transport and metabolism were shown to be increased during nitrogen starvation. The upregulated genes involved in inorganic ion transport and metabolism can be accounted for largely by genes involved in nitrogen uptake and metabolism. For example, an operon encoding potential nitrogen-scavenging transporters and enzymes (locus tags H16_A1075 through H16_A1087) is upregulated by an average of 491-fold during nitrogen starvation. The upregulated genes involved in carbohydrate metabolism were most notably involved in fructose transport and metabolism and, surprisingly, the two cbb operons encoding Calvin cycle enzymes for CO2 fixation.
The pattern of this expression level change is similar to those observed during the stringent response in various other species (11, 14, 34, 63), suggesting a central role for the nucleotide guanosine tetraphosphate (ppGpp) in the regulation of PHB production. As mentioned above, the inhibition of σ70-controlled genes by the action of ppGpp results in a strong induction of genes under the control of alternative σ factors, such as σ54 (6). To further examine this possibility, we have analyzed the upstream sequences of the most strongly regulated genes. σ54 family promoter elements were identified in the upstream sequences of 79 out of 96 genes with a >50-fold increase in the expression level (see Fig. S2 in the supplemental material). In the upstream sequences of the most strongly downregulated genes, the “housekeeping” σ70 family promoter was identified. In agreement with previously reported observations of Escherichia coli (21), a guanine is conserved at the −5 position of rRNA promoters and promoters of the most strongly repressed genes under conditions of nitrogen starvation (data not shown).
Involvement of RelA (SpoT2) in PHB biosynthesis.
To ascertain that the changes in gene expression mentioned above can be attributed to a stringent response, we created a ppGpp synthase (spoT2; locus tag H16_A1337) deletion strain, H16 ΔspoT2, denoted Re2411 (Table 1). Under conditions of nitrogen starvation, Re2411 accumulated no detectable PHB (Fig. 1A), confirming the hypothesis that the stringent response is required for PHB accumulation. To obtain further evidence that the lack of PHB accumulation could be attributed to the lack of a stringent response, dl-norvaline was used to chemically induce a stringent response during exponential growth in R. eutropha H16. Following the addition of dl-norvaline, wild-type R. eutropha cultures accumulated more PHB than an untreated control group (Fig. 1B).
Fig 1.
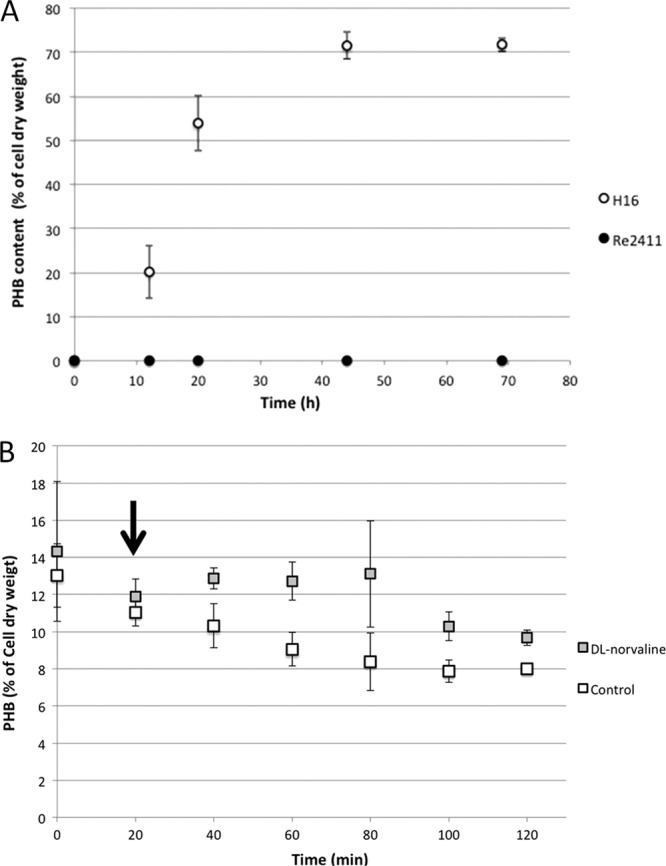
PHB production in R. eutropha H16 in relation to ppGpp accumulation. (A) R. eutropha strain H16 and the ppGpp synthase deletion strain (Re2411) were incubated in minimal medium for 69 h. The intracellular PHB content was assayed as described in Materials and Methods (n = 4). (B) Induction of the stringent response by dl-norvaline and its effect on PHB accumulation during early exponential growth (OD600 ≈ 0.7), while nitrogen was still present in the medium. dl-Norvaline was added (at a time of 20 min; indicated by the arrow) to a final concentration of 0.1% (wt/vol) (n = 3).
It was suggested previously that the expression of PHB production genes (phaCAB) is constitutive throughout the PHB cycle (29). This suggestion was confirmed by our gene expression data (see below). Thus, it is likely that the stringent response in R. eutropha is controlling PHB production at a level other than transcription, such as enzyme activity. To investigate whether SpoT2 (RelA) affects the activities of key PHB biosynthetic enzymes, we examined activities in extracts of the wild-type and spoT2 mutant strains during nitrogen limitation (Table 4). No significant difference in PhaA or PhaC activities was seen for H16 or Re2411, but the spoT2 mutant strain did exhibit a small (<2-fold), but significant, decrease in PhaB activity. It was shown previously that in R. eutropha, both the PhaB1 and PhaB3 enzymes exhibit acetoacetyl-CoA reductase activity in cultures in minimal medium with fructose as the carbon source (12). It is unclear whether one or both PhaB enzymes are responsible for the decrease in activity in strain Re2411. Since TCA cycle genes were shown to be downregulated during PHB production in R. eutropha H16, we examined some TCA cycle enzyme activities in strains H16 and Re2411 to determine if the lack of relA affected the activity, and, thus, the flow of carbon, through the TCA cycle. Table 4 shows that malate dehydrogenase activity was not significantly altered in the presence or absence of an intact RelA enzyme, suggesting that these activities were not modulated by the stringent response. The level of citrate synthase activity, on the other hand, was lower in extracts of strain Re2411 than in those of the wild type, suggesting that the expression or activity of citrate synthase is affected in the relA mutant. Given the reduction in PhaB activity, we hypothesized that this would have an effect on intracellular concentrations of reduced cofactors, both of which were shown previously to be able to act as substrates in acetoacetyl-CoA reductase reactions (12). The quantitation of NADH and NADPH levels in strains H16 and Re2411 revealed an increase in the intracellular NADH concentration in Re2411 cells during nitrogen starvation in minimal medium (24 h). No significant differences in NADPH levels were detected in either strain during growth or nitrogen limitation (Fig. 2). The results shown here suggest a link to RelA activity, PhaB activity, and reduced cofactor levels in R. eutropha cells during PHB production.
Table 4.
Key PHB production and citric acid cycle enzyme activities in extracts of nitrogen-limiteda R. eutropha cellsc
| Strain | Mean enzyme activity (U/mg protein) ± SDb |
||||
|---|---|---|---|---|---|
| PhaA | PhaB | PhaC | MDH | CS | |
| H16 | 25 ± 5 | 26 ± 2 | 68 ± 17 | 5.2 ± 1.5 | 2.5 ± 0.8 |
| Re2411 | 30 ± 6 | 15 ± 4 | 45 ± 25 | 6.0 ± 2.0 | 1.4 ± 0.1 |
Cells were grown in minimal medium containing 0.1 % (wt/vol) NH4Cl and 2% (wt/vol) fructose, as described in Materials and Methods. Nitrogen limitation occurred at 12 to 14 h of culture time. Cells were harvested for enzyme activity determinations 6 to 8 h after the onset of nitrogen limitation.
PhaA, β-ketothiolase; PhaB, acetoacetyl-CoA reductase; PhaC, PHB synthase; MDH, malate dehydrogenase; CS, citrate synthase.
All enzyme activities are defined in U/mg protein. One unit is equivalent to the amount of enzyme needed to convert 1 μmol substrate to product per min at 25°C, except for MDH activity, which is defined as the amount of enzyme needed to convert 1 μmol substrate to product per h at 25°C. All enzyme assays were performed in replicates of three or more.
Fig 2.
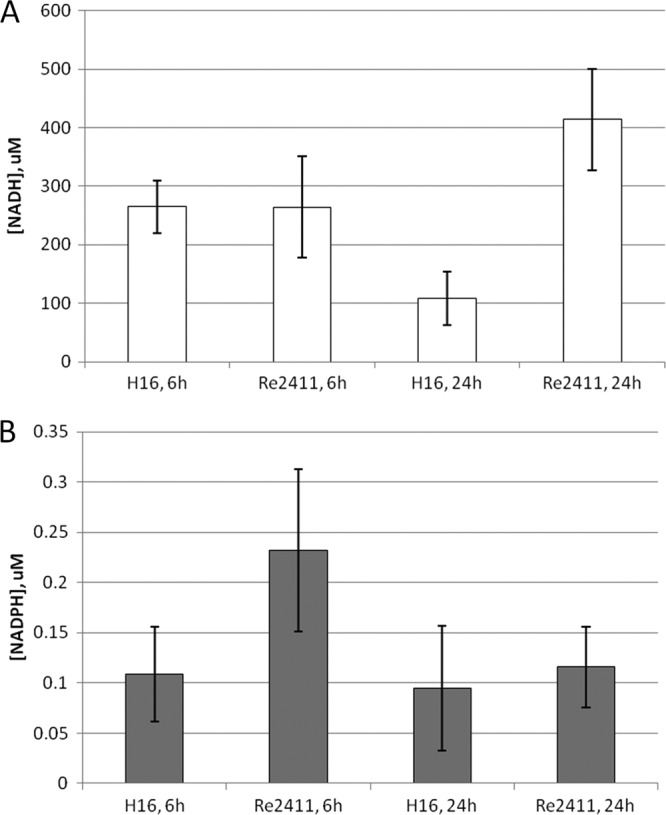
Reduced cofactor quantitation in Ralstonia eutropha wild-type (H16) and spoT2 deletion (Re2411) strains. (A) NADH was quantified in H16 and Re2411 cells during growth (6 h) and nitrogen starvation (24 h). (B) NADPH was quantified in H16 and Re2411 cells during growth (6 h) and nitrogen starvation (24 h). R. eutropha cells were prepared and reduced cofactors were quantified as described in Materials and Methods (n = 3).
It was shown previously that R. eutropha strains incapable of producing PHB will excrete pyruvate and other metabolites under conditions that would otherwise permit the biosynthesis of PHB (57). With carbon being unable to flow into storage polymers during nutrient limitation, it can be reasoned that the cell must do something with this carbon, if conventional storage is not an option. We examined the supernatants of wild-type and mutant R. eutropha cultures and determined that Re2411 also secretes pyruvate into the culture medium, due to the strain's inability to produce PHB (see Fig. S3 in the supplemental material).
R. eutropha H16 gene expression changes during PHB utilization compared to growth on fructose.
Although PHB utilization in R. eutropha has been less well studied than PHB production, several important physiological changes occur when the culture resumes growth (PHB utilization in the presence of nitrogen and in the absence of exogenous carbon). Consistent with previous works in the literature regarding changes in the expression levels of PHB-related genes, such as phaP and phaZ, during the transition from PHB production to PHB utilization (29, 42, 44, 72), our results show that the expression patterns of these genes are linked to and generally follow the production of the intracellular polymer (see below). Furthermore, we observed that the global gene expression pattern returns to that observed during growth on fructose. To study the differences in the physiology of extracellular carbon source utilization versus intracellular carbon source utilization, we have compared gene expression levels during growth and PHB utilization.
Table 5 shows a breakdown of genes exhibiting a change in expression during growth with PHB utilization (cells containing intracellular PHB grown in the presence of no extracellular carbon and abundant nitrogen), compared to growth on fructose. The expression levels of a total of 1,166 genes changed more than 2-fold between growth on fructose and PHB utilization. Of these genes, 745 are repressed during PHB utilization relative to growth on fructose. Table 5 categorizes these genes into functional groups, as described previously by Tatusov et al. (62). A large group of genes repressed (relative to growth on fructose) during PHB utilization were also seen to be repressed during PHB production. These genes are classified mostly within the functional groups cell motility (15% downregulated), amino acid biosynthesis (26.7% downregulated), carbohydrate metabolism (34.1% downregulated), and translation (19.5% downregulated).
Table 5.
R. eutropha H16 gene expression during growth on fructose compared to gene expression during growth on intracellular PHB
| Functional category | Functional groupa | No. (%) of genesb |
|||
|---|---|---|---|---|---|
| Upregulated |
Downregulated |
||||
| 2- to 4-fold | >4-fold | 2- to 4-fold | >4-fold | ||
| Information storage and processing | |||||
| J | Translation, ribosomal structure, and biogenesis | 7 (3.9) | 3 (1.7) | 30 (16.7) | 5 (2.8) |
| K | Transcription | 26 (3.3) | 5 (0.6) | 34 (4.3) | 10 (1.3) |
| L | DNA replication, recombination, and repair | 2 (1.2) | 1 (0.6) | 22 (13.6) | 3 (2.7) |
| Cellular processes | |||||
| D | Cell division and chromosomal partitioning | 1 (3.6) | 0 (0.0) | 6 (21.7) | 1 (3.6) |
| O | Posttranslational modification, protein turnover, chaperones | 8 (5.1) | 3 (1.9) | 11 (7.0) | 5 (3.2) |
| M | Cell envelope biogenesis, outer membrane | 3 (1.3) | 0 (0.0) | 21 (9.0) | 19 (8.2) |
| N | Cell motility and secretion | 3 (1.7) | 2 (1.1) | 18 (10.0) | 9 (5.0) |
| P | Inorganic ion transport and metabolism | 7 (6.8) | 11 (10.7) | 19 (18.6) | 3 (2.9) |
| T | Signal transduction mechanisms | 5 (0.6) | 10 (1.3) | 16 (2.0) | 4 (0.5) |
| Metabolism | |||||
| C | Energy production and conversion | 17 (3.5) | 15 (3.1) | 24 (4.9) | 28 (5.8) |
| G | Carbohydrate metabolism and transport | 5 (3.3) | 5 (3.3) | 24 (16.1) | 27 (18.0) |
| E | Amino acid metabolism and transport | 10 (3.4) | 8 (2.7) | 52 (17.6) | 27 (9.1) |
| F | Nucleotide metabolism and transport | 8 (10.7) | 0 (0.0) | 15 (20.0) | 2 (2.7) |
| H | Coenzyme metabolism | 6 (3.8) | 3 (1.9) | 18 (9.1) | 5 (3.2) |
| I | Lipid metabolism (includes genes in the PHB cycle) | 12 (3.6) | 8 (2.4) | 30 (6.4) | 10 (7.0) |
| Q | Secondary metabolite biosynthesis, transport, and catabolism | 1 (1.0) | 4 (4.1) | 6 (6.1) | 4 (4.1) |
| Uncharacterized or poorly characterized | |||||
| R | General function prediction only | 38 (5.2) | 19 (2.6) | 86 (11.7) | 30 (4.1) |
| S | Function unknown | 89 (4.9) | 76 (4.1) | 88 (4.8) | 33 (1.8) |
| Total | 248 | 173 | 520 | 225 | |
Functional group categories are based on those described previously by Tatusov et al. (62).
Genes in the “upregulated” category underwent an upregulation of expression during PHB utilization compared to growth using fructose as a carbon source. Genes in the “downregulated” category underwent a downregulation of expression during PHB utilization compared to growth using fructose as a carbon source. The percentage of genes affected per functional group was based on the number of genes in each group exhibiting significant changes in expression levels as a percentage of the total number of R. eutropha genes in a given functional group based on data reported previously (40). For all genes represented in this table, the P value was <0.01.
Furthermore, the differences between expression levels observed when comparing growth on fructose and PHB were generally much smaller than the differences observed between growth and PHB production, the major exception being the seven-gene frc operon (locus tags H16_B1497 to H16_B1503), encoding a regulator, a fructose-specific transporter, and three proteins in the Entner-Doudoroff catabolic pathway, which was repressed by 66-fold on average. Additionally, the expression levels of both copies of RuBisCO (locus tags H16_B1394 and H16_B1395 and locus tags PHG426 and PHG427) were reduced 14-fold on average.
The genes that were most strongly induced during PHB utilization encode hypothetical proteins or proteins with a general predicted function only, reflecting the limited knowledge of this process. Interestingly, the expression levels of four genes (out of six predicted in the genome) encoding cold shock family proteins increased by 9-fold on average, suggesting a role for these gene products during PHB utilization.
Finally, a group of genes induced during PHB production remained induced during PHB utilization. Most notably, the periplasmic nitrate reductase (locus tags H16_PHG209 to H16_PHG213) is induced an average of 20-fold. Additionally, genes encoding a bo3 quinol oxidase (locus tags H16_B1025 to H16_B1028) and a bb3 cytochrome c oxidase (locus tag H16_B2058 to H16_B2062) were upregulated 15-fold and 10-fold, respectively, on average.
Changes in expression levels of PHB-related genes throughout the PHB cycle.
Figure 3 illustrates the changes in the expression levels of all PHB production pathway and related genes present in R. eutropha H16. The main PHB production gene cluster in R. eutropha, phaCAB; the regulator gene phaR; and the recently discovered granule-associated nucleation factor gene phaM (39) did not appear to exhibit dramatic changes in expression levels under conditions of PHB production or utilization (Fig. 3A to C and E), confirming that these genes are constitutively expressed throughout the cell cycle and polyhydroxyalkanoate (PHA) production, as hypothesized previously (29). One caveat regarding this result is that the P value for each gene expression comparison is high, suggesting a high level of variation among these probe sets. However, this is still an interesting result, because it suggests that the regulation of PHB production in R. eutropha may not be achieved through the regulation of phaCAB expression alone, given the irregular changes in the expression patterns of the genes in that operon. Also of note are the increases in the expression levels of the phaZ genes under conditions of nitrogen limitation. The phaZ1 gene showed a slightly increased expression level when cells produced PHB. This gene was observed to maintain a level of expression during PHB utilization similar to that during PHB production (Fig. 3F). This makes sense, as PhaZ1 was shown previously to play an integral role in PHB utilization (65, 72). The most dramatic increase in expression levels was found for the phaZ2 gene, encoding an intracellular PHB depolymerase, which increased 256-fold (Fig. 3F). These results are similar to previously reported quantitative reverse transcription (RT)-PCR results examining the level of phaZ1 and phaZ2 transcription in the H16 cells (29). The results for phaZ2 also agree with a trend seen in a previous transcriptome analysis of R. eutropha (37). The phaZ2 gene also exhibited a dramatic decrease in expression levels from PHB production to PHB utilization. As PhaZ2 was also shown to play a role in PHB utilization (72), the gene expression pattern suggests a role for PhaZ2 that is much different from that of PhaZ1 in the PHB cycle. Three genes in the R. eutropha genome are predicted to encode extracellular PhaZ enzymes, although no extracellular PHB depolymerase activity has ever been detected in R. eutropha cultures. One of these putative depolymerase genes, phaZ6, was shown to be upregulated during PHB production (Fig. 3G). These results agree with a trend observed previously (37).
Fig 3.

Expression of β-ketothiolases (A), acetoacetyl-CoA reductases (B), PHB synthases (C), phaP genes (D), phaR and phaM genes (E), intracellular and putative intracellular phaZ genes (F), and putative extracellular phaZ genes (G) under conditions of growth, PHB production, and PHB utilization. Expression profiles of phaA and bktB (A); phaB1, phaB2, and phaB3 (B); and the PHB synthase gene phaC1 and the synthase homolog phaC2 (C) are shown. For all values represented in panels A and C, the P value was >0.05. In panel B, the P value was >0.05, except for expression changes in phaB3, for which the P value was <0.01. In panel D, the P values for phaP1, phaP3, and phaP4 were <0.01, and that for phaP2 was 0.05 > P ≥ 0.01. In panel E, the P value for phaM expression was >0.05, and that for phaR was 0.05 > P ≥ 0.01. In panel F, the P value for all genes under all conditions was less than 0.01. In panel G, the P value for phaZ6 was <0.01, and the P values for phaZ4 and phaZ7 were >0.05.
The phaP1 gene exhibited an increased expression level when cells produced PHB compared to the expression level during growth (Fig. 3D). This is not surprising, since an increase in the level of production of the PhaP1 protein was linked previously to PHB production by way of the PhaR regulatory protein (42, 73). In a previous transcriptome study, the phaP1 expression level was shown to increase in the stationary growth phase (37). The phaP1 gene showed a decreased expression level during PHB utilization compared to levels during PHB production (Fig. 3D). Other phasin genes (phaP2, phaP4, and the newly discovered gene phaP5 [38]) were observed to be upregulated during nitrogen limitation (Fig. 3D). Although it was shown previously that the other phaP genes are expressed during PHB production (42, 44), the respective proteins are clearly less abundant on the PHB granule (24, 43).
Besides the genes shown in Fig. 3, there are many other genes whose putative products have been associated with PHB production (48). Aside from phaA and bktB, there are 13 other β-ketothiolase homologs present in R. eutropha (31, 37, 48). According to a recent transcriptome analysis, 6 of the 15 total β-ketothiolase homologs (including phaA and bktB) were actually expressed during growth and PHB production using gluconate as a carbon source (31). An examination of our array data revealed that 7 β-ketothiolase homologs (including phaA and bktB) were observed to be expressed under conditions of growth and PHB production on fructose (see Table S2 in the supplemental material). Four of the five additional active β-ketothiolase homologs in our study are the same as those discovered previously (31), the one exception being H16_B0759, which was shown by our data to be expressed during PHB production (see Table S2 in the supplemental material). Several acetoacetyl-CoA reductase genes and homologs are also present in the R. eutropha genome (48). Two acetoacetyl-CoA reductases, PhaB1 and PhaB3, were shown previously to be responsible for most of the 3HB-CoA production in cells, using fructose as the extracellular source of carbon (12). Of the other acetoacetyl-CoA reductase homologs, only 8 have been shown to be expressed in R. eutropha cells at any time during this study (see Table S3 in the supplemental material).
Role for RpoS (σS) in the PHB cycle.
In E. coli, the rpoS gene is upregulated in response to many stresses, including carbon starvation (5). Since conditions of PHB utilization represent a form of extracellular carbon starvation, we postulated that RpoS in R. eutropha may play a role in intracellular PHB mobilization. To address this possible relationship, we constructed an rpoS deletion mutant strain of R. eutropha and observed the behavior of the resulting strain, Re2424, under different stress conditions. As is common in rpoS mutant strains of other bacterial species (25, 50), R. eutropha Re2424 exhibited decreased resistance to hydrogen peroxide compared to the wild type (see Fig. S4 in the supplemental material). Also, no change in PHB production was seen between the wild-type and rpoS mutant strains (data not shown). During PHB utilization, however, Re2424 exhibited an increased rate and an increased overall level of polymer mobilization compared to those of strain H16. Strain Re2424 was complemented with the rpoS gene in trans on plasmid pASCB1 (Table 1), and the resulting strain utilized intracellular PHB at a similar rate and to a similar extent as the wild type (Fig. 4).
Fig 4.
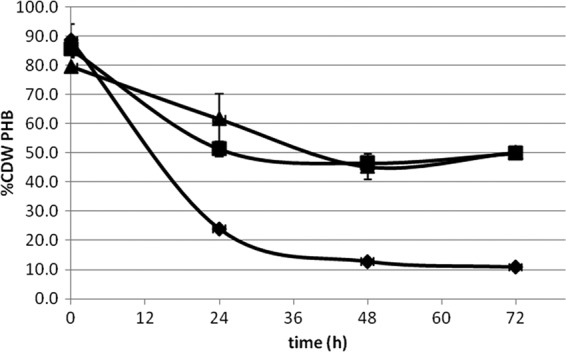
Intracellular PHB content of Ralstonia eutropha strains incubated in PHB utilization medium. R. eutropha strains H16/pBBR1MCS-2 (wild type with an empty vector) (boxes), Re2424/pBBR1MCS-2 (rpoS deletion strain with an empty vector) (diamonds), and Re2424/pASCB1 (rpoS deletion strain complemented with the rpoS gene in trans) (triangles), all containing intracellular PHB, were incubated in PHB utilization medium for 72 h. The intracellular PHB content was assayed as described in Materials and Methods (n = 3).
DISCUSSION
In recent years, genome-wide expression microarray studies have been conducted to shed new light on the metabolism of R. eutropha, solidly establishing the technique for this organism (9, 37). Although a previous microarray study aimed at providing new insights into the PHB cycle in R. eutropha was reported (37), the resolution of that study was much lower, showing only 297 genes with expression changing between growth and PHB production (as opposed to the 2,267 genes in this study). Moreover, no explanation for the global changes in gene expression was provided. In contrast, this study suggests that the bacterial alarmone guanosine tetraphosphate (ppGpp) plays a significant role in the production of PHB in R. eutropha and can account for the global expression pattern observed in both studies. However, the set of genes from the previous work (37) included accC2 (encoding biotin carboxylase), fabG (encoding 3-oxoacyl-acyl carrier protein [ACP] reductase), fabZ (encoding 3-hydroxymyristoyl-[ACP] dehydratase), and H16_A3307 (encoding a putative enoyl-CoA hydratase). Our microarray data have confirmed these trends seen in the previous study, as the levels of transcription of all these genes decreased during PHB production compared to those during growth (data not shown).
Some connections between ppGpp and the PHB cycle were reported previously, but to date, few works have shown evidence of a relationship between PHB synthesis and the stringent response. The PHB-negative phenotype, similar to that observed for Re2411 in this study, was previously observed for a Rhizobium etli rsh-negative mutant (13). However, this phenotype received little attention in that study, and no follow-up work has been reported. Evidence for the stringent response control of PHB production in R. eutropha was observed in how strain Re2411 stores its reducing equivalents when it is unable to synthesize PHB. Typically, reducing equivalents are stored in the PHB polymer during times of stress, through the reduction of acetoacetyl-CoA by the NADPH-dependent action of PhaB enzymes (12, 17). Since NADH levels in the cell are higher than NADPH levels and since the electrons of NADH mainly get transferred to oxygen for respiration (2, 51), reducing power is most likely stored by R. eutropha during growth in laboratory and fermentative cultures as NADH. Transhydrogenase gene clusters are present in the R. eutropha genome, which could potentially convert NADH to NADPH for supplying for PhaB activity during PHB production. In relA mutant strain Re2411, NADH levels remained high under conditions of nitrogen limitation (Fig. 2), thus implicating RelA and ppGpp in the distribution of the reducing potential by affecting PHB production during nitrogen starvation. This increase in cellular NADH levels could potentially result in the decreased citrate synthase activity observed for extracts of strain Re2411 (Table 4). This was also suggested in a previous study, where the presence of increasing reduced nucleotide cofactor concentrations was shown to have inhibitory effects on R. eutropha citrate synthase activity (30).
Furthermore, Ruiz et al. (49) previously showed a correlation between ppGpp accumulation and PHB degradation in Pseudomonas oleovorans, but ppGpp levels during PHB accumulation were not reported. A more recent study showed statistically significant correlations of PHA production in acetate-fed, mixed-microbial consortia with ppGpp levels in the biomass (1). The findings of the above-mentioned works, combined with the results of our study, suggest an integral regulatory role for ppGpp throughout the PHB cycle. The absolute PHB-negative phenotype observed for ΔrelA strain Re2411 (Fig. 1A) suggests that a nitrogen shortage causes amino acid deprivation, thus activating RelA-dependent ppGpp synthesis and PHB accumulation (69) (see Fig. S5 in the supplemental material). In addition to the ppGpp synthase activity of RelA, ppGpp synthase activity of SpoT has been reported in response to stimuli different than amino acid deprivation (53, 67, 70). Recently, SpoT was shown to modulate the stringent response during fatty acid shortage, sensing the availability of fatty acids through an interaction with ACP (4). It is tempting to speculate that SpoT, in a similar fashion, interacts with a heretofore uncharacterized sensor of products of PHB utilization, triggering the observed ppGpp spike coinciding with the commencement of PHB degradation (49) (see Fig. S5 in the supplemental material). SpoT-dependent ppGpp accumulation during PHB utilization could explain, for example, the continued repression of genes involved in translation, amino acid biosynthesis, and cell motility during PHB utilization observed in this study. An integral role of ppGpp throughout the PHB cycle is further supported by a recent study showing that different intracellular concentrations of ppGpp result in the expressions of different (sub)sets of genes in E. coli (64). This finding suggests the possibility that, likewise, gene expression during PHB production and utilization is governed by different intracellular ppGpp levels. Although we have not identified specific regulators that are influenced directly by ppGpp, the magnitude and variation in the intensity of the expression changes throughout the PHB cycle suggest the action of a multitude of effectors.
It is clear, however, that RpoS plays a role in PHB utilization. The deletion of rpoS results in increased PHB mobilization, suggesting that one of the roles of σS is the repression of the overutilization of intracellular polymers. The exact role of the master regulator remains to be elucidated, but given the PHB utilization phenotype of the rpoS mutant strain (Fig. 4), it is clear that σS is regulating nutrient homeostasis during the PHB cycle. RpoS was shown previously to have a role in polyhydroxyalkanoate (PHA) biosynthesis in Pseudomonas oleovorans (16, 50). However, in Pseudomonas putida, an rpoS mutation resulted in an increased PHA degradation rate (46), similar to what was observed in this study. The rpoS mutant strain in the above-mentioned study also demonstrated reduced survival under conditions of hydrogen peroxide stress, similar to our observations with R. eutropha. This finding suggests that PHB accumulation and survival during stress conditions are intertwined and regulated, at least in part, by RpoS in R. eutropha.
Furthermore, the ubiquitous presence of ppGpp as a signaling molecule among prokaryotes and plants may indicate that the results obtained in this study also apply to other types of carbon storage in a wide variety of organisms. In fact, glycogen accumulation is hampered in a relA mutant E. coli strain (8). Although the effect is not as absolute as the effect observed in this study, it lends support to a general role of the stringent response in carbon storage.
Although previous studies have touched on a connection between PHB and ppGpp, we are the first to provide evidence of a relationship between a ppGpp synthase enzyme, RelA, and the accumulation of PHB. This finding links R. eutropha PHB accumulation to the rapidly growing body of knowledge on the stringent response, potentially providing a new level of understanding of the process of PHB accumulation usable to optimize the production of PHB or other storage compounds.
Supplementary Material
ACKNOWLEDGMENTS
We thank Stuart Levine, Manlin Luo, and the rest of the MIT BioMicro Center for hybridization and processing of microarray samples. We thank Aidan Smith for assistance with plasmid constructions. We thank John Quimby, Jingnan Lu, and Jens Plassmeier for help with editing and review of the manuscript. We thank the members of the Malaysia/MIT Biotechnology Partnership Program (MMBPP) for their collegial collaborations.
C.J.B. is supported by the Advanced Research Projects Agency—Energy (ARPA-E). D.R.S. is supported by the following foundations: Nijmeegs Universiteitsfonds (SNUF), Fundatie van de Vrijvrouwe van Renswoude te's-Gravenhage, and Dr. Hendrik Muller's Vaderlandsch Fonds. This work was funded by the MMBPP, which is a collaborative effort between scientists at MIT, Universiti Sains Malaysia, Universiti Putra Malaysia, and SIRIM Berhad.
Footnotes
Published ahead of print 7 September 2012
Supplemental material for this article may be found at http://aem.asm.org/.
REFERENCES
- 1. Al-Najjar MM, Coats ER, Loge FJ. 2011. The role of the microbial stringent response in excess intracellular accumulation of phosphorous in mixed consortia fed synthetic wastewater. Water Res. 45:5038–5046 [DOI] [PubMed] [Google Scholar]
- 2. Anderson AJ, Dawes EA. 1990. Occurrence, metabolism, metabolic role, and industrial uses of bacterial polyhydroxyalkanoates. Microbiol. Rev. 54:450–472 [DOI] [PMC free article] [PubMed] [Google Scholar]
- 3. Barrios H, Valderrama B, Morett E. 1999. Compilation and analysis of sigma(54)-dependent promoter sequences. Nucleic Acids Res. 27:4305–4313 [DOI] [PMC free article] [PubMed] [Google Scholar]
- 4. Battesti A, Bouveret E. 2006. Acyl carrier protein/SpoT interaction, the switch linking SpoT-dependent stress response to fatty acid metabolism. Mol. Microbiol. 62:1048–1063 [DOI] [PubMed] [Google Scholar]
- 5. Battesti A, Majdalani N, Gottesman S. 2011. The RpoS-mediated general stress response in Escherichia coli. Annu. Rev. Microbiol. 65:189–213 [DOI] [PMC free article] [PubMed] [Google Scholar]
- 6. Bernardo LM, Johansson LU, Solera D, Skarfstad E, Shingler V. 2006. The guanosine tetraphosphate (ppGpp) alarmone, DksA and promoter affinity for RNA polymerase in regulation of sigma-dependent transcription. Mol. Microbiol. 60:749–764 [DOI] [PubMed] [Google Scholar]
- 7. Brandl H, Gross RA, Lenz RW, Fuller RC. 1988. Pseudomonas oleovorans as a source of poly(beta-hydroxyalkanoates) for potential applications as biodegradable polyesters. Appl. Environ. Microbiol. 54:1977–1982 [DOI] [PMC free article] [PubMed] [Google Scholar]
- 8. Bridger WA, Paranchych W. 1978. relA gene control of bacterial glycogen synthesis. Can. J. Biochem. 56:403–406 [DOI] [PubMed] [Google Scholar]
- 9. Brigham CJ, et al. 2010. Elucidation of beta-oxidation pathways in Ralstonia eutropha H16 by examination of global gene expression. J. Bacteriol. 192:5454–5464 [DOI] [PMC free article] [PubMed] [Google Scholar]
- 10. Brigham CJ, Kurosawa K, Rha CK, Sinskey AJ. 2011. Bacterial carbon storage to value added products. J. Microb. Biochem. Technol. 83:S3–002 doi:10.4172/1948-5948.S3-002 [Google Scholar]
- 11. Brockmann-Gretza O, Kalinowski J. 2006. Global gene expression during stringent response in Corynebacterium glutamicum in presence and absence of the rel gene encoding (p)ppGpp synthase. BMC Genomics 7:230 doi:10.1186/1471-2164-7-230 [DOI] [PMC free article] [PubMed] [Google Scholar]
- 12. Budde CF, Mahan AE, Lu J, Rha C, Sinskey AJ. 2010. Roles of multiple acetoacetyl coenzyme A reductases in polyhydroxybutyrate biosynthesis in Ralstonia eutropha H16. J. Bacteriol. 192:5319–5328 [DOI] [PMC free article] [PubMed] [Google Scholar]
- 13. Calderon-Flores A, et al. 2005. The stringent response is required for amino acid and nitrate utilization, nod factor regulation, nodulation, and nitrogen fixation in Rhizobium etli. J. Bacteriol. 187:5075–5083 [DOI] [PMC free article] [PubMed] [Google Scholar]
- 14. Chang DE, Smalley DJ, Conway T. 2002. Gene expression profiling of Escherichia coli growth transitions: an expanded stringent response model. Mol. Microbiol. 45:289–306 [DOI] [PubMed] [Google Scholar]
- 15. Cho M, Brigham CJ, Sinskey AJ, Stubbe J. 2012. Purification of polyhydroxybutyrate synthase from its native organism, Ralstonia eutropha: implications for the initiation and elongation of polymer formation in vivo. Biochemistry 51:2276–2288 [DOI] [PMC free article] [PubMed] [Google Scholar]
- 16. Choi MH, et al. 2011. Metabolic relationship between polyhydroxyalkanoic acid and rhamnolipid synthesis in Pseudomonas aeruginosa: comparative (13)C NMR analysis of the products in wild-type and mutants. J. Biotechnol. 151:30–42 [DOI] [PubMed] [Google Scholar]
- 17. Dawes EA, Senior PJ. 1973. The role and regulation of energy reserve polymers in micro-organisms. Adv. Microb. Physiol. 10:135–266 [DOI] [PubMed] [Google Scholar]
- 18. Faloona GR, Srere PA. 1969. Escherichia coli citrate synthase. Purification and the effect of potassium on some properties. Biochemistry 8:4497–4503 [DOI] [PubMed] [Google Scholar]
- 19. Fumoto M, Miyazaki S, Sugawara H. 2002. Genome Information Broker (GIB): data retrieval and comparative analysis system for completed microbial genomes and more. Nucleic Acids Res. 30:66–68 [DOI] [PMC free article] [PubMed] [Google Scholar]
- 20. Gibon Y, Larher F. 1997. Cycling assay for nicotinamide adenine dinucleotides: NaCl precipitation and ethanol solubilization of the reduced tetrazolium. Anal. Biochem. 251:153–157 [DOI] [PubMed] [Google Scholar]
- 21. Haugen SP, et al. 2006. rRNA promoter regulation by nonoptimal binding of sigma region 1.2: an additional recognition element for RNA polymerase. Cell 125:1069–1082 [DOI] [PubMed] [Google Scholar]
- 22. Haugen SP, Ross W, Gourse RL. 2008. Advances in bacterial promoter recognition and its control by factors that do not bind DNA. Nat. Rev. Microbiol. 6:507–519 [DOI] [PMC free article] [PubMed] [Google Scholar]
- 23. Haywood GW, Anderson AJ, Chu L, Dawes EA. 1988. The role of NADH- and NADPH-linked acetoacetyl-CoA reductases in the poly-3-hydroxybutyrate synthesizing organism Alcaligenes eutrophus. FEMS Microbiol. Lett. 52:259–264 [Google Scholar]
- 24. Jendrossek D. 2009. Polyhydroxyalkanoate granules are complex subcellular organelles (carbonosomes). J. Bacteriol. 191:3195–3202 [DOI] [PMC free article] [PubMed] [Google Scholar]
- 25. Kabir MS, et al. 2004. Effects of mutations in the rpoS gene on cell viability and global gene expression under nitrogen starvation in Escherichia coli. Microbiology 150:2543–2553 [DOI] [PubMed] [Google Scholar]
- 26. Karr DB, Waters JK, Emerich DW. 1983. Analysis of poly-beta-hydroxybutyrate in Rhizobium japonicum bacteroids by ion-exclusion high-pressure liquid chromatography and UV detection. Appl. Environ. Microbiol. 46:1339–1344 [DOI] [PMC free article] [PubMed] [Google Scholar]
- 27. Kovach ME, et al. 1995. Four new derivatives of the broad-host-range cloning vector pBBR1MCS, carrying different antibiotic-resistance cassettes. Gene 166:175–176 [DOI] [PubMed] [Google Scholar]
- 28. Laffler T, Gallant JA. 1974. Stringent control of protein synthesis in E. coli. Cell 3:47–49 [DOI] [PubMed] [Google Scholar]
- 29. Lawrence AG, et al. 2005. Transcriptional analysis of Ralstonia eutropha genes related to poly-(R)-3-hydroxybutyrate homeostasis during batch fermentation. Appl. Microbiol. Biotechnol. 68:663–672 [DOI] [PubMed] [Google Scholar]
- 30. Lee IY, Kim MK, Chang HN, Park YH. 1995. Regulation of poly beta-hydroxybutyrate biosynthesis by nicotinamide nucleotide in Alcaligenes eutrophus. FEMS Microbiol. Lett. 131:35–39 [Google Scholar]
- 31. Lindenkamp N, Peplinski K, Volodina E, Ehrenreich A, Steinbüchel A. 2010. Impact of multiple beta-ketothiolase deletion mutations in Ralstonia eutropha H16 on the composition of 3-mercaptopropionic acid-containing copolymers. Appl. Environ. Microbiol. 76:5373–5382 [DOI] [PMC free article] [PubMed] [Google Scholar]
- 32. Maehara A, Taguchi S, Nishiyama T, Yamane T, Doi Y. 2002. A repressor protein, PhaR, regulates polyhydroxyalkanoate (PHA) synthesis via its direct interaction with PHA. J. Bacteriol. 184:3992–4002 [DOI] [PMC free article] [PubMed] [Google Scholar]
- 33. Magnusson LU, Farewell A, Nystrom T. 2005. ppGpp: a global regulator in Escherichia coli. Trends Microbiol. 13:236–242 [DOI] [PubMed] [Google Scholar]
- 34. Ooga T, et al. 2009. Degradation of ppGpp by nudix pyrophosphatase modulates the transition of growth phase in the bacterium Thermus thermophilus. J. Biol. Chem. 284:15549–15556 [DOI] [PMC free article] [PubMed] [Google Scholar]
- 35. Peoples OP, Sinskey AJ. 1989. Poly-beta-hydroxybutyrate (PHB) biosynthesis in Alcaligenes eutrophus H16. Identification and characterization of the PHB polymerase gene (phbC). J. Biol. Chem. 264:15298–15303 [PubMed] [Google Scholar]
- 36. Peoples OP, Sinskey AJ. 1989. Poly-beta-hydroxybutyrate biosynthesis in Alcaligenes eutrophus H16. Characterization of the genes encoding beta-ketothiolase and acetoacetyl-CoA reductase. J. Biol. Chem. 264:15293–15297 [PubMed] [Google Scholar]
- 37. Peplinski K, et al. 2010. Genome-wide transcriptome analyses of the ‘Knallgas’ bacterium Ralstonia eutropha H16 with regard to polyhydroxyalkanoate metabolism. Microbiology 156:2136–2152 [DOI] [PubMed] [Google Scholar]
- 38. Pfeiffer D, Jendrossek D. 2011. Interaction between poly(3-hydroxybutyrate) granule-associated proteins as revealed by two-hybrid analysis and identification of a new phasin in Ralstonia eutropha H16. Microbiology 157:2795–2807 [DOI] [PubMed] [Google Scholar]
- 39. Pfeiffer D, Wahl A, Jendrossek D. 2011. Identification of a multifunctional protein, PhaM, that determines number, surface to volume ratio, subcellular localization and distribution to daughter cells of poly(3-hydroxybutyrate), PHB, granules in Ralstonia eutropha H16. Mol. Microbiol. 82:936–951 [DOI] [PubMed] [Google Scholar]
- 40. Pohlmann A, et al. 2006. Genome sequence of the bioplastic-producing “Knallgas” bacterium Ralstonia eutropha H16. Nat. Biotechnol. 24:1257–1262 [DOI] [PubMed] [Google Scholar]
- 41. Potrykus K, Cashel M. 2008. (p)ppGpp: still magical? Annu. Rev. Microbiol. 62:35–51 [DOI] [PubMed] [Google Scholar]
- 42. Pötter M, Madkour MH, Mayer F, Steinbüchel A. 2002. Regulation of phasin expression and polyhydroxyalkanoate (PHA) granule formation in Ralstonia eutropha H16. Microbiology 148:2413–2426 [DOI] [PubMed] [Google Scholar]
- 43. Pötter M, et al. 2004. The complex structure of polyhydroxybutyrate (PHB) granules: four orthologous and paralogous phasins occur in Ralstonia eutropha. Microbiology 150:2301–2311 [DOI] [PubMed] [Google Scholar]
- 44. Pötter M, Muller H, Steinbüchel A. 2005. Influence of homologous phasins (PhaP) on PHA accumulation and regulation of their expression by the transcriptional repressor PhaR in Ralstonia eutropha H16. Microbiology 151:825–833 [DOI] [PubMed] [Google Scholar]
- 45. Raberg M, et al. 2008. Ralstonia eutropha H16 flagellation changes according to nutrient supply and state of poly(3-hydroxybutyrate) accumulation. Appl. Environ. Microbiol. 74:4477–4490 [DOI] [PMC free article] [PubMed] [Google Scholar]
- 46. Raiger-Iustman LJ, Ruiz JA. 2008. The alternative sigma factor, sigmaS, affects polyhydroxyalkanoate metabolism in Pseudomonas putida. FEMS Microbiol. Lett. 284:218–224 [DOI] [PubMed] [Google Scholar]
- 47. Rehm BH. 2003. Polyester synthases: natural catalysts for plastics. Biochem. J. 376:15–33 [DOI] [PMC free article] [PubMed] [Google Scholar]
- 48. Reinecke F, Steinbüchel A. 2009. Ralstonia eutropha strain H16 as a model organism for PHA metabolism and for biotechnological production of technically interesting polymers. J. Mol. Microbiol. Biotechnol. 16:91–108 [DOI] [PubMed] [Google Scholar]
- 49. Ruiz JA, Lopez NI, Fernandez RO, Mendez BS. 2001. Polyhydroxyalkanoate degradation is associated with nucleotide accumulation and enhances stress resistance and survival of Pseudomonas oleovorans in natural water microcosms. Appl. Environ. Microbiol. 67:225–230 [DOI] [PMC free article] [PubMed] [Google Scholar]
- 50. Ruiz JA, Lopez NI, Mendez BS. 2004. rpoS gene expression in carbon-starved cultures of the polyhydroxyalkanoate-accumulating species Pseudomonas oleovorans. Curr. Microbiol. 48:396–400 [DOI] [PubMed] [Google Scholar]
- 51. Sauer U, Canonaco F, Heri S, Perrenoud A, Fischer E. 2004. The soluble and membrane-bound transhydrogenases UdhA and PntAB have divergent functions in NADPH metabolism of Escherichia coli. J. Biol. Chem. 279:6613–6619 [DOI] [PubMed] [Google Scholar]
- 52. Schwartz E, et al. 2003. Complete nucleotide sequence of pHG1: a Ralstonia eutropha H16 megaplasmid encoding key enzymes of H(2)-based lithoautotrophy and anaerobiosis. J. Mol. Biol. 332:369–383 [DOI] [PubMed] [Google Scholar]
- 53. Seyfzadeh M, Keener J, Nomura M. 1993. spoT-dependent accumulation of guanosine tetraphosphate in response to fatty acid starvation in Escherichia coli. Proc. Natl. Acad. Sci. U. S. A. 90:11004–11008 [DOI] [PMC free article] [PubMed] [Google Scholar]
- 54. Simon S, Priefer T, Puehler A. 1983. A broad host range mobilization system for in vivo genetic engineering: transposon mutagenesis in Gram negative bacteria. Biotechnology 1:784–791 [Google Scholar]
- 55. Slater S, et al. 1998. Multiple beta-ketothiolases mediate poly(beta-hydroxyalkanoate) copolymer synthesis in Ralstonia eutropha. J. Bacteriol. 180:1979–1987 [DOI] [PMC free article] [PubMed] [Google Scholar]
- 56. Srere PA. 1969. Citrate synthase. Methods Enzymol. 13:3–11 [Google Scholar]
- 57. Steinbüchel A, Schlegel HG. 1989. Excretion of pyruvate by mutants of Alcaligenes eutrophus which are impaired in the accumulation of poly([beta]-hydroxybutyric acid) (PHB), under conditions permitting synthesis of PHB. Appl. Microbiol. Biotechnol. 31:168–175 [Google Scholar]
- 58. Stubbe J, et al. 2005. Nontemplate-dependent polymerization processes: polyhydroxyalkanoate synthases as a paradigm. Annu. Rev. Biochem. 74:433–480 [DOI] [PubMed] [Google Scholar]
- 59. Sudesh K, Abe H, Doi Y. 2000. Synthesis, structure, and properties of polyhydroxyalkanoates: biological polyesters. Prog. Polym. Sci. 25:1503–1555 [Google Scholar]
- 60. Svitil AL, Cashel M, Zyskind JW. 1993. Guanosine tetraphosphate inhibits protein synthesis in vivo. A possible protective mechanism for starvation stress in Escherichia coli. J. Biol. Chem. 268:2307–2311 [PubMed] [Google Scholar]
- 61. Tamura K, Peterson D, Peterson N, Stecher G, Kumar S. 2011. MEGA5: molecular evolutionary genetics analysis using maximum likelihood, evolutionary distance, and maximum parsimony methods. Mol. Biol. Evol. 28:2731–2739 [DOI] [PMC free article] [PubMed] [Google Scholar]
- 62. Tatusov RL, et al. 2001. The COG database: new developments in phylogenetic classification of proteins from complete genomes. Nucleic Acids Res. 29:22–28 [DOI] [PMC free article] [PubMed] [Google Scholar]
- 63. Traxler MF, et al. 2008. The global, ppGpp-mediated stringent response to amino acid starvation in Escherichia coli. Mol. Microbiol. 68:1128–1148 [DOI] [PMC free article] [PubMed] [Google Scholar]
- 64. Traxler MF, et al. 2011. Discretely calibrated regulatory loops controlled by ppGpp partition gene induction across the ‘feast to famine’ gradient in Escherichia coli. Mol. Microbiol. 79:830–845 [DOI] [PMC free article] [PubMed] [Google Scholar]
- 65. Uchino K, Saito T, Gebauer B, Jendrossek D. 2007. Isolated poly(3-hydroxybutyrate) (PHB) granules are complex bacterial organelles catalyzing formation of PHB from acetyl coenzyme A (CoA) and degradation of PHB to acetyl-CoA. J. Bacteriol. 189:8250–8256 [DOI] [PMC free article] [PubMed] [Google Scholar]
- 66. Umemura K, Kimura H. 2005. Determination of oxidized and reduced nicotinamide adenine dinucleotide in cell monolayers using a single extraction procedure and a spectrophotometric assay. Anal. Biochem. 338:131–135 [DOI] [PubMed] [Google Scholar]
- 67. Vinella D, Albrecht C, Cashel M, D'Ari R. 2005. Iron limitation induces SpoT-dependent accumulation of ppGpp in Escherichia coli. Mol. Microbiol. 56:958–970 [DOI] [PubMed] [Google Scholar]
- 68. Walde E. 1962. Unterschungen uber wachstum und speicherstoffsythese von Hydrogenomonas. Arch. Mikrobiol. 43:109 doi:10.1007/BF00406429 [PubMed] [Google Scholar]
- 69. Wendrich TM, Blaha G, Wilson DN, Marahiel MA, Nierhaus KH. 2002. Dissection of the mechanism for the stringent factor RelA. Mol. Cell 10:779–788 [DOI] [PubMed] [Google Scholar]
- 70. Xiao H, et al. 1991. Residual guanosine 3′,5′-bispyrophosphate synthetic activity of relA null mutants can be eliminated by spoT null mutations. J. Biol. Chem. 266:5980–5990 [PubMed] [Google Scholar]
- 71. Yamashita K, Yamada M, Numata K, Taguchi S. 2006. Nonspecific hydrophobic interactions of a repressor protein, PhaR, with poly[(R)-3-hydroxybutyrate] film studied with a quartz crystal microbalance. Biomacromolecules 7:2449–2454 [DOI] [PubMed] [Google Scholar]
- 72. York GM, et al. 2003. Ralstonia eutropha H16 encodes two and possibly three intracellular poly[D-(−)-3-hydroxybutyrate] depolymerase genes. J. Bacteriol. 185:3788–3794 [DOI] [PMC free article] [PubMed] [Google Scholar]
- 73. York GM, Stubbe J, Sinskey AJ. 2002. The Ralstonia eutropha PhaR protein couples synthesis of the PhaP phasin to the presence of polyhydroxybutyrate in cells and promotes polyhydroxybutyrate production. J. Bacteriol. 184:59–66 [DOI] [PMC free article] [PubMed] [Google Scholar]
- 74. Zhang Z, Yu J, Stanton RC. 2000. A method for determination of pyridine nucleotides using a single extract. Anal. Biochem. 285:163–167 [DOI] [PubMed] [Google Scholar]
Associated Data
This section collects any data citations, data availability statements, or supplementary materials included in this article.