Abstract
Aims:
The purposes of the present study were to clarify the normal variation and to determine the normal reference values of diffusion tensor (DT) parameters (mean diffusivity [MD] and fractional anisotropy [FA]) of the spinal cord in single-shot fast spin-echo-based sequence at 3.0-Tesla (3T).
Materials and Methods:
Thirty healthy subjects (mean age = 44.2 years, range = 20–72 years) were enrolled for this study. Mean values of MD and FA in six spinal levels (C2/3, C3/4, C4/5, C5/6, C6/7, and C7/Th1) were measured. Mean values, variances, and distributions of the MD and FA in each spinal level were analyzed. Age-dependent change of MD and FA as well as correlation between MD and FA was also analyzed.
Results:
At all spinal levels, the values can be considered to be Gaussian distribution in MD but not in FA. A significant statistical negative correlation was observed between aging and the values of MD (r = 0.429, P = 0.018), but insignificant between the values of FA (P = 0.234). A slight significant statistical negative correlation was observed between the values of MD and FA (r = 0.156, P = 0.037). One way repeated measures analysis of variance indicated the significant difference between the spinal levels in both MD (P = 0.003) and FA (P < 0.0001).
Conclusions:
The analyzed data in the present study would be helpful for comparison when investigating the spinal condition of spinal disorders.
Keywords: Diffusion tensor imaging, fractional anisotropy, mean diffusivity, normal subjects, spinal cord
INTRODUCTION
Spinal disorders can include age-related degeneration, neoplasms, inflammation, vascular problems or trauma. Although spinal cord imaging using computed tomography (CT) and magnetic resonance imaging (MRI) are commonly used methods for structural diagnosis, subjective neurological scoring or grading systems are still widely used for evaluation of the condition of the spinal cord.[1] Although motor function can be assessed objectively to some degree by scaling muscle strength, objective assessments of the sensory or autonomous nervous systems can be easily affected by mood or psychological conditions. A more robust objective assessment of the condition of the spinal cord is desirable and needs to be developed.
Diffusion tensor (DT) imaging offers not only fiber tracking obtained by serially connecting the maximum diffusion direction in each voxel, but also quantitative diffusion parameters that characterize intrinsic features of the tissue microstructure and microdynamics at each voxel level. Mean diffusivity (MD) and fractional anisotropy (FA) are commonly used quantitative DT parameters. MD represents the degree of diffusional motion of water molecules (regardless of direction) and is measured in units of mm2/s. FA represents a rotationally invariant parameter ranging from 0 to 1; 0 represents completely isotropic diffusion and 1 represents extremely limited diffusion in only one direction.[2] Although there have been several studies on DT parameters of the spinal cord, quantitative values have varied to some degree because of the differences in MRI sequences, magnetic field, acquisition parameters or ROI setting.[3–12]
The present study attempted to clarify normal reference values of MD and FA in healthy subjects through evaluation of DT parameters as a first step in understanding the pathological condition of the spinal cord.
MATERIALS AND METHODS
Subjects
Thirty healthy subjects consisting of 15 men and 15 women with a mean age of 44.2 years (range from 20 to 72 years) were enrolled. All subjects considered themselves as healthy and without any past history of neck or back injuries, spine surgeries or neurological disorders. In all subjects, the lack of any spinal cord compression of the cervical spine was confirmed on MRI. Written informed consent was obtained from all subjects.
MRI sequence
This study was performed on a whole-body 3.0-Tesla (3T) scanner (Achieva, Philips Medical Systems, Best, Netherlands) using a 16-element phased-array coil in a single institution (Manryokai Imaging Clinic, Osaka, Japan). For routine diagnostic imaging of the cervical spine, T1-[echo time (TE)/ repetition time (TR), 7/600 ms] and T2-(TE/TR, 90/3680 ms) weighted images in the sagittal and axial planes were acquired. Then, DT images were obtained using a single-shot fast spin-echo-based sequence[13,14] with the following parameters: TE/TR, 80/6000 ms, number of excitations, 1; field of view, 240; matrix size, 160; voxel size, 1.5 × 1.5 mm2 in-plane; slice thickness, 3 mm; 15 gradient directions; and b values, 0 and 1000 s/mm2. Thirty slices of DT images on the axial plane were obtained from the C2/3 to the C7/Th1 spinal level without interslice gaps and parallel to the inferior line of the C5 vertebral body on the T2-weighted mid-sagittal plane [Figure 1]. The DT images were acquired in a total of 4 min and 54 s.
Figure 1.
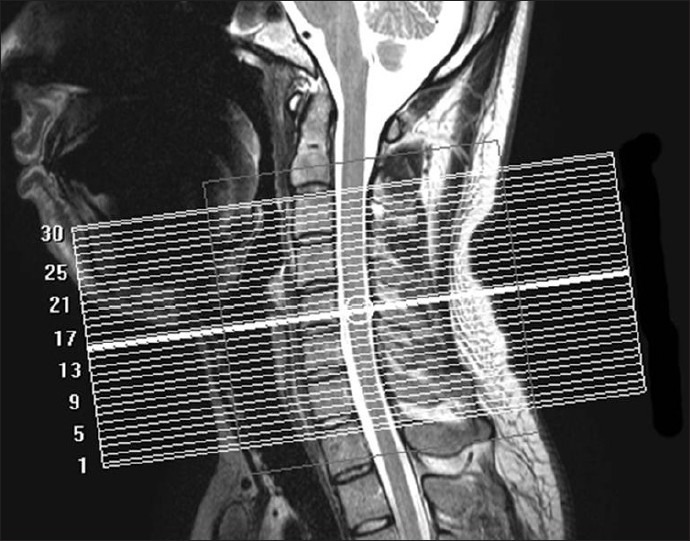
T2-weighted sagittal anatomical image. Referring to the image, 30 slices of diffusion tensor images are obtained from C2/3 to C7/Th1 spinal level on the axial plane, parallel to the inferior line of the C5 vertebral body
Region of interest setting and measurement
For reconstruction of the MD and FA maps from the DT images, a Philips MR imaging workstations was utilized. Mean values of MD and FA at 6 disc levels (C2/3, C3/4, C4/5, C5/6, C6/7, and C7/Th1) were measured. MD and FA maps on the axial plane are demonstrated in [Figure 2a and 2b], respectively. After the appropriate axial slice was selected using the sagittal T2-weighted images and b = 0 s/mm2 DT images for anatomic reference, Region of interest (ROI) were set manually to enclose the whole spinal cord in the slice. ROIs were drawn carefully in order to exclude cerebrospinal fluid, which would contribute an unwanted partial volume effect to the DT parameters.
Figure 2.
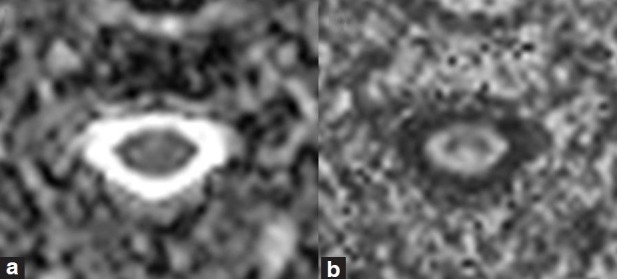
(a) Examples of the map of mean diffusivity (b) fractional anisotropy. Regions of interest are set manually enclosing whole part of the spinal cord in the slice
Evaluation
Mean values, variances, and distributions of the MD and FA in each spinal level
After analyzing the mean values and variances of the MD and FA at all 6 spinal levels in all subjects, the Shapiro-Wilk normality test was applied at each level in order to verify whether these values could be considered to have a Gaussian distribution.
Age-dependent change
Pearson's product-moment correlation coefficient (r) was used to study the relationships between age and MD and FA. For representative individual values of MD and FA, the average values of MD and FA of the 6 levels were applied in this analysis.
Correlation between MD and FA
The Pearson's product-moment correlation coefficient (r) was used to study the relationships between the MD and FA. MD and FA values in the 6 spinal levels were separately compared in all subjects.
Changes of MD and FA between spinal levels
Bartlett's test was first applied to verify the difference of variances in the 6 spinal levels. Subsequently, a significant change between spinal levels was examined with one-way repeated measures analysis of variance (ANOVA), considering each spinal level as an intrasubject variable.
Statistical analysis
Statistical analyses were conducted using JMP 9.0 (SAS institute, Inc.). Statistically significant differences were accepted at P-value < 0.05 in all analyses.
RESULTS
Mean values, variances, and distributions of the MD and FA in each spinal level
Mean values and standard deviation (SD) of the MD and FA at six spinal levels were shown in [Table 1] and [Figure 3]. The Shapiro-Wilk normality test indicated that the null hypothesis of the MD data having a Gaussian distribution was not rejected at all spinal levels. However, the null hypothesis of the FA data having a Gaussian distribution was rejected at the C5/6 spinal level (P = 0.006).
Table 1.
Mean and standard deviation of the mean diffusivity and fractional anisotropy at 6 spinal levels

Figure 3.
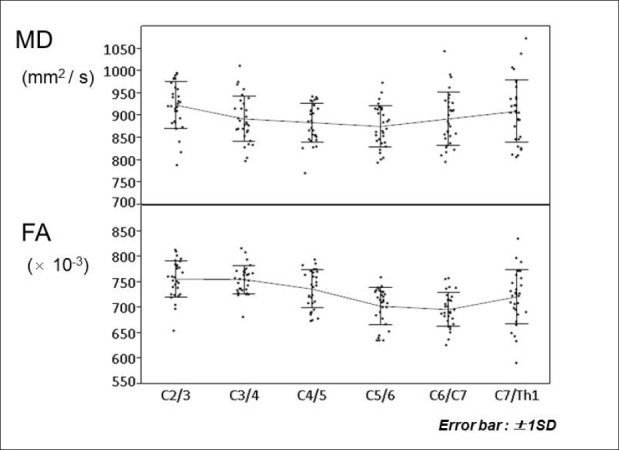
The mean values and standard deviation (SD) of mean diffusivity (MD) and fractional anisotropy (FA) at 6 spinal levels. Error bars represent +/- 1SD. One-way repeated measures ANOVA indicate significant differences between the spinal levels in both MD (P = 0.003) and FA (P < 0.0001)
Age-dependent change
A scatter plot demonstrating age-related changes is shown in [Figure 4]. A statistically significant negative correlation was observed between aging MD values. Pearson's correlation coefficients and corresponding P values for these correlations were r = 0.429 and P = 0.018, respectively. On the other hand, the correlation between aging and FA was not statistically significant (P = 0.234).
Figure 4.
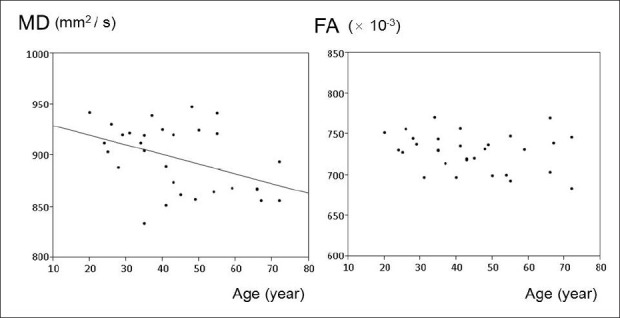
The relationships between aging and mean diffusivity (MD) and fractional anisotropy (FA). A significant negative correlation is observed between aging and values of MD (correlation coefficient = 0.429, P = 0.018). On the other hand, the correlation between aging and values of FA is not significant (P = 0.234)
Correlation between MD and FA
A scatter plot demonstrating the correlation between MD and FA is shown in [Figure 5]. A slightly statistically significant negative correlation was observed between MD and FA. The Pearson's correlation coefficient and the corresponding P value for this correlation were r = 0.156 and P = 0.037, respectively.
Figure 5.
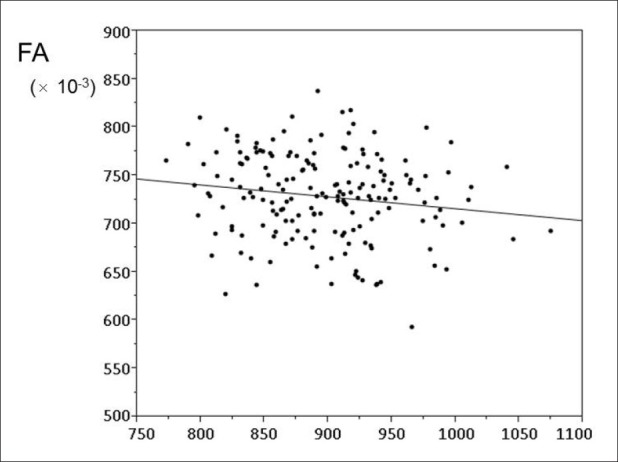
Scatter plot showing the relationships between mean diffusivity (MD) and fractional anisotropy (FA). A slightly significant statistical negative correlation is observed between MD and FA (correlation coefficient = 0.156, P = 0.037)
Changes of MD and FA between spinal levels
Bartlett's test indicated that the null hypothesis of equal variance in the MD data was not rejected (P = 0.115), but was rejected for the FA data (P = 0.017). One-way repeated measures ANOVA indicated a significant difference between spinal levels in both MD (P = 0.003) and FA (P < 0.0001) [Figure 3].
DISCUSSION
In the present study, normal reference values for diffusion tensor parameters of the spinal cord in healthy subjects were analyzed using single-shot fast spin-echo-based sequence. Data analysis indicated a Gaussian distribution of MD and significant differences between the mean values at each spinal level. A significant negative correlation between aging and MD was demonstrated. A negative correlation between MD and FA was also demonstrated.
DT imaging is a promising modality for quantitative estimation of the values of tissue condition. In brain imaging, quantitative analysis using DT parameters is a well-established technique for detection of the pathological changes which are not evident on the conventional images, even at a very early stage of the pathology.[15–18] On the other hand, application of DT imaging to the spinal cord has been limited because of anatomical disadvantages including the relatively small size of the spinal cord and surrounding structures (such as the cerebrospinal fluid, vertebra, and air in the trachea). These disadvantages tend to produce susceptibility artifacts. More recently, technical advancements such as line scan diffusion imaging,[19–23] PROPELLER-MRI,[24,25] or Zonally-magnified Oblique Multislice (ZOOM) EPI,[3] have made it possible to acquire good quality DT images of the cervical spinal cord. For clinical applications, several studies evaluating demyelination or degenerative spinal cord diseases with DT parameters have been reported. Increased MD and/or decreased FA at the site of lesions appear to reflect tissue condition.[4,5,7,11,26,27] These changes have been explained to be caused by a chronically poor blood supply, histopathological changes (including gliosis, microcystic degeneration, venous congestion, and extracellular edema) that lead to increased water mobility and decrease anisotropy.
In the present MRI protocol, DT images were acquired with a single-shot fast spin-echo-based sequence.[13,14] This method has been reported to have advantages compared to traditional single-shot echo-planar imaging due to decreased magnetic susceptibility artifacts that are particularly remarkable at higher magnetic fields such as 3T.[28,29] The number of excitations, slice thickness, number of slices, number of diffusion gradient directions and b values were determined taking previous reports and an appropriate acquisition time into consideration.[10–12,30] Considering clinical applications and considering that DT imaging have the feature of being sensitive to motion, a reasonably short acquisition time was determined for acquisition of the DT images. The ROIs were placed enclosing the whole spinal cord in the axial plane. In fact, the MD and FA have been reported to vary between gray and white matter in the spinal cord.[3] Although a separate analyses of gray and white matter would be ideal, it is difficult to distinguish the gray matter in the spinal cord considering the spatial resolutions that are currently possible in the clinical setting. For this reason, ROIs were selected to include the whole spinal cord.
The present study showed that MD and FA were different at different spinal levels. As previously reported, this difference was assumed to be derived from the ratio of gray and white matter at different spinal levels.[3] A statistically significant negative correlation was found between age and MD, and this difference was thought to be derived from progressive gliosis due to aging. The present study provides normal reference values for DT parameters that can be used for comparison when investigating the spinal condition of spinal disorders such as are-related degeneration, neoplasms, inflammation, vascular problems or trauma. In the future, a normal database of spinal DT parameters could be produced based on aging or spinal level. Correlation analysis between MD and FA may indicate that the parameters interact with each other, and are not considered to be independent valuables. There are some disadvantages to the use of FA when constructing normal database for statistical evaluation: FA is a relative index with limitation from 0 to 1 and a Gaussian distribution for such a parameter is unexpected.
CONCLUSIONS
DT parameters are indicators that could be used to assess the condition of the spinal cord. This is the first report to describe normal reference values for DT parameters of the spinal cord in healthy subjects in a single-shot fast spin-echo-based sequence at 3T. The analyzed data in the present study could be helpful for comparison when investigating the spinal condition of spinal disorders. Further study should establish an objective assessment of spinal cord function using MRI.
ACKNOWLEDGMENT
The authors thank technologists Atsushi Ikemoto at Manryokai Imaging Clinic for their technical support and invaluable assistance in MRI acquisition
Footnotes
Source of Support: Nil
Conflict of Interest: None declared.
REFERENCES
- 1.Kadoya S. Grading and scoring system for neurological function in degenerative cervical spine disease--Neurosurgical Cervical Spine Scale. Neurol Med Chir (Tokyo) 1992;32:40–1. doi: 10.2176/nmc.32.40. [DOI] [PubMed] [Google Scholar]
- 2.Le Bihan D, Mangin JF, Poupon C, Clark CA, Pappata S, Molko N, et al. Diffusion tensor imaging: Concepts and applications. J Magn Reson Imaging. 2001;13:534–46. doi: 10.1002/jmri.1076. [DOI] [PubMed] [Google Scholar]
- 3.Wheeler-Kingshott CA, Hickman SJ, Parker GJ, Ciccarelli O, Symms MR, Miller DH, et al. Investigating cervical spinal cord structure using axial diffusion tensor imaging. Neuroimage. 2002;16:93–102. doi: 10.1006/nimg.2001.1022. [DOI] [PubMed] [Google Scholar]
- 4.Valsasina P, Agosta F, Benedetti B, Caputo D, Perini M, Salvi F, et al. Diffusion anisotropy of the cervical cord is strictly associated with disability in amyotrophic lateral sclerosis. J Neurol Neurosurg Psychiatry. 2007;78:480–4. doi: 10.1136/jnnp.2006.100032. [DOI] [PMC free article] [PubMed] [Google Scholar]
- 5.Agosta F, Benedetti B, Rocca MA, Valsasina P, Rovaris M, Comi G, et al. Quantification of cervical cord pathology in primary progressive MS using diffusion tensor MRI. Neurology. 2005;64:631–5. doi: 10.1212/01.WNL.0000151852.15294.CB. [DOI] [PubMed] [Google Scholar]
- 6.Agosta F, Lagana M, Valsasina P, Sala S, Dall’Occhio L, Sormani MP, et al. Evidence for cervical cord tissue disorganisation with aging by diffusion tensor MRI. Neuroimage. 2007;36:728–35. doi: 10.1016/j.neuroimage.2007.03.048. [DOI] [PubMed] [Google Scholar]
- 7.Benedetti B, Valsasina P, Judica E, Martinelli V, Ghezzi A, Capra R, et al. Grading cervical cord damage in neuromyelitis optica and MS by diffusion tensor MRI. Neurology. 2006;67:161–3. doi: 10.1212/01.wnl.0000223637.65208.7c. [DOI] [PubMed] [Google Scholar]
- 8.Ellingson BM, Ulmer JL, Kurpad SN, Schmit BD. Diffusion tensor MR imaging in chronic spinal cord injury. AJNR Am J Neuroradiol. 2008;29:1976–82. doi: 10.3174/ajnr.A1272. [DOI] [PMC free article] [PubMed] [Google Scholar]
- 9.Ries M, Jones RA, Dousset V, Moonen CT. Diffusion tensor MRI of the spinal cord. Magn Reson Med. 2000;44:884–92. doi: 10.1002/1522-2594(200012)44:6<884::aid-mrm9>3.0.co;2-q. [DOI] [PubMed] [Google Scholar]
- 10.Hesseltine SM, Law M, Babb J, Rad M, Lopez S, Ge Y, et al. Diffusion tensor imaging in multiple sclerosis: Assessment of regional differences in the axial plane within normal-appearing cervical spinal cord. AJNR Am J Neuroradiol. 2006;27:1189–93. [PMC free article] [PubMed] [Google Scholar]
- 11.Mamata H, Jolesz FA, Maier SE. Apparent diffusion coefficient and fractional anisotropy in spinal cord: Age and cervical spondylosis-related changes. J Magn Reson Imaging. 2005;22:38–43. doi: 10.1002/jmri.20357. [DOI] [PubMed] [Google Scholar]
- 12.Santarelli X, Garbin G, Ukmar M, Longo R. Dependence of the fractional anisotropy in cervical spine from the number of diffusion gradients, repeated acquisition and voxel size. Magn Reson Imaging. 2010;28:70–6. doi: 10.1016/j.mri.2009.05.046. [DOI] [PubMed] [Google Scholar]
- 13.Alsop DC. Phase insensitive preparation of single-shot RARE: Application to diffusion imaging in humans. Magn Reson Med. 1997;38:527–33. doi: 10.1002/mrm.1910380404. [DOI] [PubMed] [Google Scholar]
- 14.Bastin ME, Le Roux P. On the application of a non-CPMG single-shot fast spin-echo sequence to diffusion tensor MRI of the human brain. Magn Reson Med. 2002;48:6–14. doi: 10.1002/mrm.10214. [DOI] [PubMed] [Google Scholar]
- 15.Alexander AL, Lee JE, Lazar M, Field AS. Diffusion tensor imaging of the brain. NeuroRx. 2007;4:316–29. doi: 10.1016/j.nurt.2007.05.011. [DOI] [PMC free article] [PubMed] [Google Scholar]
- 16.Pierpaoli C, Basser PJ. Toward a quantitative assessment of diffusion anisotropy. Magn Reson Med. 1996;36:893–906. doi: 10.1002/mrm.1910360612. [DOI] [PubMed] [Google Scholar]
- 17.Kitamura K, Nakayama K, Kosaka S, Yamada E, Shimada H, Miki T, et al. Diffusion tensor imaging of the cortico-ponto-cerebellar pathway in patients with adult-onset ataxic neurodegenerative disease. Neuroradiology. 2008;50:285–92. doi: 10.1007/s00234-007-0351-9. [DOI] [PubMed] [Google Scholar]
- 18.Hong YH, Lee KW, Sung JJ, Chang KH, Song IC. Diffusion tensor MRI as a diagnostic tool of upper motor neuron involvement in amyotrophic lateral sclerosis. J Neurol Sci. 2004;227:73–8. doi: 10.1016/j.jns.2004.08.014. [DOI] [PubMed] [Google Scholar]
- 19.Hori M, Okubo T, Aoki S, Kumagai H, Araki T. Line scan diffusion tensor MRI at low magnetic field strength: Feasibility study of cervical spondylotic myelopathy in an early clinical stage. J Magn Reson Imaging. 2006;23:183–8. doi: 10.1002/jmri.20488. [DOI] [PubMed] [Google Scholar]
- 20.Robertson RL, Maier SE, Mulkern RV, Vajapayam S, Robson CD, Barnes PD. MR line-scan diffusion imaging of the spinal cord in children. AJNR Am J Neuroradiol. 2000;21:1344–8. [PMC free article] [PubMed] [Google Scholar]
- 21.Bammer R, Herneth AM, Maier SE, Butts K, Prokesch RW, Do HM, et al. Line scan diffusion imaging of the spine. AJNR Am J Neuroradiol. 2003;24:5–12. [PMC free article] [PubMed] [Google Scholar]
- 22.Gudbjartsson H, Maier SE, Mulkern RV, Morocz IA, Patz S, Jolesz FA. Line scan diffusion imaging. Magn Reson Med. 1996;36:509–19. doi: 10.1002/mrm.1910360403. [DOI] [PubMed] [Google Scholar]
- 23.Murphy BP, Zientara GP, Huppi PS, Maier SE, Barnes PD, Jolesz FA, et al. Line scan diffusion tensor MRI of the cervical spinal cord in preterm infants. J Magn Reson Imaging. 2001;13:949–53. doi: 10.1002/jmri.1136. [DOI] [PubMed] [Google Scholar]
- 24.Pipe JG, Farthing VG, Forbes KP. Multishot diffusion-weighted FSE using PROPELLER MRI. Magn Reson Med. 2002;47:42–52. doi: 10.1002/mrm.10014. [DOI] [PubMed] [Google Scholar]
- 25.Pipe JG. Motion correction with PROPELLER MRI: Application to head motion and free-breathing cardiac imaging. Magn Reson Med. 1999;42:963–9. doi: 10.1002/(sici)1522-2594(199911)42:5<963::aid-mrm17>3.0.co;2-l. [DOI] [PubMed] [Google Scholar]
- 26.van Hecke W, Nagels G, Emonds G, Leemans A, Sijbers J, van Goethem J, et al. A diffusion tensor imaging group study of the spinal cord in multiple sclerosis patients with and without T2 spinal cord lesions. J Magn Reson Imaging. 2009;30:25–34. doi: 10.1002/jmri.21817. [DOI] [PubMed] [Google Scholar]
- 27.Valsasina P, Rocca MA, Agosta F, Benedetti B, Horsfield MA, Gallo A, et al. Mean diffusivity and fractional anisotropy histogram analysis of the cervical cord in MS patients. Neuroimage. 2005;26:822–8. doi: 10.1016/j.neuroimage.2005.02.033. [DOI] [PubMed] [Google Scholar]
- 28.Turner R, Le Bihan D, Maier J, Vavrek R, Hedges LK, Pekar J. Echo-planar imaging of intravoxel incoherent motion. Radiology. 1990;177:407–14. doi: 10.1148/radiology.177.2.2217777. [DOI] [PubMed] [Google Scholar]
- 29.Xu D, Henry RG, Mukherjee P, Carvajal L, Miller SP, Barkovich AJ, et al. Singleshot fast spin-echo diffusion tensor imaging of the brain and spine with head and phased array coils at 1.5 T and 3.0 T. Magn Reson Imaging. 2004;22:751–9. doi: 10.1016/j.mri.2004.01.075. [DOI] [PubMed] [Google Scholar]
- 30.Ohgiya Y, Oka M, Hiwatashi A, Liu X, Kakimoto N, Westesson PL, et al. Diffusion tensor MR imaging of the cervical spinal cord in patients with multiple sclerosis. Eur Radiol. 2007;17:2499–504. doi: 10.1007/s00330-007-0672-4. [DOI] [PubMed] [Google Scholar]


