Abstract
Circulating insulin-like growth factor 1 (IGF-1) has been shown to act as a negative feedback regulator of growth hormone (GH) gene expression; however, the mechanism of this negative feedback is poorly understood. Activation and regulation of GH gene expression require the binding of the transcription factor POU1F1 to the GH promoter along with cyclic AMP (cAMP) response element binding protein (CREB) binding protein (CBP). We investigate the role of CBP as a target of IGF-1 somatotroph regulation using the MtT/S somatotroph cell line. IGF-1 significantly inhibits basal GH mRNA levels but not POU1F1 levels. Chromatin immunoprecipitation assays demonstrate inhibition of CBP binding to the GH promoter after IGF-1 treatment. We hypothesized that IGF-1 receptor (IGF-1R) signaling disrupts the POU1F1/CBP complex to inhibit gene expression. In support, the use of a mutant CBP (S436A) construct, which lacks a critical phosphorylation site, leads to the loss of IGF-1 inhibition. The studies of CBP (S436A) knock-in mice show elevated serum GH levels, a greater response to GH releasing hormone (GHRH) stimulation along with lower weight gain, and decreased body fat. Our data confirm the inhibitory effects of IGF-1 on GH expression at the level of the promoter and provide evidence of CBP's role as a target of IGF-1R signaling.
INTRODUCTION
The regulation of growth hormone (GH) is primarily influenced by the antagonistic actions of the hypothalamic hormones growth hormone releasing hormone (GHRH) and somatostatin (SRIF); however, it also well documented that the release of GH may be influenced by other factors and proteins produced both centrally and peripherally (2, 5, 8, 14, 45, 47). Insulin-like growth factor 1 (IGF-1), which is produced primarily in the liver under the direct influence of GH, has an important role in not only somatic growth and metabolism but also negative feedback of GH release by targeting both the hypothalamus and pituitary (7, 22, 39, 43). Several in vitro studies have demonstrated the ability of IGF-1 to decrease GH gene expression and hormone release (33, 40, 52–54). Furthermore, transgenic animals with perturbations in the GH axis also demonstrate IGF-1's direct and indirect roles in regulation of the somatotroph (27, 30, 35, 49, 51). IGF-1R is a heterotetrameric glycoprotein comprised of two extracellular alpha subunits, which bind IGF-1, and two transmembrane beta subunits, which contain tyrosine kinase activity (13, 22). Upon ligand binding to the receptor, two major pathways, the Ras/Raf/mitogen-activated protein (MAP) kinase and the phosphatidylinositol 3-kinase (PI3 kinase) pathway, have been shown to play a role in mediating IGF-1 responses (16, 17, 24, 26).
Although in vitro and in vivo studies of IGF-1 negative feedback have proposed specific targets that ultimately affect GH expression and release, a mechanism of regulation at the cellular level remains unclear. We chose to first study IGF-1 regulation using an in vitro approach with the MtT/S cell line, which is an established rat tumor somatotroph cell line that secretes GH. It is known that the activation of GH gene expression in the somatotroph requires the transcription factor POU1F1 (also referred to as Pit-1 and throughout this article referred to as Pit-1/POU1F1), a 33-kDa protein that belongs to the POU family of transcription factors (9, 32). POU1F1 contains an N-terminal trans-activation domain, which is necessary for cell-specific expression of the GH gene; however, POU1F1 alone is not sufficient for regulated GH gene expression (18, 20, 28, 29, 37, 44). The POU1F1 trans-activation domain is also crucial for recruitment of CBP (23). CBP, initially described as a 270-kDa nuclear protein that interacts with CREB to activate gene expression, also interacts with components of the basal transcription machinery and with cell-specific transcription factors (3, 25, 41). The phosphorylation of CBP's carboxy-terminal glutamine-rich region regulates CBP's trans-activation potential, and there is evidence to demonstrate the importance of the conserved phosphorylation site at Ser436 as a mechanism for controlling CBP-dependent gene transcription (19, 55, 56). This area of growth factor regulation therefore presents as a potential mechanism for affecting the role of CBP as a coactivator and ultimately the transcriptional activity of POU1F1. CBP, furthermore, has been shown to act independently of CREB, as a cofactor for POU1F1-dependent activation of the GH promoter by the GHRH signaling pathway (15). We investigated the role of CBP as a target of IGF-1-mediated inhibition of GH gene expression both in vitro and in vivo. We describe how phosphorylation of CBP via signaling from the IGF-1 receptor (IGF-1R) disrupts the POU1F1/CBP complex, affecting its ability to interact with the GH promoter and thus downregulating GH gene expression. The role of CBP was further explored in vivo using the CBP (S436A) knock-in mouse model, in which CBP cannot be phosphorylated. These mice demonstrate increased serum GH levels as a marker of diminished feedback to the somatotroph and despite no increased growth; these knock-in mice show decreased fat mass. The characterization of the GH axis in these knock-in mice demonstrates the important physiologic role of CBP in somatotroph regulation.
MATERIALS AND METHODS
Cell culture.
MtT/S cells were grown in Dulbecco's modified Eagle medium (DMEM)-F12 (1:1; Gibco, Grand Island, NY) supplemented with 10% fetal bovine serum (HyClone, Logan, UT), 2.5% horse serum (heat inactivated; Sigma, St. Louis, MO), and 100 U/ml penicillin in an atmosphere with 5% CO2 at 37°C. Prior to initiation of experiments, cells were plated on 6-well poly-d-lysine (Sigma)-coated dishes overnight. Cultured MtT/S cells were treated with increasing concentrations of IGF-1 (0 to 100 nM) for 24 h and then harvested for RNA extraction. Cells were also treated with IGF-1 (30 nM) followed by cell harvesting at various time points over 72 h.
qRT-PCR.
Total RNA was harvested from MtT/S cells using TRIzol reagent ((Invitrogen, Carlsbad, CA) following the protocol suggested by the manufacturer. cDNA was synthesized from 2 μg of RNA using the iScript cDNA kit (Bio-Rad, Hercules, CA). Quantitative real-time PCR (qRT-PCR) was performed in duplicate using Sybr green master mix (Bio-Rad) and the iCycler quantitative PCR machine (Bio-Rad). The 36B4 housekeeping RNA was used as an internal control. The following primers were used: 36B4 sense, 5′-TTCCCACTGGCTGAAAAGGT-3′; 36B4 antisense, 5′-GCCGCAGCCGCAAATGC-3′; GH sense, 5′-GCTGCAGACTCTCAGACTCCCTGG-3′; GH antisense, 5′-CTGAGAAGCAGAACGCAGCCTG-3′; CBP sense, 5′-TAATGGAGGCTGCCCAGTGTGTAA-3′; CBP antisense, 5′-CTGGCGGAGCTTGTGTTTGATGTT-3′; Pit-1/POU1F1 sense, 5′-ATGTCCACAGCGACAGGACTTCAT-3′; and Pit-1/POU1F1 antisense, 5′-ACTCAGGGTGTGGTCTGGAAACTT-3′. The reader should note that Pit-1 is synonymous with POU1F1; however, in order to maintain consistency with the labeling of reagents, the Pit-1 nomenclature or Pit-1/POU1F1 is used within Materials and Methods, Results, and the figures. PCR conditions were optimized to generate >95% PCR efficiency, and only those reactions with between 95 and 105% efficiency were included in subsequent analyses. Relative differences in cDNA concentration between baseline and experimental conditions were then calculated using the comparative threshold cycle (CT) method (11).
ChIP assay.
MtT/S cells were grown as previously outlined and treated with IGF-1 (30 nM). The chromatin immunoprecipitation (ChIP) assay was performed using the ChIP-IT Express kit (Active Motif, Carlsbad, CA) according to the manufacturer's protocol. Cells were fixed with 1% final formaldehyde solution for 10 min at room temperature. After cell lysis, the cross-linked DNA was sheared to ∼200- to 1,500-bp lengths by sonication on ice using a Branson Sonifier 250-A (4 pulses of 10-s bursts at power output 3, duty cycle 50%). The sheared cross-linked chromatin was then immunoprecipitated with antibodies against Pit-1 (mouse monoclonal immunoglobulin G [IgG], number sc-25258; Santa Cruz), CBP (CBP rabbit polyclonal IgG [CBP A-22 sc-369 plus CBP C-20 sc-583]; Santa Cruz), and normal mouse IgG (sc-2025; Santa Cruz) overnight at 4°C. PCR amplification was performed using primers for the GH gene promoter region that include the GH1 and GH2 binding sites: forward, 5′-GTACCATTGCCCATAAACTTGG-3′, and reverse, 5′-GCCATCGCCACTCAGTGATCTG-3′. In addition, PCR amplification was performed using primer sets encoding regions upstream and downstream from our targeted GH promoter region. The primers upstream included the following: forward, 5′-GATCTCCAACCCCCTCTGAT-3′, and reverse, 5′-CAGCAGCTTCCCCTGTTTTA-3′. Downstream primers included the following: forward, 5′-TTGGGAGAGATTGGTCCTTG-3′, and reverse, 5′-CTGCTTATGGACGACCCATT-3′. The ChIP assay was repeated as described above using MtT/S cells pretreated with inhibitors, PD98059 (10 μM) or LY294002 (50 μM) (Cell Signaling Technology, MA), followed by IGF-1 (30 nM) in a time-dependent fashion. Immunoprecipitation was performed with antibodies to CBP. Each ChIP PCR figure is a representative result from repeat experiments with cultured and treated cells (n = 3). In vivo ChIP studies were also performed after extraction of whole pituitary glands (total = 3 per experiment) from sacrificed mice. Pituitaries were fixed in 37% formaldehyde for 15 min at room temperature and lysed using the ChIP-IT Express kit as described above. Immunoprecipitation was performed using the same antibodies as mentioned above. PCR amplification of this DNA was performed using the following primers for the GH promoter region: forward, 5′-CAGAGTATCCTACCCTTGG-3′, and reverse, 5′-CTCTAGGATGCTGGACTTGGT-3′. The corresponding ChIP PCR figure is a representative result from repeated experiments for each animal group (n = 3). Finally, qRT-PCR was performed on purified DNA to also amplify the GH promoter region. A standard curve was generated and fold enrichment of sample was calculated relative to the IgG sample and plotted.
Western blot analysis.
Immunoprecipitation and Western blot analysis were performed for CBP, phosphorylated CBP, and Pit-1/POU1F1 protein analysis in MtT/S cells treated with IGF-1 (30 nM) for different periods. Cellular protein lysates were obtained, and proteins were separated on a 10% SDS-polyacrylamide gel. Proteins were transferred to a nitrocellulose membrane and blocked using Tris-buffered saline with Tween 20 (TBST) containing 5% fat-free dry milk powder for 1 h at room temperature. The membrane was then incubated in TBST (5% milk) containing either CBP antibody (CBP antibody [A-22] sc-369 plus CBP antibody [C-20] sc-583; Santa Cruz Biotechnology, Inc., Santa Cruz, CA), Pit-1 antibody (Pit-1 antibody sc-25258; Santa Cruz Biotechnology, Inc.), or phospho-CBP antibody. Phospho-Ser436 CBP antiserum was generated against phospho-CBP peptide containing amino acids 427 to 445 of mouse CBP protein (19). Western blot analysis was repeated via the same methods as described for MtT/S cells pretreated with LY294002 or dimethyl sulfoxide (DMSO) (control) followed by IGF-1 (30 nM) for Akt, phosphorylated Akt, and actin. These experiments were repeated several times (n = 3), and each figure is representative of duplicated results.
Inhibition of MAP kinase (PD98059) and PI3 kinase (LY294002) pathways.
MtT/S cells were grown as outlined above and then treated with either PD98059 (10 μM) or LY294002 (50 μM) (Cell Signaling Technology, MA) for 30 min prior to addition of IGF-1 (30 nM). After 24 h, total RNA was harvested as described above, and qRT-PCR was performed using primers for GH. After similar treatments, cellular protein lysates were obtained for immunoprecipitation and Western blot analysis as described above to measure CBP and phosphorylated CBP protein levels.
Cloning and transfection studies. (i) pGL4.11[luc2P] vector and mGH promoter.
A 2.7-kb mouse GH promoter construct including two known Pit-1/POU1F1 binding sites was inserted into the pGL4.11[luc2P] vector (Promega). The TOPO TA cloning method was used for insertion of PCR products and to confirm the correct sequence. The PureLink plasmid filter maxiprep kit (Invitrogen, Carlsbad, CA) was used to purify plasmid DNA. Restriction enzymes SacI and XhoI, as well as sequencing of DNA, were used to verify the appropriate band size of the insert on an agarose gel. MtT/S cells were plated on poly-d-lysine 6-well plates overnight. Transfection of either the empty vector pGL4.11[luc2P] or the vector containing the mouse GH (mGH) promoter was performed using Lipofectamine 2000 as suggested by the manufacturer. At least two separate plasmid preparations were used to control for potential differences in extent of supercoiling or purity. Following transfection, medium was replaced and cells were allowed to recover overnight prior to IGF-1 treatments. Cells were then harvested and luciferase assay activity was measured using a Lumat LB9507 luminometer (Berthold, Germany). Data were analyzed before and after correction for transfection efficiency and expressed as the means + standard errors (SE). Data represent results from several repeated transfection experiments under similar conditions (n = 4).
(ii) pcDNA3.1(−) vector and CBP phosphorylation.
The pFA-CMV vector (Stratagene, La Jolla, CA), which contains the GAL4 binding domain, was used to insert the Pit-1/POU1F1 sequence. Insertion and confirmation were completed as previously described. Transfection of the construct into MtT/S cells was performed along with cotransfection of the pFR-Luc reporter (Stratagene) and a pcDNA3.1(−) vector (Invitrogen) containing either wild-type CBP or a mutated CBP (S436A) fragment as previously described. Transfected cells were treated with IGF-1 (30 nM) over 24 h. Luciferase activity was measured and data were analyzed as described above. Transfection experiments were repeated several times (n = 4), and the representative data were graphed.
Genotyping of S436A mice.
A C57BL/6J mixed-background strain, bearing a heterozygous state (S436A/WT), was crossed with heterozygous mice to create control and homozygous mice for this study. The generation of CBP (S436A) mice has been described previously (56). For the auxological cohort, the majority of mice generated for this study were from heterozygous pairings (S436A+/− × S436A+/−) (6/13 litters). The S436A mutation was identified on genomic tail DNA using the following oligonucleotide primers: Common, 5′-GAC CTT GTT GCT TTG CAC TTG TTC-3′; Match, 5′-CTC CCT TTG AAA AAT GCC AG-3′; and Mismatch, 5′-CTC CCT TTG AAA AAT GCC GC-3′. Reactions proceeded for 32 cycles of denaturation at 95°C for 30 s, annealing at 61°C for 45 s, and extension at 72°C for 45 s, with a final extension at 72°C for 7 min. All reactions were performed under standard conditions using 100 ng of genomic DNA, 7.5 nmol of primers, buffer (2.5 μl of 15 nM MgCl2), and 0.5 μl of Taq polymerase per reaction. Control mice had a band at the Match primer only, S436A mice had a band at the Mismatch primer only, and heterozygous mice (S436A+/−) had a band at each.
Auxological and hormonal studies.
A microtattooing strategy was used to label pups at 3 to 5 days of life (DOL) (Animal Tattoo Ink; Ketchum Manufacturing, Inc., Brockville, Ontario, Canada). However, after rejection by dams of several litters, and preliminary data showing no differences in weight or length by 21 days, pups were instead given ear tags at day of weaning (DOL no. 21). Total body length (naso-anal) was recorded with steel vernier calipers, and total body weight was obtained by a single electronic scale. Weight was recorded weekly for 15 weeks and then every 21 days until 30 weeks of age.
Blood was obtained by nonterminal submandibular puncture. This experimental protocol was designed to standardize our testing of GH levels while minimizing potential environmental effects that could alter GH levels. Given the pulsatility of GH, a random measurement can lead to variable findings. Our experiments were designed to measure GH levels at a similar time of day and under similar environmental conditions. Previous studies with wild-type mice indicate that stress as well as insulin-induced hypoglycemia may potentially lower GH levels; however, fasting appeared to yield no alteration in levels (38). In addition, insulin-induced hypoglycemia in mice demonstrated no changes in hypothalamic expression of GHRH and SRIF mRNA levels (42). Male animals 6 to 8 weeks of age were fasted overnight for 16 h, and samples were collected in the morning. Stimulated GH levels were obtained at 6 to 8 weeks of age without fasting. Stimulated values were obtained 15 min after intraperitoneal injection of 20 μg of GRF 1-29 (growth hormone releasing factor fragment 1-29 amide), which targets the pituitary to release GH. Random serum samples were obtained at 6 to 17 weeks of age and analyzed for GH levels using the xMAP technology (Millipore, Billerica, MA). This assay and this technology have been previously utilized and published by our group (35). A standard curve was generated using 5-fold serial dilutions of the GH standard cocktail provided by the vendor. Standards and samples were incubated with the antibody-coated beads on a microplate shaker overnight at 4°C and washed three times using a vacuum manifold apparatus. Detection antibody was then added to the wells, and then the plates were incubated on a microplate shaker at room temperature for 30 min. Streptavidin-phycoerythrin solution was then added for an additional 30 min of incubation at room temperature, and then the plates were placed on a microplate shaker. The plates were then washed three times, and sheath fluid was added to each well. Beads were resuspended on a microplate shaker for 5 min. The plates were then read on the Luminex 200IS system with xPonent software. Data were analyzed with a 5-parametelogistic curve fitting. The limit of detection for the assay for GH was 0.048 ng/ml, and the maximum level was 150 ng/ml; the interassay coefficient variance ranged from 0.043 to 14.75%, and the intra-assay coefficient variance ranged from 6.8 to 16.9%. Average values were plotted using GraphPad Prism software. Measurement of serum IGF-1 required 2 μl of serum also using the xMAP technology (Millipore). A standard curve was generated as described above, and the limit of detection for the assay for IGF-1 was 3.2 pg/ml. The interassay variation was less than 10% and intra-assay variation less than 5%. The assay procedure and data analysis were performed as described above using IGF-1 detection antibody beads. Average values were plotted using GraphPad Prism software.
Body composition studies.
The EchoMRI-100 quantitative nuclear magnetic resonance (QNMR) system (Echo Medical Systems, Houston, TX) was used to measure whole body composition parameters in S436A and control mice between 15 and 18 weeks of age. Direct measurements were taken in vivo of fat mass, lean mass, free water, and total body water. Measurements were performed in triplicate.
Animal care.
All the animal procedures were performed according to the Johns Hopkins University protocol approved by the Animal Care and Use Committee.
Data analysis.
Results of reverse transcription-PCR (RT-PCR) are expressed as fold change in gene expression relative to that of the untreated control. Transfection studies are reported as fold change in luciferase expression relative to those of untreated groups. Statistical analyses were performed using the Student t test for comparisons between two groups. Mann-Whitney U test was used for rank sum tests. Error bars represent standard errors of the means (SEM). Statistical analyses were performed using GraphPad InStat version 3.0 for Windows NT (GraphPad Software, San Diego, CA). Differences were considered significant at a P value of <0.05 unless otherwise noted.
RESULTS
IGF-1's effect on the GH, CBP, and Pit-1/POU1F1 mRNA levels.
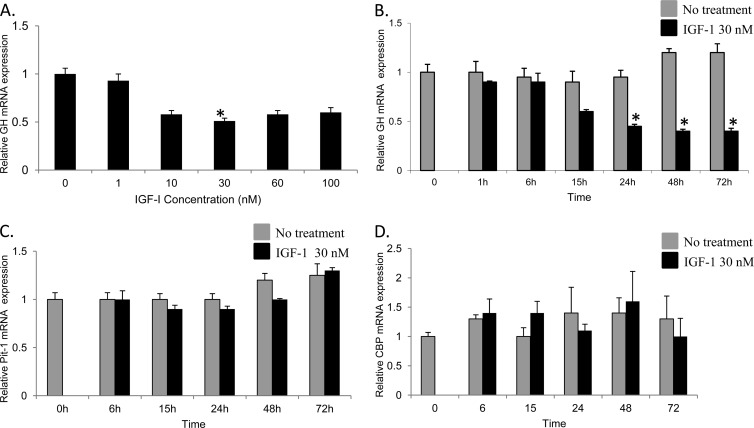
Our studies were conducted in vitro using the rat MtT/S somatotroph cell line developed by Inoue et al. (21). These cells closely resemble primary pituitary somatotrophs, as their GH secretion is stimulated by growth hormone releasing hormone (GHRH) and inhibited by IGF-1 (31, 33). The effect of IGF-1 treatment on the expression of GH mRNA levels was determined using quantitative RT-PCR (qRT-PCR) in both a concentration-dependent experiment for a 24-h treatment period and a time-dependent experiment with a constant IGF-1 concentration for up to 72 h. Figure 1A illustrates maximal suppression of GH mRNA at an IGF-1 concentration of 30 nM (P < 0.05) after 24 h. Subsequently, the effect of IGF-1 inhibition of GH mRNA expression relative to the 36B4 housekeeping control gene was demonstrated to be time dependent. Figure 1B demonstrates significant suppression of GH mRNA levels as early as 24 h (P < 0.05), with the maximal effect observed at 48 h using 30 nM IGF-1 treatment. These data indicate a >50% decrease in the mRNA levels compared with that in the corresponding nontreated control.
Fig 1.
Relative levels of GH, Pit-1, and CBP mRNA in MtT/S cells after IGF-1 treatment. (A) Relative GH gene expression was measured in MtT/S cells after treatment with IGF-1 for 24 h at various concentrations. The graph demonstrates maximal inhibition at 30 nM. (B) MtT/S cells were treated with IGF-1 (30 nM) and harvested, and RNA was extracted at different time points. At 24 h, there was a significant decrease in GH mRNA that persisted up to 72 h. (C and D) Relative expression of Pit-1 and CBP mRNA was not significantly different after IGF-1 treatment at various time points. *, P < 0.05. Shown are means + SEM.
In addition, we measured the changes in relative Pit-1 gene expression over time after IGF-1 treatment (30 nM). Despite treatment with IGF-1, the relative expression of Pit-1/POU1F1 was not significantly different from that of the untreated cells (Fig. 1C). These data support previous suggestions that IGF-1's inhibitory effect on GH is not mediated by a direct effect on Pit-1/POU1F1 expression (12). Furthermore, CBP mRNA expression was also measured after treatment with IGF-1 (30 nM) (Fig. 1D). Similar to results for Pit-1/POU1F1, no significant difference in expression was noted at any time point.
IGF-1 inhibits expression in transfected MtT/S cells.
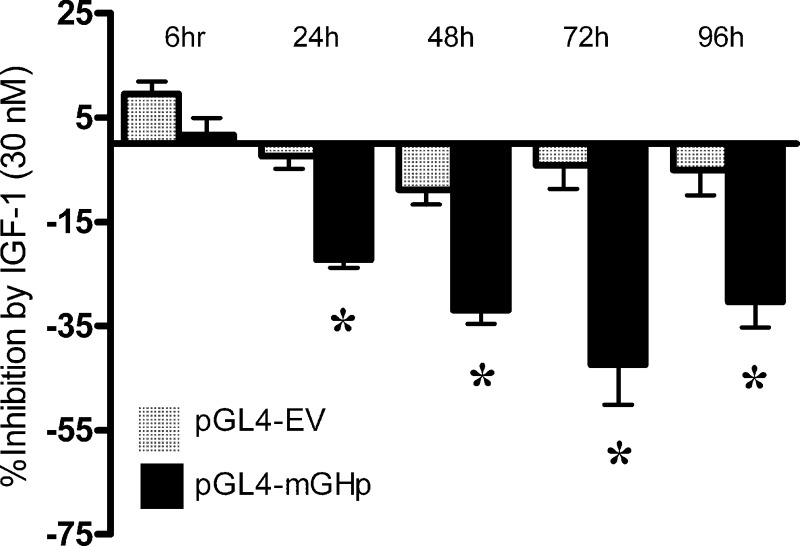
IGF-1's ability to inhibit activation of the GH promoter was further studied in vitro after transfecting MtT/S with the pGL4.11 luciferase expression vector containing a 2.7-kb fragment of the mouse GH promoter. Transfected cells were treated with IGF-1 (30 nM) in a time course experiment while a group of untreated cells served as controls. Figure 2 illustrates that after 24 h of IGF-1 treatment, there was a 22.2% relative decrease in luciferase expression (P ≤ 0.001). At 72 h after IGF-1 treatment, we noted a maximal inhibitory response (42.8% decrease; P ≤ 0.001), which also persisted at 96 h (P ≤ 0.001).
Fig 2.
IGF-1 inhibits expression of a GH promoter luciferase plasmid in MtT/S cells. The pGL4.11[lucP] vector containing a 2.7-kb fragment with the mouse GH promoter (pGL4-mGHp) was transfected into MtT/S cells overnight. After recovery, a subgroup of cells were treated with IGF-1 (30 nM) for various time periods. This experiment was also performed in cells transfected with pGL4.11[lucP] empty vector (pGL4-EV). Data are shown as the percent luciferase inhibition after IGF-1 treatment at each time point. Significant inhibition of luciferase expression was first noted at 24 h and persisted through the remaining time points. *, P < 0.05. Shown are means + SEM.
IGF-1 modulates CBP and Pit-1/POU1F1 binding to the GH promoter.
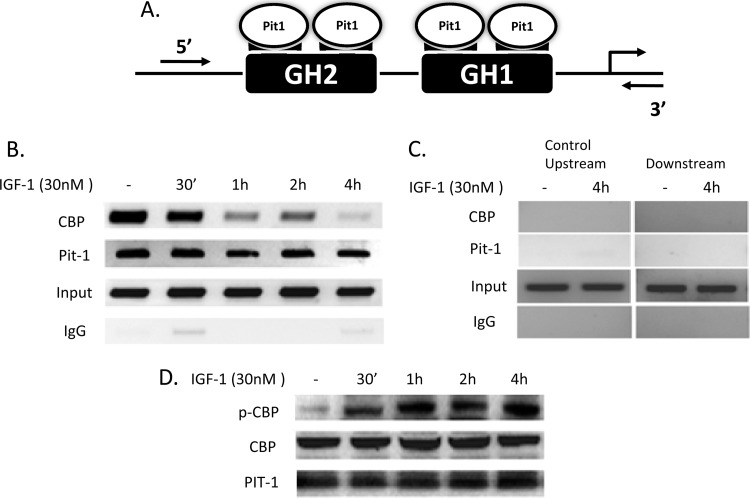
GH expression is dependent upon activation of the proximal 190-bp GH gene promoter region in the 5′ flanking region of the GH gene (10, 44). This promoter region contains two sites, referred as GH1 and GH2, both of which are highly conserved among species (44). These sites serve as targets for binding Pit-1/POU1F1, which is both specific and necessary for regulated GH promoter activity. Pit-1/POU1F1, a member of the POU family of transcription factors, contains two highly conserved domains, termed POU-specific and POU-homeo, that are required for DNA binding on the GH and PRL genes (36). Figure 3A illustrates how Pit-1/POU1F1 binds to the GH1 and GH2 sites as a homodimer on the proximal GH promoter region. Furthermore, the interaction of CBP with Pit-1/POU1F1 has been documented and is necessary for Pit-1-dependent activation of the GH promoter (15).
Fig 3.
IGF-1 treatment of MtT/S cells results in a decrease in CBP binding and an increase in phosphorylated CBP in GH promoter region. (A) Diagram of the GH promoter illustrating the binding of PIT1 as a homodimer to each of the GH binding sites, GH1 and GH2. 5′ and 3′ primers flanking the proximal GH promoter, which includes Pit-1 binding sites, were used. (B) ChIP assay was performed using MtT/S cells after IGF-1 treatment with specific antibodies to Pit-1 or CBP. There were no changes in Pit-1 binding; however, CBP binding decreased after 1 h and persisted through 4 h. (C) As a control to illustrate specificity of Pit-1 binding sites, ChIP PCR was performed using primers located upstream and downstream of the GH promoter region. No CBP or Pit-1 binding was detected in these regions. (D) Immunoblotting was performed on MtT/S cells treated with IGF-1 to determine levels of phosphorylated CBP (p-CBP), CBP, and Pit-1. No changes in protein were noted for CBP or Pit-1, but there was an increase in p-CBP during the time course.
In order to determine whether IGF-1 treatment induces changes in binding of Pit-1/POU1F1 or CBP to the GH1 and GH2 sites on the GH gene promoter, chromatin immunoprecipitation (ChIP) assays were performed. We observed enrichment of the GH promoter DNA using anti-Pit-1 and anti-CBP antibodies in comparison to the signal derived from the negative control, immunoglobulin G (IgG), and positive control, total chromatin (input). Figure 3B illustrates that IGF-1 treatment acutely decreased CBP binding to the proximal GH gene promoter after 30 min, while Pit-1/POU1F1 binding was not altered. These data further suggest that IGF-1 inhibition is not mediated either by altered expression of Pit-1/POU1F1 or by its binding to the GH promoter. In order to demonstrate the specificity for Pit-1/POU1F1 binding at the GH promoter, two control ChIP PCR experiments were performed using primers designed both upstream and downstream of the targeted GH promoter region. Figure 3C demonstrates no binding for either CBP or Pit-1/POU1F1 in these areas. These ChIP analyses suggest a mechanism of inhibition whereby IGF-1 induces CBP disruption with Pit-1/POU1F1 bound to the GH gene promoter, resulting in a decrease in GH gene expression.
Western blot analysis of IGF-1's effect on Pit-1/POU1F1, CBP, and phosphorylated CBP.
Western blot analysis was performed using antibodies to Pit-1, CBP, and phosphorylated CBP with protein obtained from MtT/S cells treated with IGF-1 (30 nM) for different amounts of time. Figure 3D demonstrates IGF-1 induction of CBP phosphorylation after 30 min of treatment and continuing phosphorylation throughout the course of the experiment. In contrast, there was no change in either Pit-1/POU1F1 or CBP levels for up to 4 h after IGF-1 treatment. These findings in conjunction with those in Fig. 3B suggest that IGF-1 mediates CBP phosphorylation, leading to decreased binding to the GH promoter.
Determination of IGF-1 intracellular signaling pathway.
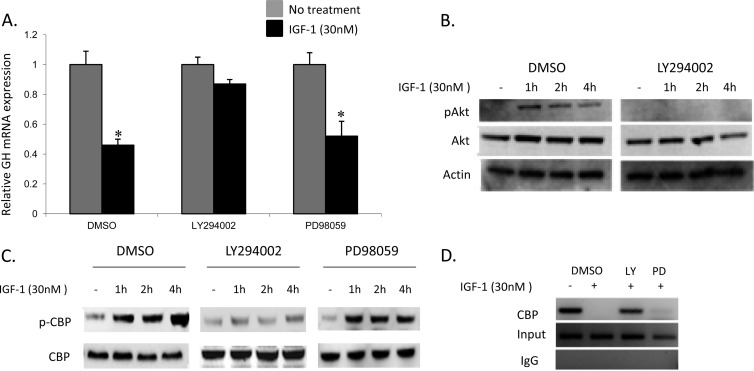
IGF-1 binding to the IGF-1R has been shown in somatotroph cells to activate two major intracellular postreceptor signaling pathways: the MAP kinase- and PI3 kinase-mediated cascades (34). In order to determine whether the inhibitory effects of IGF-1 were specifically mediated by one of these pathways, MtT/S cells were pretreated with selective inhibitors followed by IGF-1 treatment; relative GH mRNA expression levels were determined by qRT-PCR from harvested cells. Cells were pretreated for 30 min with either PD98059 (10 μM), a noncompetitive inhibitor of the MAP kinase pathway, or LY294002 (50 μM), a specific inhibitor of the PI3 kinase pathway, followed by IGF-1 treatment (1, 48). Cells treated with DMSO were used as controls. Figure 4A demonstrates relative GH mRNA expression before and after IGF-1 and inhibitor treatment. In the IGF-1-treated DMSO group there is, as expected, a significant decrease in the relative GH mRNA expression compared to that in the untreated group (0.46 ± 0.01; P < 0.001). There is a loss of significant inhibition, however, in cells treated with LY294002 (0.87 ± 0.04; P = 0.09). This is in contrast to cells treated with PD98059, in which significant inhibition is unchanged by IGF-1 relative to the control (0.52 ± 0.07; P < 0.001). These experiments demonstrate that IGF-1 inhibition is mediated via the PI3 kinase intracellular signaling pathway. No significant differences in relative GH gene expression were found among the three groups not exposed to IGF-1 treatment. In order to further clarify the importance of this pathway, Western blot analyses using antibodies to CBP were performed in MtT/S cells with and without LY294002 treatment. Each group was treated with IGF-1 (30 nM) in a time-dependent manner (Fig. 4B). In the untreated group (DMSO), IGF-1 treatment led to phosphorylation of Akt (pAkt). In the LY294002-treated cells, however, no pAkt was detected despite IGF-1 treatment over the time course.
Fig 4.
IGF-1 inhibits GH gene expression via the PI3 kinase pathway. (A) MtT/S cells were treated with either LY294002 (PI3 kinase inhibitor), PD98059 (MAP kinase inhibitor), or DMSO (control). In each group, a subset of cells was treated with IGF-1 (30 nM). Relative GH mRNA levels were measured with qRT-PCR. Significant inhibition of GH mRNA was demonstrated in the control cells as well as those treated with PD98059. Loss of inhibition of GH mRNA expression by IGF-1 was seen in cells treated with LY294002. (B) Immunoblotting was performed on IGF-1-treated MtT/S cells with and without treatment with LY294002 to determine protein levels of Akt and phosphorylated Akt (pAkt). Cells treated with LY294002 demonstrate a loss of pAkt levels. (C) Immunoblotting of IGF-1-treated MtT/S cells for phosphorylated CBP (p-CBP) and CBP demonstrate loss of protein levels after treatment with LY294002 but not PD98059. (D) ChIP assay performed on MtT/S cells treated with IGF-1 for 4 h, showing that either DMSO or PD98059 pretreatment led to loss of CBP binding. IGF-1-treated cells with LY294002 pretreatment, however, demonstrate preservation of CBP binding at the GH promoter. *, P < 0.001. Shown are means + SEM.
We subsequently determined the levels of expression of both CBP and phosphorylated CBP after treatment with PD98059 or LY294002. Figure 4C demonstrates that LY294002 treatment prevented IGF-1-induced CBP phosphorylation compared with that in the control cells (DMSO), whereas treatment with PD98059 resulted in increased phosphorylated CBP protein after IGF-1 treatment, similar to that in control cells. Finally, ChIP assays were repeated in MtT/S cells pretreated with DMSO (control), LY294002, or PD98059 followed by IGF-1 treatment (Fig. 4D). A loss of CBP binding is seen in the IGF-1-treated DMSO and PD98059 groups; however, no change in CBP binding is seen in the LY294002 group after IGF-1 treatment. These results further demonstrate that IGF-1's effects on CBP binding are mediated via the PI3 kinase pathway.
IGF-1 phosphorylation of CBP disrupts Pit-1/POU1F1 interaction at the GH promoter.
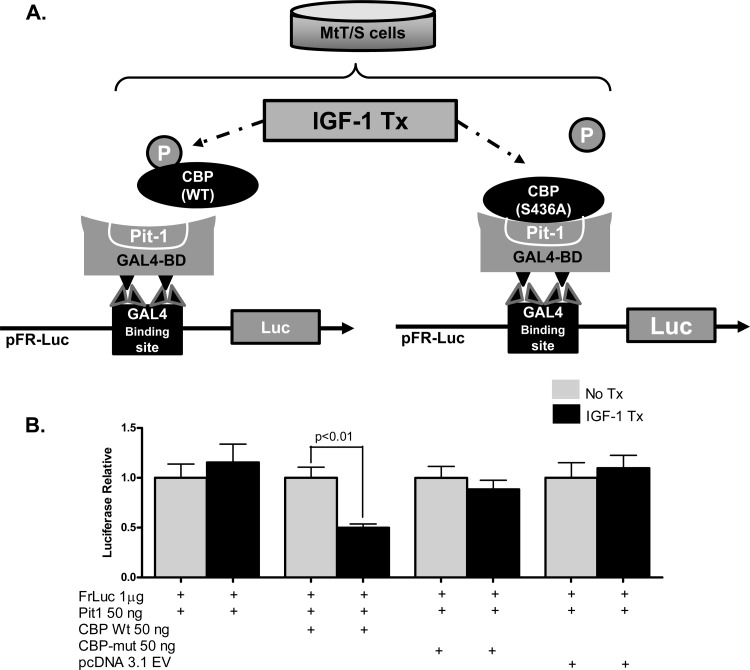
The next series of experiments were designed to determine whether disruption of CBP phosphorylation would abolish the inhibitory effects of IGF-1 on GH expression. We utilized a CBP mutant vector (S436A) in which the serine located at 436 is mutated to an alanine, thus rendering the CBP unable to be phosphorylated. Figure 5A illustrates the strategy designed to explore differences in reporter luciferase expression after IGF-1 treatment in MtT/S cells containing either the wild type or the mutant CBP construct. No significant differences in the relative levels of expression were noted in control experiments, which included cells transfected with only the FrLuc reporter and pFA-CMV vector containing Pit-1/POU1F1 with and without IGF-1 treatment (Fig. 5B). Luciferase expression in MtT/S cells transfected with wild-type CBP, however, demonstrated 50% inhibition after IGF-1 treatment (P ≤ 0.001), while transfection of the mutant CBP (S436A) construct, which cannot be phosphorylated, demonstrated no significant differences in luciferase expression after IGF-1 treatment (Fig. 5B). An additional control experiment using pcDNA3.1(−) empty vector revealed no differences in relative expression after IGF-1 treatment. These experiments suggest that IGF-1 inhibition is mediated by phosphorylation of CBP, which then leads to disruption of the Pit-1/CBP interaction at the GH promoter Pit-1/POU1F1 binding sites.
Fig 5.
IGF-1-mediated phosphorylation of CBP disrupts the Pit-1/CBP interaction. (A) Diagram of the experimental MtT/S cell transfection strategy used to determine the significance of CBP phosphorylation. Cotransfection of the pFR-Luc reporter vector containing GAL4 binding sites, wild-type (WT) Pit-1 inserted into a pFA-CMV vector containing the GAL4 binding domain (GAL4-BD) sites, and wild-type CBP inserted into a pcDNA3.1(−) vector demonstrated measureable luciferase expression. The interaction of Pit-1 and CBP is represented in the diagram. Previous data suggest that IGF-1R signaling leads to phosphorylation of CBP and disrupts the Pit-1/CBP complex; this would have led to decreased luciferase expression in these experiments. This mechanism of inhibition was tested by using a mutant CBP, CBP (S436A), which cannot be phosphorylated. (B) IGF-1 treatment of transfected cells with Pit-1 and WT CBP leads to a significant decrease in relative luciferase expression. Transfections using mutant CBP (S436A) show no change in luciferase expression, therefore demonstrating a loss of IGF-1 inhibition. No significant differences in luciferase expression were seen in cells treated with pcDNA3.1 EV, which served as a control. Shown are means + SEM.
Feedback within the GH axis is altered in CBP (S436A) knock-in mice.
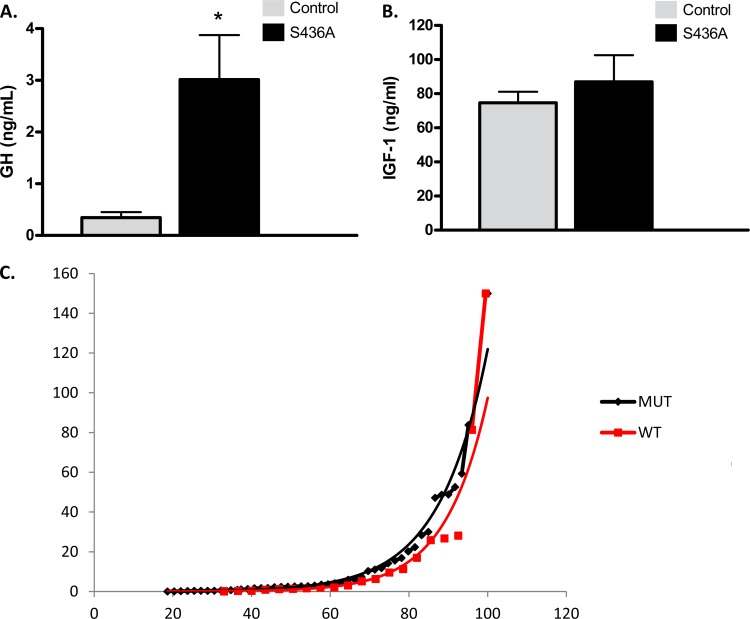
In order to further explore our findings in vivo and correlate the role of CBP in somatotroph regulation, we studied the GH axis in CBP (S436A) knock-in mice, which contain a mutation in CBP lacking the ability to be phosphorylated. In order to control for variability secondary to the pulsatility of GH secretion, animals 6 to 8 weeks of age were fasted overnight for 16 h and samples were collected in the morning. Figure 6A illustrates the average fasting serum GH levels to be higher in S436A mice than in controls (3.01 ± 0.86 ng/ml versus 0.34 ± 0.1 ng/ml; P < 0.005). Although S436A mice had a higher average serum IGF-1 level, this was not statistically significant (Fig. 6B). Further characterization of growth hormone profiles between groups was accomplished by measuring random growth hormone levels obtained at different points in the light/dark cycle (10 a.m., 3 p.m., 5 p.m., and 10 a.m., and 3 p.m. for mice housed in a reverse light/dark cycle) and under minimum stress (4). The average serum GH levels remained higher in S436A mice than in controls (Mann-Whitney U = 729.5; P = 0.17). When plotted as a rank profile, the S436A mice had fewer samples in the nadir range (18.6% versus 33%), and values in the intermediate range were higher in S436A mice (Fig. 6C).
Fig 6.
CBP (S436A) knock-in mice have elevated serum GH levels. (A) Serum GH values from fasted male mice are higher in the CBP (S436A) (n = 34) mice than in control mice (n = 31), (3.01 ± 0.86 ng/ml versus 0.34 ± 0.1 ng/ml; *, P < 0.005). (B) Measured serum IGF-1 levels in CBP (S436A) mice were generally higher than in control mice, but the difference was not statistically significant. (C) Rank plot analysis: the x axis shows the rank percentage. This percentage reflects the proportional number of values with a lower GH concentration versus the y axis, which shows the value of serum GH levels (ng/ml). When plotted as rank profile, the S436A mice had fewer samples in the nadir range (18.6% versus 33%), and values in the intermediate range were higher in S436A mice. Both groups had random peak values detected that equaled the limit of detection (150 ng/ml). Shown are means + SEM.
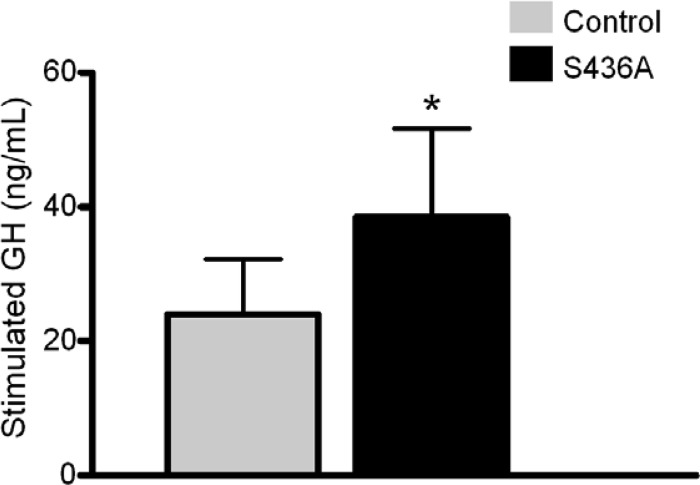
We next measured baseline (t = 0) and stimulated (t = 15 min) GH values after administration of GRF 1-29 (Fig. 7). S436A mice demonstrated elevated stimulated GH serum levels compared to those in control mice (38.5 ± 13.18 ng/ml versus 24.0 ± 8.22 ng/ml; Mann-Whitney U = 232.5; P = 0.02). Correlating with serum studies, CBP (S436A) knock-in mice had a 2.2-fold-higher relative expression in pituitary GH mRNA levels than control mice (P = 0.03 [Fig. 8A]). In addition, there was a significant decrease in relative hypothalamic GHRH mRNA levels noted in the knock-in mice (P = 0.02, Fig. 8B).
Fig 7.
CBP (S436A) knock-in mice have higher serum GH levels after GHRH stimulation. Stimulated serum GH values were obtained 15 min after intraperitoneal injection of GRF 1-29 [CBP (S436A), n = 20; control, n = 37)]. Serum GH levels were higher in S436A mice (38.5 ± 13.18 ng/ml versus 24.0 ± 8.22 ng/ml; *, P < 0.05). Shown are means + SEM.
Fig 8.
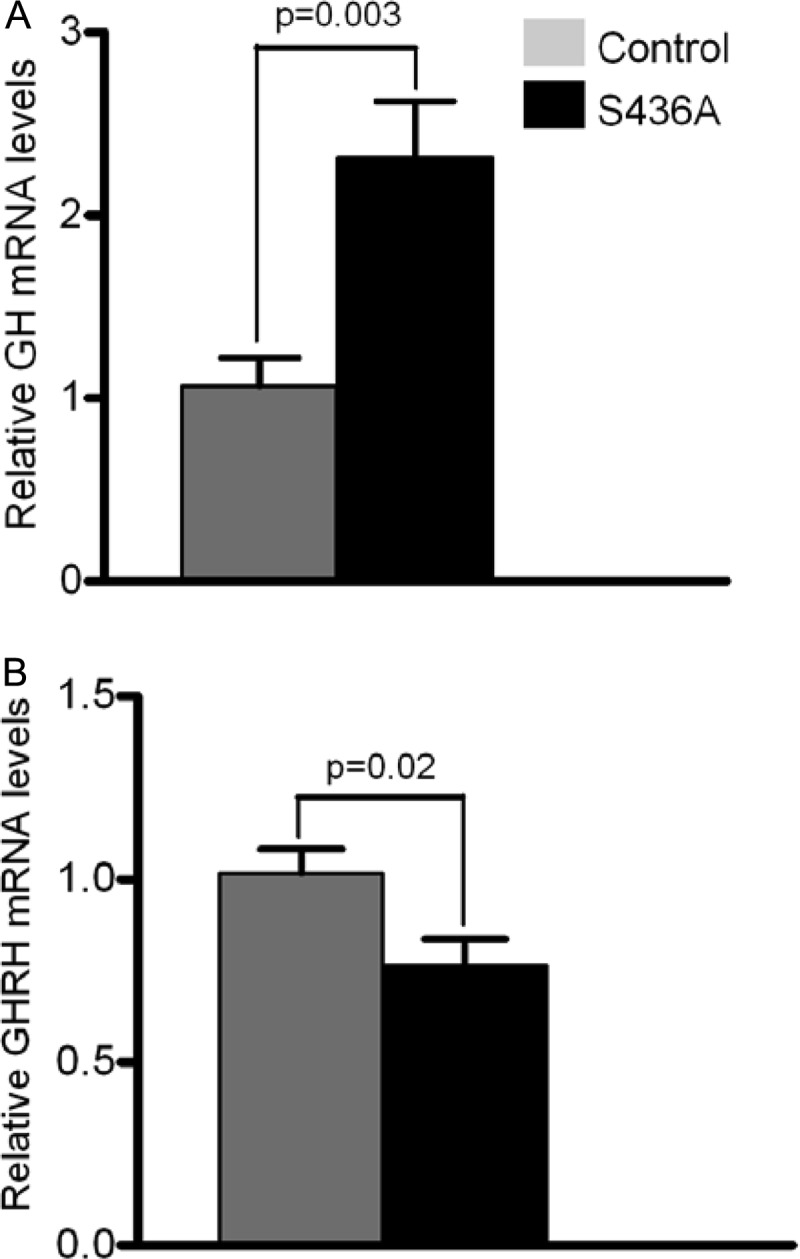
CBP (S436A) knock-in mice have significantly higher levels of pituitary GH gene expression (A) versus a significant decrease in relative expression of hypothalamic GHRH expression (B) compared to controls. Shown are means + SEM.
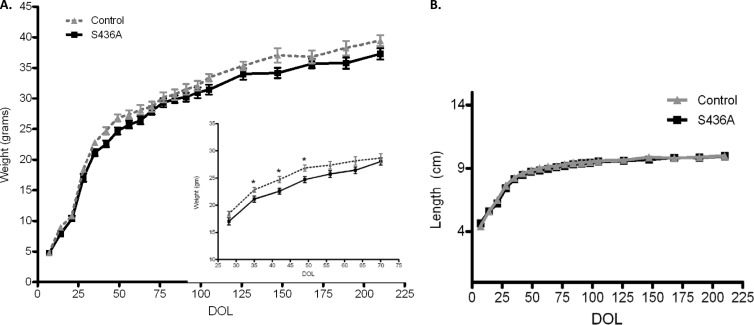
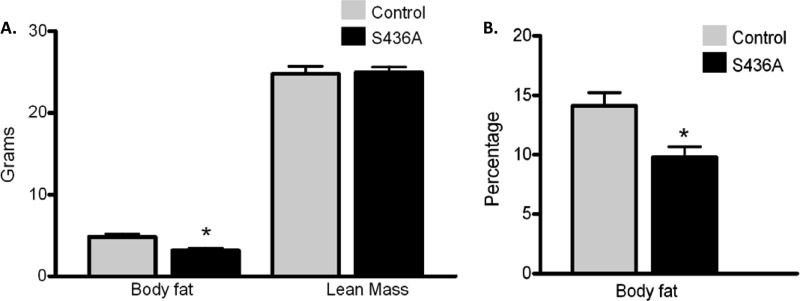
Anthropometric mouse studies included body weight and length (nose to anus) measurements starting from 3 to 5 days after birth to 30 weeks of age (Fig. 9). Although no significant differences in weight or length at weaning (21 to 23 days) were noted between the two groups for both sexes, male S436A mice weighed significantly less than control male mice at 5, 6, and 7 weeks of age (5 weeks, 20.72 ± 0.56 g versus 22.88 ± 0.46 g [P < 0.009]; 6 weeks, 22.60 ± 0.53 g versus 25.0 ± 0.7 g [P < 0.0109]; and 7 weeks, 24.71 ± 0.57 g versus 27.02 ± 0.725 g [P < 0.018]). This difference did not continue to be significant; however, there was a persistent 2-g difference through 30 weeks between groups (30-week average for S436A mice, 37.3 ± 0.94 cm versus 39.45 ± 0.90 cm; P = 0.12). In addition, no significant differences in the rate of weight gain overall was noted (birth to 30 weeks). For male mice, there were no significant differences in length between knock-in and control groups. The calculated weight/length ratio between knock-in and control groups was found to be significant only between weeks 5 and 7 (P < 0.02). Finally, body composition studies completed between 15 and 18 weeks of age found that total body fat was significantly lower in male S436A mice than in control mice (3.17 ± 0.28 g versus 4.80 ± 0.40 g; P < 0.003 [Fig. 10A]). There was a significant difference between percent body fat of male S436A mice and control mice (9.78% ± 3% versus 14.11% ± 2.9%; P < 0.007 [Fig. 10B]). No significant differences in lean mass were reported between the two groups (24.92 versus 24.75; P = 0.87 [Fig. 10A]).
Fig 9.
Anthropometric studies in CBP (S436A) knock-in mice. (A) Weight gain velocity was consistent throughout 3 to 30 weeks of age for both groups of mice [CBP (S436A), n = 20; control, n = 13)]. At weeks 5, 6, and 7, S436A mice had significantly lower weights than controls (inset). S436A mice continued to consistently weigh less than controls, although the difference was no longer significant. (B) Naso-anal lengths were not significantly different between groups during the study. *, P < 0.05. Shown are means + SEM.
Fig 10.
CBP (S436A) knock-in mice have decreased body fat. (A) Echo MRI was used to measure body fat, fat percentage, water content, and lean mass in control (n = 8) and S436A mice (n = 12). The S436A mice have lower total body fat than controls. (B) S436A mice accordingly have lower body fat percentages than control mice. *, P < 0.05. Shown are means + SEM.
IGF-1 disrupts CBP binding at the GH promoter in vivo.
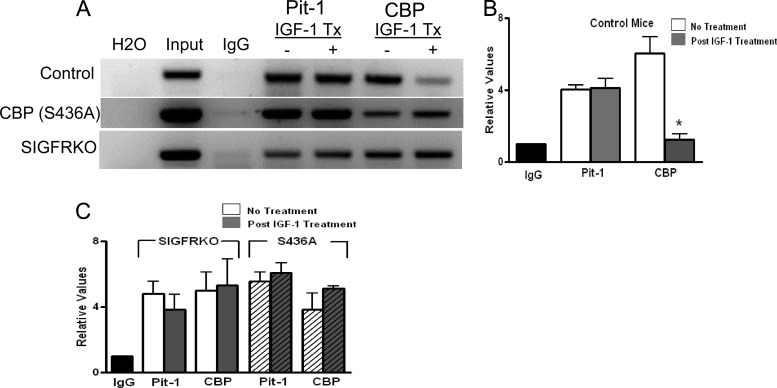
In order to validate in vitro studies, which demonstrate the importance of CBP in IGF-1-mediated inhibition, in vivo ChIP using pituitary tissue was performed to study the changes in binding of Pit-1/POU1F1 and CBP at the GH promoter with IGF-1 treatment. Two different mouse models, in addition to control animals, were used: the somatotroph IGF-1R knockout (SIGFRKO) mice, a cell-specific strain of knockout mice in which the somatotroph lacks the IGF-1R, and CBP (S436A) knock-in mice (19, 35). Gel electrophoresis of PCR-amplified ChIP DNA is pictured in Fig. 11A and demonstrates that IGF-1 treatment leads to a decrease in CBP binding to the GH promoter, but no change in Pit-1/POU1F1 binding in control mice. In both the SIGFRKO and CBP (S436A) mice, however, no change in CBP or Pit-1/POU1F1 binding after IGF-1 treatment is noted. Quantitative PCR was also performed to calculate relative changes of immunoprecipitated DNA between mice. Figure 11B illustrates a significant 4.89-fold decrease in CBP expression in mice treated with IGF-1 (P < 0.001). No significant changes in DNA for Pit-1/POU1F1 or CBP were noted in the SIGFRKO or S436A knock-in mouse model (Fig. 11C). These findings demonstrate in vivo the critical role of IGF-1R signaling (SIGFRKO mouse model) in targeting the POU1F1/CBP complex on the GH promoter and the importance of CBP phosphorylation (S436A knock-in mouse model) in mediating IGF-1 feedback.
Fig 11.
In vivo pituitary ChIP assay shows that IGF-1 disrupts CBP binding at the GH promoter. (A) Binding of Pit-1 and CBP at the proximal GH promoter in mouse pituitary tissue is shown on a 1% agarose gel from PCRs of DNA without or with IGF-1 treatment (IGF-1 Tx) (− or +, respectively). In addition to those of control mice, pituitaries from two other mouse models were studied: SIGFRKO, in which the somatotroph lacks the IGF-1R, and the CBP (S436A) knock-in, in which CBP cannot be phosphorylated at the S436 position. These experiments were repeated in mice treated with IGF-1. Decreased binding of CBP was found only in control animals treated with IGF-1. (B) qRT-PCR was used to measure relative amounts of binding of Pit-1 and CBP in control mice with and without IGF-1 treatment. There was a decrease in CBP binding in control mice treated with IGF-1 but not Pit-1. (C) In SIGFRKO and S436A mice, there were no changes in binding for either Pit-1 or CBP after treatment with IGF-1. *, P < 0.001. Shown are means + SEM.
DISCUSSION
We have investigated the role of CBP as an important target mediating IGF-1 negative feedback to the somatotroph. This regulation affects both GH gene expression and secretion and ultimately impacts both mammalian growth and metabolism. Initial in vitro studies demonstrated direct inhibition of GH gene expression in the somatotroph by IGF-1, as well as a novel mechanism of regulation by IGF-1R signaling that is mediated through phosphorylation of CBP and the disruption of the POU1F1/CBP complex. In vivo studies in the CBP (S436A) knock-in mouse model, in which CBP is unable to be phosphorylated at S436, demonstrated a loss of negative feedback resulting in elevated serum GH levels and an exaggerated somatotroph response to GHRH. Interestingly, higher GH levels were associated with a metabolic phenotype of decreased body fat mass.
Inhibition of GH gene expression after treatment with IGF-1 has been previously described for several somatotroph cell lines, although pitfalls in assuming that such cells are equivalent to the mature somatotroph are notable (12). The MtT/S cells, however, in addition to their appearance as a mature somatotroph and containing many GH secretory granules, respond to GHRH stimulation and are sensitive to estrogen (21). Therefore, characterization of this in vitro model system is useful for studies designed to delineate mechanisms of GH gene expression and secretion. Furthermore, the inhibitory effect of IGF-1 in vitro as depicted in Fig. 1 correlates with previous in vivo mouse models in which the GH axis is perturbed. In particular, the mouse model overexpressing IGF-1 clearly demonstrates a suppression of serum GH production in these mice similar to the magnitude seen in the MtT/S cell line (27).
Since Pit-1/POU1F1 and CBP have been shown to be critical requirements for GH gene expression and secretion, initial studies to determine changes in expression levels after IGF-1 treatment were performed. These studies demonstrated no changes in absolute levels of mRNA or protein for either Pit-1/POU1F1 or CBP in response to IGF-1, despite significant decreases in GH mRNA levels. However, further studies revealed that IGF-1 signaling through the PI3 kinase pathway was responsible for phosphorylation of CBP and subsequent dissociation from the GH promoter. Hence, the ability of CBP to promote Pit-1/POU1F1-induced increases in GH gene expression is reduced after stimulation of the IGF-1R signaling pathway. It is important to recognize that the artificial nature of the in vitro experiments makes it difficult to precisely define the physiologic parameters of the response. The differences in timing between activation of IGF-1-mediated signaling events and binding of target proteins to DNA precede gene expression and were not seen in our analysis until 24 h by the artificial transfection system versus 15 h by native gene expression (Fig. 1, 2, and 3). The nonphysiologic natures of the experiments, however, make timing and magnitude of response difficult to define precisely. This limitation in defining the mechanism and physiologic effect resulting from negative regulation was addressed by our in vivo experiment that utilized two mouse models with disrupted signaling pathways. More specifically, the loss of this IGF-1-mediated inhibition was found in mouse models that either have disrupted IGF-1R signaling in the somatotroph (SIGFRKO) or express a CBP mutant that lacks the ability to be phosphorylated at S436 (S436A). These studies not only support the role of IGF-1 negative feedback in the somatotroph but also delineate specific targets that are important for regulation of the GH axis.
The CBP (S436A) knock-in mouse provided a unique opportunity to not only investigate GH regulation but also further delineate CBP's role in vivo. In particular, our group has demonstrated that CBP phosphorylation can result in a variable cellular response that is dependent on the target DNA (55). In addition, as mentioned above, our earlier work has shown that CBP may act independently of CREB as a cofactor for Pit-1/POU1F1-dependent activation of the GH promoter by the GHRH signaling (15).
The evaluation of GH levels in mice is often difficult to perform given several limitations such as GH pulsatile release, limited blood volume from serial sampling, the short GH half-life, and the effects of stress, which rapidly reduce serum GH levels (46, 50). Nonetheless, in the fasting state, the basal secretion of GH in S436A mice was significantly higher, which in the context of our studies represents an alteration in IGF-1 negative feedback. Our findings were further supported by utilizing the previously reported method of rank plot analysis to analyze the collected GH profiles (50). Using this method, we noted a trend to higher serum GH in S436A mice, fewer values in the nadir range, and more values in the intermediate range. This suggests that the S436A mice may have either more frequent or wider pulses of GH. In order to detect subtle differences in GH profiles using the rank plot analysis (of approximately 20%), up to 250 samples may be needed; hence, it is possible that these experiments have not reached sufficient power. Nevertheless, the presence of elevated serum GH levels in these mice correlates with the expected loss of inhibition to the somatotroph.
It was initially found that when exposed to GHRH, the mice responded differently. Environmental stress provoked by handling and stabilization of the mice tended to lower the expected stimulated GH level or the level measured after GHRH administration. Consequently, the adaptation of a method that involved very minimal handling of the mice with an intraperitoneal injection, followed by a single blood collection 15 min later, did in fact reveal stimulated values significantly higher than basal GH values. It is important for the reader to recognize how stress can potentially lead to subtle changes in GH secretion. The S436A mice had a significantly greater response to GHRH after 15 min. We conclude that the S436A mice have higher GH levels, which are more readily available for release following identical stimuli, than do control mice.
Despite higher GH values and a trend toward higher IGF-1 levels, no significant differences in length, weight, weight/length ratio, or rate of weight gain between the mice were noted except lower body weights (also weight/length ratios) in the S436 mice during the period between 5 and 7 weeks of age. As this age coincides with the period of pubertal development, it is possible that these differences reflect GH dynamics associated with the sex steroid milieu during puberty. Body composition studies with Echo magnetic resonance imaging (MRI) revealed less body fat (weight and percentage) and similar levels of lean mass in the S436A mice, which may in part explain the differences in weight. In other models of only modestly elevated GH levels, such as the SIGFRKO mouse model, the effect of GH was also seen as a decreased fat mass rather than increased length (35).
The trend toward higher IGF-1 levels in S436A mice supports the functional effect of higher levels of serum GH found in the S436A mice. The lack of higher IGF-1 levels, incidentally, may reflect the finding that actually a weak correlation exists between elevated GH values with IGF-1, especially at higher levels of GH, as has been shown in studies of patients with acromegaly (6). Furthermore, it is unclear at this point whether there exists a component of GH resistance or altered GH bioactivity.
It would be expected that if a normal negative feedback loop were functional, the higher IGF-1 levels would decrease the GH levels to those found in control mice. We believe that the inability of CBP to be phosphorylated at position 436 interferes with its role in negative regulation of transcription of the GH promoter, as documented in the cell culture models and the two genetically engineered mouse strains. In turn, we believe that this leads to a relative constitutive activation of GH transcription via the POU1F1/CBP interaction. Given the subtle differences in animal phenotype between the S436A and control mice, which suggest that CBP phosphorylation is a target of IGF-1 negative feedback, the resulting magnitude of GH gene expression is limited by complex compensatory mechanisms. Hence, these results expand the previously limited data to delineate a clear mechanism of how IGF-1R-mediated signaling targets and ultimately inhibits GH gene expression.
Somatotroph regulation is complex, with several graded influences from both central and peripheral sources; therefore, the impact of IGF-1R signaling pathways may actually lie within a hierarchy of other regulatory factors of the GH gene. Furthermore, inhibition of GH release has been demonstrated to be both direct and indirect, and the somatotroph may be a target of both of these mechanisms. The importance of IGF-1 feedback to the somatotroph has been well established by several research groups using both in vivo and in vitro approaches, and we have additionally shown that perturbations in this central axis affect mammalian physiology. A better understanding of the mechanism(s) of action at the cellular level has allowed for a clearer definition of the roles of both GH and IGF-1 in the somatotroph. Clinically, growth failure or poor growth, with the exception of unequivocal GH deficiency, is often a pathology poorly understood and often presents with variable phenotypes. By focusing on the IGF-IR signaling pathway and its mechanism of action on the somatotroph, better stratification of IGF-1's role within the GH axis regarding growth and metabolism will be possible.
ACKNOWLEDGMENTS
This work was supported by NIDDK/NIH grant K08DK088996 (C.J.R.), Johns Hopkins University School of Medicine Clinician Scientist Award 80027123 (C.J.R.), NIH grant T32DK07751 (S.R.), and Baltimore DRTC NIH grant P60 DK79637 (F.W., S.R., and Andrew Wolfe).
We thank Nadine Forbes-McBean for experiments performed using ECHO-MRI.
Footnotes
Published ahead of print 13 August 2012
REFERENCES
- 1. Alessi DR, Cuenda A, Cohen P, Dudley DT, Saltiel AR. 1995. PD 098059 is a specific inhibitor of the activation of mitogen-activated protein kinase kinase in vitro and in vivo. J. Biol. Chem. 270:27489–27494 [DOI] [PubMed] [Google Scholar]
- 2. Anderson LL, Jeftinija S, Scanes CG. 2004. Growth hormone secretion: molecular and cellular mechanisms and in vivo approaches. Exp. Biol. Med. (Maywood) 229:291–302 [DOI] [PubMed] [Google Scholar]
- 3. Arias J, et al. 1994. Activation of cAMP and mitogen responsive genes relies on a common nuclear factor. Nature 370:226–229 doi:10.1038/370226a0 [DOI] [PubMed] [Google Scholar]
- 4. Balcombe JP, Barnard ND, Sandusky C. 2004. Laboratory routines cause animal stress. Contemp. Top. Lab. Anim. Sci. 43:42–51 [PubMed] [Google Scholar]
- 5. Barinaga M, et al. 1983. Transcriptional regulation of growth hormone gene expression by growth hormone-releasing factor. Nature 306:84–85 [DOI] [PubMed] [Google Scholar]
- 6. Barkan AL, Beitins IZ, Kelch RP. 1988. Plasma insulin-like growth factor-I/somatomedin-C in acromegaly: correlation with the degree of growth hormone hypersecretion. J. Clin. Endocrinol. Metab. 67:69–73 [DOI] [PubMed] [Google Scholar]
- 7. Berelowitz M, et al. 1981. Somatomedin-C mediates growth hormone negative feedback by effects on both the hypothalamus and the pituitary. Science 212:1279–1281 [DOI] [PubMed] [Google Scholar]
- 8. Bilezikjian LM, Vale WW. 1983. Stimulation of adenosine 3′,5′-monophosphate production by growth hormone-releasing factor and its inhibition by somatostatin in anterior pituitary cells in vitro. Endocrinology 113:1726–1731 [DOI] [PubMed] [Google Scholar]
- 9. Bodner M, et al. 1988. The pituitary-specific transcription factor GHF-1 is a homeobox-containing protein. Cell 55:505–518 [DOI] [PubMed] [Google Scholar]
- 10. Bodner M, Karin M. 1987. A pituitary-specific trans-acting factor can stimulate transcription from the growth hormone promoter in extracts of nonexpressing cells. Cell 50:267–275 [DOI] [PubMed] [Google Scholar]
- 11. Bustin SA, Benes V, Nolan T, Pfaffl MW. 2005. Quantitative real-time RT-PCR—a perspective. J. Mol. Endocrinol. 34:597–601 doi:10.1677/jme.1.01755 [DOI] [PubMed] [Google Scholar]
- 12. Castillo AI, Aranda A. 1997. Differential regulation of pituitary-specific gene expression by insulin-like growth factor 1 in rat pituitary GH4C1 and GH3 cells. Endocrinology 138:5442–5451 [DOI] [PubMed] [Google Scholar]
- 13. Chitnis MM, Yuen JS, Protheroe AS, Pollak M, Macaulay VM. 2008. The type 1 insulin-like growth factor receptor pathway. Clin. Cancer Res. 14:6364–6370 doi:10.1158/1078-0432.CCR-07-4879 [DOI] [PubMed] [Google Scholar]
- 14. Clark RG, Carlsson LM, Robinson IC. 1988. Growth hormone (GH) secretion in the conscious rat: negative feedback of GH on its own release. J. Endocrinol. 119:201–209 [DOI] [PubMed] [Google Scholar]
- 15. Cohen LE, Hashimoto Y, Zanger K, Wondisford F, Radovick S. 1999. CREB-independent regulation by CBP is a novel mechanism of human growth hormone gene expression. J. Clin. Invest. 104:1123–1130 doi:10.1172/JCI7308 [DOI] [PMC free article] [PubMed] [Google Scholar]
- 16. Datta SR, et al. 1997. Akt phosphorylation of BAD couples survival signals to the cell-intrinsic death machinery. Cell 91:231–241 [DOI] [PubMed] [Google Scholar]
- 17. Dudek H, et al. 1997. Regulation of neuronal survival by the serine-threonine protein kinase Akt. Science 275:661–665 [DOI] [PubMed] [Google Scholar]
- 18. Fox SR, et al. 1990. The homeodomain protein, Pit-1/GHF-1, is capable of binding to and activating cell-specific elements of both the growth hormone and prolactin gene promoters. Mol. Endocrinol. 4:1069–1080 [DOI] [PubMed] [Google Scholar]
- 19. He L, et al. 2009. Metformin and insulin suppress hepatic gluconeogenesis through phosphorylation of CREB binding protein. Cell 137:635–646 doi:10.1016/j.cell.2009.03.016 [DOI] [PMC free article] [PubMed] [Google Scholar]
- 20. Ingraham HA, et al. 1990. The POU-specific domain of Pit-1 is essential for sequence-specific, high affinity DNA binding and DNA-dependent Pit-1-Pit-1 interactions. Cell 61:1021–1033 [DOI] [PubMed] [Google Scholar]
- 21. Inoue K, et al. 1990. Establishment of a series of pituitary clonal cell lines differing in morphology, hormone secretion, and response to estrogen. Endocrinology 126:2313–2320 [DOI] [PubMed] [Google Scholar]
- 22. Jones JI, Clemmons DR. 1995. Insulin-like growth factors and their binding proteins: biological actions. Endocr. Rev. 16:3–34 [DOI] [PubMed] [Google Scholar]
- 23. Kishimoto M, et al. 2002. Novel function of the transactivation domain of a pituitary-specific transcription factor, Pit-1. J. Biol. Chem. 277:45141–45148 doi:10.1074/jbc.M202991200 [DOI] [PubMed] [Google Scholar]
- 24. Kulik G, Klippel A, Weber MJ. 1997. Antiapoptotic signalling by the insulin-like growth factor I receptor, phosphatidylinositol 3-kinase, and Akt. Mol. Cell. Biol. 17:1595–1606 [DOI] [PMC free article] [PubMed] [Google Scholar]
- 25. Kwok RP, et al. 1994. Nuclear protein CBP is a coactivator for the transcription factor CREB. Nature 370:223–226 doi:10.1038/370223a0 [DOI] [PubMed] [Google Scholar]
- 26. LeRoith D. 2000. Insulin-like growth factor I receptor signaling—overlapping or redundant pathways? Endocrinology 141:1287–1288 [DOI] [PubMed] [Google Scholar]
- 27. Liao L, et al. 2006. Liver-specific overexpression of the insulin-like growth factor-I enhances somatic growth and partially prevents the effects of growth hormone deficiency. Endocrinology 147:3877–3888 doi:10.1210/en.2005-1537 [DOI] [PubMed] [Google Scholar]
- 28. Lipkin SM, Naar AM, Kalla KA, Sack RA, Rosenfeld MG. 1993. Identification of a novel zinc finger protein binding a conserved element critical for Pit-1-dependent growth hormone gene expression. Genes Dev. 7:1674–1687 [DOI] [PubMed] [Google Scholar]
- 29. Lira SA, Kalla KA, Glass CK, Drolet DW, Rosenfeld MG. 1993. Synergistic interactions between Pit-1 and other elements are required for effective somatotroph rat growth hormone gene expression in transgenic mice. Mol. Endocrinol. 7:694–701 [DOI] [PubMed] [Google Scholar]
- 30. Mathews LS, et al. 1988. Growth enhancement of transgenic mice expressing human insulin-like growth factor I. Endocrinology 123:2827–2833 [DOI] [PubMed] [Google Scholar]
- 31. Morishita M, et al. 2003. The effects of GH-releasing hormone/somatostatin on the 5′-promoter activity of the GH gene in vitro. J. Mol. Endocrinol. 31:441–448 [DOI] [PubMed] [Google Scholar]
- 32. Nelson C, Albert VR, Elsholtz HP, Lu LI, Rosenfeld MG. 1988. Activation of cell-specific expression of rat growth hormone and prolactin genes by a common transcription factor. Science 239:1400–1405 [DOI] [PubMed] [Google Scholar]
- 33. Niiori-Onishi A, et al. 1999. Molecular mechanisms of the negative effect of insulin-like growth factor-I on growth hormone gene expression in MtT/S somatotroph cells. Endocrinology 140:344–349 [DOI] [PubMed] [Google Scholar]
- 34. Párrizas M, Saltiel AR, LeRoith D. 1997. Insulin-like growth factor 1 inhibits apoptosis using the phosphatidylinositol 3′-kinase and mitogen-activated protein kinase pathways. J. Biol. Chem. 272:154–161 [DOI] [PubMed] [Google Scholar]
- 35. Romero CJ, et al. 2010. Targeted deletion of somatotroph insulin-like growth factor-I signaling in a cell-specific knockout mouse model. Mol. Endocrinol. 24:1077–1089 doi:10.1210/me.2009-0393 [DOI] [PMC free article] [PubMed] [Google Scholar]
- 36. Rosenfeld MG. 1991. POU-domain transcription factors: pou-er-ful developmental regulators. Genes Dev. 5:897–907 [DOI] [PubMed] [Google Scholar]
- 37. Schaufele F, West BL, Baxter JD. 1992. Synergistic activation of the rat growth hormone promoter by Pit-1 and the thyroid hormone receptor. Mol. Endocrinol. 6:656–665 [DOI] [PubMed] [Google Scholar]
- 38. Schindler WJ, Hutchins MO, Septimus EJ. 1972. Growth hormone secretion and control in the mouse. Endocrinology 91:483–490 [DOI] [PubMed] [Google Scholar]
- 39. Schwander JC, Hauri C, Zapf J, Froesch ER. 1983. Synthesis and secretion of insulin-like growth factor and its binding protein by the perfused rat liver: dependence on growth hormone status. Endocrinology 113:297–305 [DOI] [PubMed] [Google Scholar]
- 40. Sugihara H, et al. 1999. Effect of insulin-like growth factor-I on growth hormone-releasing factor receptor expression in primary rat anterior pituitary cell culture. Neurosci. Lett. 276:87–90 [DOI] [PubMed] [Google Scholar]
- 41. Sun P, Maurer RA. 1995. An inactivating point mutation demonstrates that interaction of cAMP response element binding protein (CREB) with the CREB binding protein is not sufficient for transcriptional activation. J. Biol. Chem. 270:7041–7044 [DOI] [PubMed] [Google Scholar]
- 42. Tamaki M, Sato M, Niimi M, Takahara J. 1995. Resistance of growth hormone secretion to hypoglycemia in the mouse. J. Neuroendocrinol. 7:371–376 [DOI] [PubMed] [Google Scholar]
- 43. Tannenbaum GS, Guyda HJ, Posner BI. 1983. Insulin-like growth factors: a role in growth hormone negative feedback and body weight regulation via brain. Science 220:77–79 [DOI] [PubMed] [Google Scholar]
- 44. Theill LE, Castrillo JL, Wu D, Karin M. 1989. Dissection of functional domains of the pituitary-specific transcription factor GHF-1. Nature 342:945–948 doi:10.1038/342945a0 [DOI] [PubMed] [Google Scholar]
- 45. Thorner MO, et al. 1990. Physiological role of somatostatin on growth hormone regulation in humans. Metabolism 39:40–42 [DOI] [PubMed] [Google Scholar]
- 46. Turyn D, Bartke A. 1993. Pharmacokinetics of radioiodinated human and ovine growth hormones in transgenic mice expressing bovine growth hormone. Transgenic Res. 2:219–226 [DOI] [PubMed] [Google Scholar]
- 47. Vance ML. 1990. Growth-hormone-releasing hormone. Clin. Chem. 36:415–420 [PubMed] [Google Scholar]
- 48. Vlahos CJ, Matter WF, Hui KY, Brown RF. 1994. A specific inhibitor of phosphatidylinositol 3-kinase, 2-(4-morpholinyl)-8-phenyl-4H-1-benzopyran-4-one (LY294002). J. Biol. Chem. 269:5241–5248 [PubMed] [Google Scholar]
- 49. Wallenius K, et al. 2001. Liver-derived IGF-I regulates GH secretion at the pituitary level in mice. Endocrinology 142:4762–4770 [DOI] [PubMed] [Google Scholar]
- 50. Xu J, et al. 2011. Exploring endocrine GH pattern in mice using rank plot analysis and random blood samples. J. Endocrinol. 208:119–129 doi:10.1677/JOE-10-0317 [DOI] [PubMed] [Google Scholar]
- 51. Yakar S, et al. 1999. Normal growth and development in the absence of hepatic insulin-like growth factor I. Proc. Natl. Acad. Sci. U. S. A. 96:7324–7329 [DOI] [PMC free article] [PubMed] [Google Scholar]
- 52. Yamasaki H, Prager D, Gebremedhin S, Moise L, Melmed S. 1991. Binding and action of insulin-like growth factor I in pituitary tumor cells. Endocrinology 128:857–862 [DOI] [PubMed] [Google Scholar]
- 53. Yamashita S, Melmed S. 1986. Insulin-like growth factor I action on rat anterior pituitary cells: suppression of growth hormone secretion and messenger ribonucleic acid levels. Endocrinology 118:176–182 [DOI] [PubMed] [Google Scholar]
- 54. Yamashita S, Melmed S. 1987. Insulinlike growth factor I regulation of growth hormone gene transcription in primary rat pituitary cells. J. Clin. Invest. 79:449–452 doi:10.1172/JCI112832 [DOI] [PMC free article] [PubMed] [Google Scholar]
- 55. Zanger K, Radovick S, Wondisford FE. 2001. CREB binding protein recruitment to the transcription complex requires growth factor-dependent phosphorylation of its GF box. Mol. Cell 7:551–558 [DOI] [PubMed] [Google Scholar]
- 56. Zhou XY, et al. 2004. Insulin regulation of hepatic gluconeogenesis through phosphorylation of CREB-binding protein. Nat. Med. 10:633–637 doi:10.1038/nm1050 [DOI] [PubMed] [Google Scholar]


