

Abstract
Background
Dysregulated immune function associated with ageing has been implicated in a variety of human diseases. We have demonstrated the anti-inflammatory properties of resveratrol, pterostilbene, morin hydrate, quercetin, δ-tocotrienol, riboflavinin a variety of experimental animal models, and determined that these compounds act by inhibiting proteasome activity.
Aims
To determine whether serum nitric oxide (NO) levels increase with age in humans, and whether the combined cholesterol-lowering and inflammation-reducing properties of resveratrol, pterostilbene, Morin hydrate, quercetin, δ-tocotrienol, riboflavin, and nicotinic acid would reduce cardiovascular risk factors in humans when used as nutritional supplements with, or without, other dietary changes.
Methods
Elderly human subjects were stratified into two groups based on total serum cholesterol levels. Initial total serum cholesterol levels were normal and elevated in Group 1 and 2 subjects, respectively. Baseline serum NO, C-reactive protein (CRP), γ-glutamyltransferase (γ-GT) activity, uric acid, total antioxidant status (TAS), total cholesterol, HDL-cholesterol, LDL-cholesterol, and triglycerides levels were established over a four week period. Group 1 subjects subsequently received nutritional supplementation with one of two different combinations (NS-7 = 25 mg of each, resveratrol, pterostilbene, quercetin, δ-tocotrienol, nicotinic acid, morin hydrate or NS-6 = morin hydrate replaced with quercetin, 50 mg/capsule). Group 2 subjects also received these nutritional supplements (two capsules/d), but an AHA Step-1 diet was also implemented. After these interventions were administered for four weeks, the above parameters were re-measured and changes from baseline levels determined. Nitric acid (NO) levels in children, young adults, and seniors were also compared.
Results
The key results of the current study were: 1) that serum NO levels were significantly increased in seniors compared to both children (~80%) and young adults (~65%); 2) that the intake of two capsules/d of NS-7 or NS-6 for four weeks significantly (P < 0.05) decreased serum NO (39%, 24%), CRP (19%, 21%), uric acid (6%, 12%) levels, and γ-GT activity (8%, 6%), respectively in free-living healthy seniors; 3) that serum NO (36%, 29%), CRP (29%, 20%), uric acid (6%, 9%) γ-GT activity (9%, 18%), total cholesterol (8%, 11%), LDL-cholesterol (10%, 13%), and triglycerides (16%, 23%) levels were significantly (P < 0.02) decreased in hypercholesterolemic subjects restricted to AHA Step-1 diet plus intake of SN-7 or SN-6 (two capsules/d), respectively; 4) that TAS was increased (3%, 9%; P < 0.05) in free-living healthy seniors receiving NS-7 or NS-6 alone, and in hypercholesterolemic subjects plus AHA Step-1 diet (20%, 12%; P < 0.02) with either of the combinations tested.
Conclusions
Serum NO levels are elevated in elderly humans compared to children or young adults. Diet supplementation with combinations of resveratrol, pterostilbene, morin hydrate, quercetin, δ-tocotrienol, riboflavin, and nicotinic acid reduce cardiovascular risk factors in humans when used as nutritional supplements with, or without, other dietary changes.
Keywords: Resveratrol, Quercetin, δ-Tocotrienol, C-Reactive Protein, Nitric Oxide (NO), Tumor Necrosis Factor-alpha (TNF-α), Lipid Parameters
Introduction
Dysregulated immune function, resulting in increased inflammatory responses to various stimuli, has been implicated in several human diseases [1-4]. For example, the role of inflammation in the pathogenesis of atherosclerosis has recently been emphasized, and infectious agents have been suggested as possible stimulators of inflammation in atherogenesis [5]. The iNOS enzyme and inflammatory cytokines such as TNF-α, IL-1β, and IL-6 appear to play important roles in the pathogenesis of atherosclerosis. TNF-α is a potent immune mediator and pro-inflammatory cytokine that has been implicated in the pathogenesis of a large number of human diseases [6]. The presence of TNF-α in a majority of atherosclerotic lesions, and its absence from normal tissues, suggest its involvement in atherosclerosis [7,8]. Similarly IL-6, a potent stimulator of acute phase proteins, has been proposed as another mediator of atherosclerosis [9]. A number of previous studies have shown that serum levels of TNF-α, IL-6 and C-Reactive Protein (CRP; a plasma protein which increases during inflammation) are elevated in patients suffering from atherosclerosis [10,11].
We have embarked on a search for naturally-occurring compounds that could suppress production of these cytokines in response to inflammatory stimuli, as a potential means of controlling the development of inflammatory diseases, including atherosclerosis, in humans [1-4]. Recently, we tested the anti-inflammatory effects of resveratrol, pterostilbene, Morin hydrate, quercetin, nicotinic acid, and δ-tocotrienol on LPS stimulated peritoneal macrophages from C57BL/6 mice [3]. All of these compounds significantly reduced TNF-α secretion (31% to 49%) and NO production (16% to 41%) when tested individually. When tested in combination with δ-tocotrienol, significant further reductions in TNF-α secretion (14% to 18%) and NO production (12% to 19%) were observed with all five compounds, suggesting additive or synergistic anti-inflammatory effects between δ-tocotrienol and each of these compounds [3]. We observed similar synergistic or additive anti-inflammatory effects in chickens fed a diet supplemented with either δ-tocotrienol and quercetin or δ-tocotrienol and riboflavin [12].
Our recent studies have also demonstrated that dysregulated immune function, associated with ageing, results in a 10-fold increase in nitric oxide (NO) production in senescent vs. young mice in response to inflammatory stimuli [1]. We showed that the mechanism by which naturally-occurring proteasome inhibitors (e.g. resveratrol, pterostilbene, morin hydrate, quercetin, δ-tocotrienol, riboflavin, and nicotinic acid; Figure 1) suppress production of NO and inflammatory cytokines depends upon decreased degradation of phosphorylated IκB by the proteasome. This reduces translocation of activated NF-κB to the nucleus, and decreases transcription of numerous pro-inflammatory genes [2,3].
Figure 1.
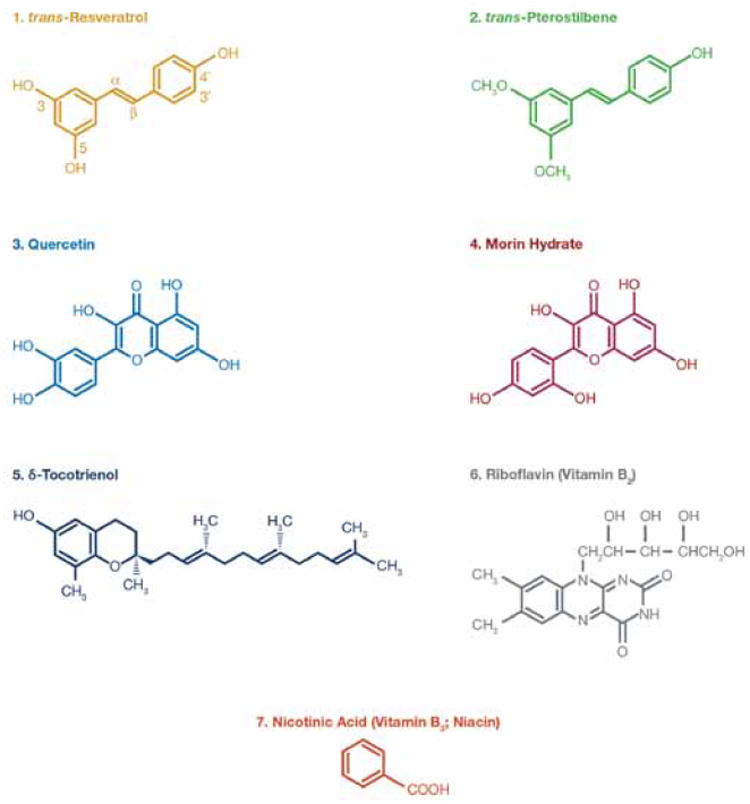
Chemical structures of various components of Nutritional Supplements (NS) used in this study (similar figure was also included in our recent paper [3]).
The cholesterol-lowering effect of resveratrol, pterostilbene, quercetin, morin hydrate riboflavin (vitamin B2), δ-tocotrienol, and nicotinic acid (niacin; vitamin B3) has been well-established [13-17]. These compounds have also been approved by the FDA for human consumption, and used for many years without significant adverse effects [18,19]. The well documented association between cholesterol levels and atherosclerosis, in conjunction with the more recent recognition that atherosclerosis is an inflammatory disease, and our findings that these compounds have anti-inflammatory properties in various animal models, motivated us to test their potential anti-inflammatory, and anti-atherosclerotic properties in humans [1-5]. Our central hypothesis was that the combined cholesterol-lowering and inflammation-reducing properties of resveratrol, pterostilbene, morin hydrate, quercetin, δ-tocotrienol, riboflavin, and nicotinic acid would suppress production of NO and reduce cardiovascular risk factors in humans when used as nutritional supplements with, or without, other dietary changes.
First, we sought to quantitate the serum levels of NO in free-living healthy humans of various ages, [4-year-old (children), 30-year-old (young adults), and 70-year-old (seniors)]. This was followed by determining the effects of diet supplementation with mixtures of resveratrol, pterostilbene, quercetin, morin hydrate, δ-tocotrienol, riboflavin, and nicotinic acid on serum NO levels and on several risk factors associated with atherosclerosis and inflammation [10,11] in healthy seniors (60-70-year-old). We performed similar studies with hypercholesterolemic human subjects, to determine the combined effects of diet supplementation and dietary change to a restricted AHA Step-1 diet on these same parameters. The parameters measured included serum levels of nitric oxide (NO), C - reactive protein (CRP), γ-glutamyltransferase (γ-GT) activity, uric acid, total antioxidant status (TAS), total cholesterol, LDL-cholesterol, HDL-cholesterol, and triglycerides. The inhibition of nitric oxide (NO) production and cardiovascular risk factors by dietary supplements in healthy free-living seniors, and by diet supplementation and modification to a restricted AHA Step-1 diet in hypercholesterolemic subjects, may provide insight into physiological mechanisms relevant to the ageing process and onset of atherosclerosis.
Materials and Methods
Materials
Trans-Resveratrol was purchased from “Mega Resveratrol” (60 Newtown Toad # 32, Danbury CT, USA), trans-pterostilbene from Shanxi Yong Yuan, Biotechnology Co, Ltd. (China), and nicotinic acid (niacin, vitamin B3) from VOIGT Global Distribution Inc. (P. O. Box. 1130, Lawrence, Kansas, USA). (-) Riboflavin and Morin hydrate were purchased from Sigma-Aldrich Chemical Co (St. Louis, MO, USA). Quercetin was purchased from Alfa Aesar (Johnson Matthey Co. Lancastor, UK).
The 50% purified δ-tocotrienol fraction from annatto seeds was purchased from American River (Boston, MA, USA), and purified from 50% δ-tocotrienol fraction to 98% pure δ-tocotrienol by flash chromatography as described previously [4]. The purity of δ-tocotrienol was established by high pressure liquid chromatography (HPLC) against its standard as reported earlier [4].
Composition of nutritional supplements NS-7 and NS-6
The composition of each of the nutritional supplements is presented in Table 1. Each 400 mg capsule of NS-7 contained δ-tocotrienol (from annatto seeds), quercetin, (-) riboflavin, resveratrol, pterostibene, morin hydrate, and nicotinic acid (25 mg of each) + corn starch (225 mg). Each 400 mg capsule of NS-6 differed from NS-7 by increasing the quercetin content from 25 mg to 50 mg and excluding morin hydrate. The capsulation of mixtures of NS-7, NS-6, and packing (30 capsules / bottle) was carried out at ProTec Lab, 4300 FM 2225, Quitman, TX, USA, and Kabco Inc. New Jersey, USA. The bottles were labeled as AMR-1, and AMR-2, respectively.
Table 1.
Composition of Nutritional Supplement (NS-7, NS-6) capsules for clinical human studies.
| NS-7: Composition of Nutritional Supplement-7 (NS-7) | ||
|---|---|---|
| # | Ingredients | Composition per capsule |
| 1 | Annatto δ-Tocotrienol* | 25.0 mg |
| 2 | Quercetin | 25.0 mg |
| 3 | Resveratrol | 25.0 mg |
| 4 | Pterostilbene | 25.0 mg |
| 5 | Morin Hydrate | 25.0 mg |
| 6 | (-) Riboflavin (vitamin B2) | 25.0 mg |
| 7 | Nicotinic acid (Niacin; vitamin B3) | 25.0 mg |
| Starch | 225.0 mg | |
| Total | 400 mg per capsule | |
| NS-6: Composition of Nutritional supplement-6 (NS-6) | ||
| # | Ingredients | Composition per capsule |
| 1 | Annatto δ-Tocotrienol* | 25.0 mg |
| 2 | Quercetin | 50.0 mg |
| 3 | Resveratrol | 25.0 mg |
| 4 | Pterostilbene | 25.0 mg |
| 5 | (-) Riboflavin (vitamin B2) | 25.0 mg |
| 6 | Nicotinic acid (Niacin, vitamin B3) | 25.0 mg |
| Starch | 225.0 mg | |
| Total | 400 mg per capsule | |
δ-tocotrienol was purified inhouse from 50% annatto mixture by flash chromatography [4].
Inclusion and exclusion criteria
The present study was carried out as a double blind randomized control trial of dietary nutritional supplements (NS-7 and NS-6) in free-living healthy seniors and in hypercholesterolemia subjects who were restricted to an AHA Step-1 diet in Wah Cantt, Pakistan, as outlined in Table 2. The study protocol was approved by the institutional review committee of the Army Medical College, Rawalpindi, Pakistan, and was carried out under FDA approved IND number 36906. All participants signed an informed-consent form, which was approved by the Institutional Review Board of the Medical College. Exclusion criteria included weight (> 125% of Metropolitan Life relative weight), elevated serum glutamate-pyruvate or glutamate-oxaloacetate transaminase activity, elevated blood urea nitrogen or fasting glucose values, or hypertensive disease.
Table 2.
Study design of nutritional supplemention (NS-7 and NS-6) with or without implementation of AHA Step-1 diet in free living healthy seniors or hypercholesterolemic human subjects.
| Treatment | Study population and intervention | Duration |
|---|---|---|
| Free-living healthy senior subjects (Group 1). | ||
| 1 | No intervention; Baseline (Males n = 20 + Females n = 10); Total (n) = 30 | Weeks 1-4 (Phase I) |
| 2 | Diet supplementation with NS-7; 2 capsules/d (Subgoup A) | Weeks 5-8 (Phase II) |
| 3 | No intervention; Baseline (Males n = 24 + Females n = 15); Total (n) = 39 | Weeks 1-4 (Phase I) |
| 4 | Diet supplementation with NS-6; 2 capsules/d (Subgroup B) | Weeks 5-8 (Phase II) |
| Hypercholesterolemic human subjects (Group 2) | ||
| 5 | No intervention; Baseline (Males n = 32 + Females n = 9); Total (n) = 41 | Weeks 1-4 (Phase I) |
| 6 | Implementation of AHA Step-1 diet + NS-7, 2 capsules/d; (Subgroup C) | Weeks 5-8 (Phase II) |
| 7 | No intervention; Baseline (Males n = 20 + Females n = 10); Total (n) = 30 | Weeks 1-4 (Phase I) |
| 8 | Implementation of AHA Step-1 diet + NS-6, 2 capsules/d; (Subgoup D) | Weeks 5-8 (Phase II) |
Age associated NO levels
Free-living healthy normal subjects of varying ages, [~4-year-old (n = 32), 30-year-old (n = 32), and ~70-year-old (n = 32) (total subjects, n = 96)] were recruited from the Pakistan Army Base in Rawalpindi, Pakistan to compare age associated changes in plasma NO levels (Table 3).
Table 3.
The plasma levels of Nitric Oxide (NO) of healthy human subjects of various ages1.
| # | Parameters | Baby boys | Baby girls | Young males | Young females | Senior males | Senior females |
|---|---|---|---|---|---|---|---|
| 1 | Age (Years) | 3.25 ± .25** | 3.19 ± 0.25 | 32.81 ± 1.11 | 31.13 ± 0.70 | 68.63 ± 0.93 | 67.25 ± 0.40 |
| 2 | Number of subjects (n) | 16 | 16 | 16 | 16 | 16 | 16 |
| 3 | *Plasma levels of nitric oxide in μM | 11.36 ± 0.77** | 13.20 ± 0.58 | 12.43 ± 0.70 | 14.31 ± 0.44 | 20.38 ± 0.91 | 24.03 ± 1.56 |
| 179.40%*** | 182.05%*** | ||||||
| 12.28 (μM) | 22.21 (μM; 180.86%) | ||||||
The estimations of plasma nitric oxide (NO) were carried out according to published procedure as described in Materials and Methods.
Average of triplicalte analyses of each sample.
All the values expressed as means ± SE (standard Error).
Compared to respective values of baby boys and baby girls.
Experimental Design
Group 1 free-living healthy senior subjects
The subjects were recruited from a free-living healthy population (age ≥ 60 years and serum cholesterol level < 5.0 mmol/L) from “Senior Citizen’s Community Centre” at Wah Cantt, Pakistan. The study consisted of two phases (phase I and II). All subjects were screened at baseline during the first four weeks (phase I). The subjects were then randomized into two subgroups A and B. Subjects of subgroup A were given 2 capsules of NS-7 daily (400 mg/cap) and subjects of subgroup B were given 2 capsules of NS-6 daily for four weeks. Prospective participants were further sub-grouped by sex. There were initially 81 total subjects in Group 1; 44 males and 37 females. There were 20 males and 16 females (serum total cholesterol level 4.31 ± 0.21 mmol/L) in subgroup A, and there were 24 males and 21 females (serum total cholesterol level 4.41 ± 0.19 mmol/L) in subgroup B. Each participant was individually counseled regularly to maintain his or her normal daily diet for Group 1. Dietary intake of each subject was monitored by reviewing three-day diet records prior to the start of the study, and each week during each phase of the study. 12 females from Group 1 (6 from subgroup A and 6 from subgroup B) failed to complete the study.
Group 2 hypercholesterolemic subjects
The hypercholesterolemic participants (age > 50 years and serum cholesterol level > 5.5 mmol/L) initially consisted of 79 subjects (52 males and 27 females). Group 2 also consisted of two phases (I and II). In phase I, subjects ingested their free choice diet for four weeks to establish a baseline. Subjects were then randomly divided into subgroups C and D for phase II of the study, during which all participants were counseled to follow the American Heart Association Step-1 diet (AHA Step-1). During phase II, subjects of subgroup C were also administered 2 capsules of NS-7/d, and subgroup D were also administered 2 capsules of NS-6/d for four weeks. Group 2 subjects started the AHA-Step-1 diet plus dietary supplementation simultaneously. Subgroup C consisted of 32 males and 13 females (serum total cholesterol level 6.06 ± 0.18 mmol/L), and subgroup D consisted of 20 males and 14 females (serum total cholesterol level 6.04 ± 0.16 mmol/L). 8 females from Group 2 (4 from subgroup C and 4 from subgroup D) failed to complete the study.
All Group 2 participants (both subgroups C and D) were advised to strictly follow the AHA Step-1 diet during phase II of the study. Participants were also advised to stop using cholesterol-lowering drugs or antioxidants and were individually counseled to modify food intake to meet the goals of the AHA Step-1 diet. Subjects were asked to stop ingesting whole milk, butter, cheese, eggs, animal fat and ice cream. In order to ascertain full compliance with dietary recommendations and intake of nutritional supplements, participants were contacted by telephone during each phase for an unanticipated 24-h recall of food intake. The participants recorded their daily food intakes during the final three days of each phase. Diet records and 24-h recalls were analyzed; if required, a participant was individually counseled to modify food intake to maintain weight.
Groups 1 and 2
A clinical history was obtained and physical examination performed for each participant. Initial measures included the participant’s height, weight, and systolic and diastolic blood pressure at rest, history of significant diseases, medications (any statin drugs, nitrates, calcium antagonist, Angiotension-Converting Enzyme [ACE] inhibitors, and diuretics) and smoking. Height and weight were measured in light clothing, without shoes. Body Mass Index (BMI, kg/m2) was used as a measure of relative body weight. Weights were recorded daily. Venous blood samples (12 h fast, 7:00 – 9:00 am) were drawn at screening. At screening the participants were counseled to follow their normal dietary intake for Group 1 and phase I of Group 2, or to adhere to the AHA Step-1 diet for phase II of Group 2. Screening was accomplished during a one week period; consequently, the duration of the baseline phase ranged from three to four weeks.
Blood samples collection
Venous blood samples (12 h fast, 9 pm to 9 am) were drawn at screening during a one week period, consequently the duration of the baseline phase ranged from three to four weeks. Venous blood samples were drawn at the termination of baseline phase I and at end of phase II. Processed samples were coded and held at -72°C until analyses were carried out following the treatment phase.
Biochemical analysis
All relevant investigations were carried out in the department of chemical pathology, Army Medical College, (NUST, Rawalpindi, Pakistan) according to validated standard procedures of the laboratory. Liver function tests, thyroid stimulating hormone (TSH), serum urea and fasting plasma glucose were analyzed to exclude liver, renal, thyroid disorders and diabetes mellitus. Serum levels of total cholesterol were measured by cholesterol oxidase method (CHOD. POD), and serum levels of triglycerides were determined by GPO-POD colorimetric standard method by using Pioneer Diagnostics Kit (USA, a Lot No. 804-FV). The Serum HDL-cholesterol and LDL cholesterol were also analyzed. Serum γ-glutamyltransferase (γ-GT) activity was analyzed at 37°C by using glutamyl-3-carboxy-4-nitroanilide as substrate, according to the protocol of Human kit (Germany). All the above mentioned assays were carried out on automatic Chemistry Analyser, Selectra E (Vita Scientific, Netherland). Serum hS-CRP was analyzed by two-site sequential chemiluminescent immunometric assay kit (Seimen, LA, California, USA) on Immulite 1000 (Immulite, Diagnostic Product Corporation, USA) according to manufacturer’s directions. The analytical sensitivity was 0.1 mg/L. Elevated CRP was defined as values >4.0 mg/L.
Serum total antioxidant status (TAS) was estimated by kinetic colorimetric assay kit (Randox, Crumlin, UK), using the automated clinical chemistry analyser, Selectra E (Vita Lab, Netherland) following the previously reported method [20]. Serum TAS present in samples causes a decrease in ABTS formation (radical cation) which forms a relatively stable blue green color when ABTS (2,2’-Azino-di-[3-ethylbenthiazoline sulphonate]) is incubated with peroxidase (Metmyoglobin) and H202, and the decrease in color formation of ABTS is proportional to the concentration of TAS, which is measured at 600 nm.
Estimation of Nitrate was carried out by using a colorimetric assay based on Griess reagent, using standard kit procedure (Cayman kit, Ann Arbor, MI. USA) at 540 nm and micro plate reader (Diamate 710, UK). Serum nitrate was measured as nitrite after enzymatic reduction by incubating with nitrate reductase and NADPH. After incubation, the reaction mixture was deproteinized, and Griess reagent was added. After 10 min of color development (deep purple azo compound) at room temperature, absorbance was measured on a microplate reader at 540 nm. Values obtained by this procedure represent the sum of nitrate and nitrite; CV of the method was 4.1 percent. The plasma levels of NO were found to be higher than serum levels in the present investigation. Data are reported as means ± SE (standard error) in Tables and Figures.
Statistical analysis
The statistical analysis was performed using SPSS 16 (SPSS Inc, Chicago). Continuous normally distributed variables are summarized as means ± SE, and percent differences were calculated from baseline values of each analysis. Analysis of two-way variance was used to test whether changes in serum lipid parameters, CRP, NO, γ-GT activity, uric acid and oxidative stress occur in the course of supplementation with or without diet alterations, and whether there are between- and within-subject differences; because all observations were required, available degrees of freedom were reduced by this statistical approach. Paired Student’s t-test was applied for normally distributed variables. A two tailed P value < 0.05 was considered significant.
Results
We previously demonstrated that combining δ-tocotrienol with a variety of other proteasome inhibitors augments the anti-inflammatory effects of these compounds [3,12]. These findings prompted us to combine a variety of these compounds together and determine the effects of diet supplementation with these combinations alone, or in conjunction with the AHA Step-1 diet, on levels of nitric oxide (increased during ageing), CRP, and other cardiovascular risk factors.
The composition of the capsules of nutritional supplements (NS-7 or NS-6) is provided in Table 1. The study design, including number of subjects in each group and subgroup, and various markers are presented in Table 2.
Plasma levels of Nitric Oxide (NO) in free-living healthy human subjects of various age groups
We have recently reported that there was a 10-fold increase in the production of NO in senescent mice compared to young mice [1]. This finding prompted us to determine whether similar increases in the levels of NO would be observed amongst young and free-living healthy human seniors. The data presented in Table 3 show the plasma values of NO in children (~3-years-old), young/adults (~32-years-old), and seniors (~68-years-old). There was a significant increase in the levels of NO in seniors as compared to both children (~80%) and young adults (~65%), thus confirming our earlier findings in mice [1,21]. The NO levels of 30-year-olds (males and females) were not significantly different than those of children (males and females), however, plasma levels of NO were higher in males, as compared to females in all age groups.
Characteristics of study populations of free-living healthy seniors and hypercholesterolemic subjects
We previously demonstrated that NO production was inhibited by naturally-occurring proteasome inhibitors (trans-resveratrol, trans-pterostilbene, quercetin, morin hydrate, δ-tocotrienol, and riboflavin) in lipopolysaccharide (LPS)-stimulated RAW 264.7 cells and in thioglycolate-elicited peritoneal murine macrophages [1-3]. We have also demonstrated that the combination of δ-tocotrienol with each of the above mentioned compounds caused further inhibition of NO production and secretion of TNF-α compared to individual compounds [3,12]. The biological functions of each of these compounds have been reviewed in our recent publications [1-4,12]. Therefore, the present investigation was carried out with nutritional supplements containing mixtures of the above mentioned compounds (NS-7 and NS-6; see table 1 for composition) in hypercholesterolemic subjects restricted to an AHA Step-1 diet and in free-living healthy seniors.
None of the male subjects complained of any side-effects due to intake of NS-7 or NS-6 throughout the study. Six female subjects from each subgroup (A and B; 12 total) in Group 1 and four female subjects in each subgroup (C and D; 8 total) in Group 2 failed to complete all phases of the study because they became concerned with a change in the color of their urine (intense yellow) and stopped taking the supplements. This change in urine color is not harmful and is a known side effect of riboflavin incorporated into the NS-7 and NS-6 capsules. The main characteristics (number of subjects, age, body weights, body mass index, and initial serum total cholesterol and triglycerides levels) of subjects completing the study are presented in Table 4.
Table 4.
Characteristics of the study populations of healthy senior and hypercholesterolemic human subjects1.
| Characteristics | Free-Living Healthy senior subjects | Hypercholesterolemic subjects | |||
|---|---|---|---|---|---|
| NS-7 capsule | NS-6 capsule | NS-7 capsule | NS-6 capsule | ||
| Baseline | Baseline | Baseline | Baseline | ||
| 1 | Subjects | ||||
| Males (n) | 20 | 24 | 32 | 20 | |
| Females (n) | 10 | 15 | 9 | 10 | |
| Total (males + females) n = | 30 | 39 | 41 | 30 | |
| 2 | Age (years) | ||||
| Males | 66.20 ± 1.58* | 64.46 ± 1.13* | 61.84 ± 1.60* | 62.25 ± 1.76* | |
| Females | 59.40 ± 2.48 | 59.60 ± 1.30 | 61.22 ± 2.62 | 53.80 ± 1.87 | |
| Total (males + females) | 63.93 ± 7.89 | 62.59 ± 0.93 | 61.71 ± 1.35 | 59.43 ± 1.50 | |
| 3 | Body weight (kg) | ||||
| Males | 78.85 ± 1.33 | 81.54 ± 0.60 | 77.41 ± 0.79 | 75.90 ± 1.30 | |
| Females | 72.90 ± 3.44 | 62.27 ± 1.25 | 73.56 ± 2.10 | 65.60 ± 0.75 | |
| Total (males + females) | 76.73 ± 1.52 | 74.13 ± 1.63 | 76.56 ± 0.80 | 72.47 ± 1.27 | |
| 4 | Body mass index (kg/m2) | ||||
| Males | 25.44 ± 0.25 | 25.87 ± 0.16 | 25.12 ± 0.29 | 24.85 ± 0.38 | |
| Females | 25.86 ± 0.53 | 24.66 ± 0.45 | 25.81 ± 0.33 | 26.85 ± 0.34 | |
| Total (males + females) | 25.58 ± 0.24 | 25.40 ± 0.22 | 25.27 ± 0.24 | 25.18 ± 0.29 | |
| 5 | Initial cholesterol (mmol/L) | ||||
| Males | 4.13 ± 0.17 | 4.42 ± 0.13 | 6.08 ± 0.08 | 6.01 ± 0.08 | |
| Females | 4.67 ± 0.19 | 4.39 ± 0.14 | 5.97 ± 0.16 | 6.10 ± 0.16 | |
| Total (males + females) | 4.31 ± 0.14 | 4.41± 0.10 | 6.06 ± 0.07 | 6.04 ± 0.08 | |
| 6 | Intial triglycerides (mmo/L) | ||||
| Males | 1.37 ± 0.12 | 1.48 ± 0.04 | 2.63 ± 0.31 | 2.48 ± 0.20 | |
| Females | 1.76 ± 0.20 | 1.59 ± 0.21 | 2.34 ± 0.68 | 2.17 ± 0.35 | |
| Total (males + females) | 1.50 ± 0.11 | 1.52 ± 0.10 | 2.56 ± 0.28 | 3.37 ± 0.18 | |
The baseline and treatments profiles for subjects completing all phases were reported in this Table.
Data expressed as means ± SE (Standard Error)
Serum levels of NO, CRP, γ-GT activity, and uric acid are decreased in free-living healthy seniors receiving NS-7 or NS-6 capsules, and in hypercholesterolemic subjects who were restricted to the AHA Step-1 diet plus intake of NS-7 or NS-6 capsules for four weeks
We have previously demonstrated that agonist-induced NO production can be inhibited by resveratrol, pterostilbene, quercetin, morin hydrate, δ-tocotrienol, and riboflavin in RAW 264.7 cells and in thioglycolate-elicited peritoneal murine macrophages [3]. For several of these compounds we demonstrated that this inhibition of NO production was due to their capacity to inhibit the proteasome, which results in decreased NF-κB activation [2,3]. In the current study we have also demonstrated that serum NO levels are significantly higher in seniors than in children or young adults (Table 3). In view of the fact that elevated NO levels have been implicated in the pathogenesis of a variety of age associated diseases, we were interested in determining the effects of diet supplementation, and the combined effects of diet change and supplementation, on serum NO levels [1-4,12].
First we found that baseline NO levels were nearly twice as high in hypercholesterolemic subjects as in subjects with normal cholesterol levels (Figure 2). We also found that serum NO levels were significantly reduced, compared to baseline levels, in free-living healthy seniors whose diets were supplemented with NS-7 (39% reduction; subgroup A) or NS-6 (21% reduction; subgroup B), but who did not restrict to the AHA Step-1 diet (Figure 2). Serum NO levels were also significantly reduced from baseline levels in hypercholesterolemic subjects who were restricted to the AHA Step-1 diet and who received dietary supplementation with either NS-7 (36% reduction; subgroup C) or NS-6 (29% reduction; subgroup D; Figure 2).
Figure 2. Serum NO levels are decreased in free-living healthy seniors receiving NS-7 or NS-6 capsules, and in hypercholesterolemic subjects who were restricted to the AHA Step-1 diet plus intake of NS-7 or NS-6 capsules.
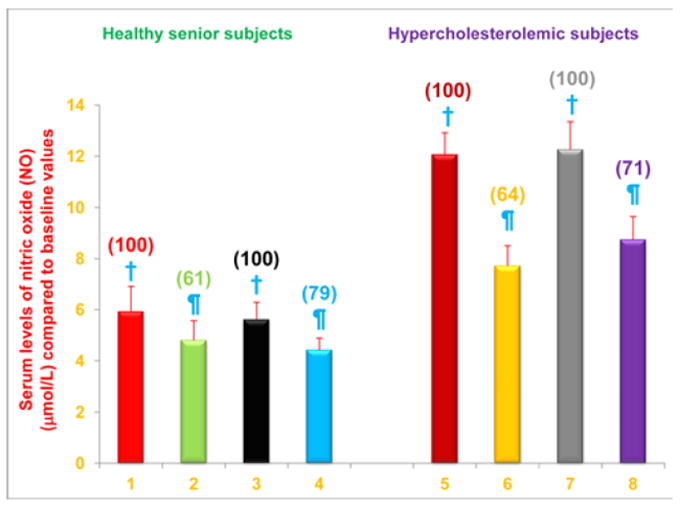
Columns 1-4 represent Group 1 subjects with normal initial total cholesterol levels. 1 = Baseline NO levels for 30 subjects; 2 = NO levels for column 1 subjects after four weeks diet supplementation with NS-7 (Subgroup A); 3 = Baseline NO levels for 39 subjects; 4 = NO levels for column 3 subjects after four weeks diet supplementation with NS-6 (Subgroup B). Columns 5-8 represent Group 2 subjects with elevated initial total cholesterol levels. 5 = Baseline NO levels for 41 subjects; 6 = NO levels for column 5 subjects four weeks after changing to the AHA Step-1 diet and supplementation with NS-7 (Subgroup C); 7 = Baseline NO levels for 30 subjects; 8 = NO levels for column 7 subjects four weeks after changing to the AHA Step-1 diet and supplementation with NS-6 (Subgroup D) capsules. Data are means ± SE. Values in a column not sharing a common symbol are significantly different at P < 0.05. Percentages of each treatment compared to baseline values are in parenthesis above the column.
C-reactive protein (CRP) is an acute phase protein whose levels increase during inflammation. Furthermore, serum CRP levels are regarded as one of the best indicators of risk for cardiovascular disease, and the role of elevated serum CRP levels in atherosclerosis has been emphasized [11,22,23]. Consequently, we were interested in determining the effects of diet supplementation, and the combined effects of diet change and supplementation, on serum CRP levels. We found that serum CRP levels were significantly reduced, compared to baseline levels, in free-living healthy seniors who did not restrict to the AHA Step-1 diet, but whose diets were supplemented with NS-7 (39% reduction; subgroup A) or NS-6 (24% reduction; subgroup B; Figure 3). Serum CRP levels were also significantly reduced from baseline levels in hypercholesterolemic subjects who were restricted to the AHA Step-1 diet and who received dietary supplementation with either NS-7 (29% reduction; subgroup C) or NS-6 (20% reduction; subgroup D; Figure 3).
Figure 3. Serum CRP levels are decreased in free-living healthy seniors receiving NS-7 or NS-6 capsules, and in hypercholesterolemic subjects who were restricted to the AHA Step-1 diet plus intake of NS-7 or NS-6 capsules.

Columns 1-4 represent Group 1 subjects with normal initial total cholesterol levels. 1 = Baseline CRP levels for 30 subjects; 2 = CRP levels for column 1 subjects after four weeks diet supplementation with NS-7 (Subgroup A); 3 = Baseline CRP levels for 39 subjects; 4 = CRP levels for column 3 subjects after four weeks diet supplementation with NS-6 (Subgroup B). Columns 5-8 represent Group 2 subjects with elevated initial total cholesterol levels. 5 = Baseline CRP levels for 41 subjects; 6 = CRP levels for column 5 subjects four weeks after changing to the AHA Step-1 diet and supplementation with NS-7 (Subgroup C); 7 = Baseline CRP levels for 30 subjects; 8 = CRP levels for column 7 subjects four weeks after changing to the AHA Step-1 diet and supplementation with NS-6 (Subgroup D). Data are means ± SE. Values in a column not sharing a common symbol are significantly different at P < 0.05. Percentages of each treatment compared to baseline values are in parenthesis above the column.
Serum level of γ-GT activity is useful predictors for non-fatal myocardial infarction and fatal coronary heart disease [24]. Consequently we were interested in determining the effects of diet supplementation, and the combined effects of diet change and supplementation, on serum level of γ-GT activity. We found that serum levels of γ-GT activity were significantly reduced, compared to baseline levels, in free-living healthy seniors whose diets were supplemented with NS-7 (8% reduction; subgroup A) or NS-6 (9% reduction; subgroup B; Figure 4). Serum levels of γ-GT activity were also significantly reduced from baseline levels in hypercholesterolemic subjects who were restricted to the AHA Step-1 diet and who received dietary supplementation with either NS-7 (9% reduction; subgroup C) or NS-6 (18% reduction; subgroup D; Figure 4).
Figure 4. Serum levels of γ-GT activity are decreased in free-living healthy seniors receiving NS-7 or NS-6 capsules, and in hypercholesterolemic subjects who were restricted to the AHA Step-1 diet plus intake NS-7 or NS-6 capsules.
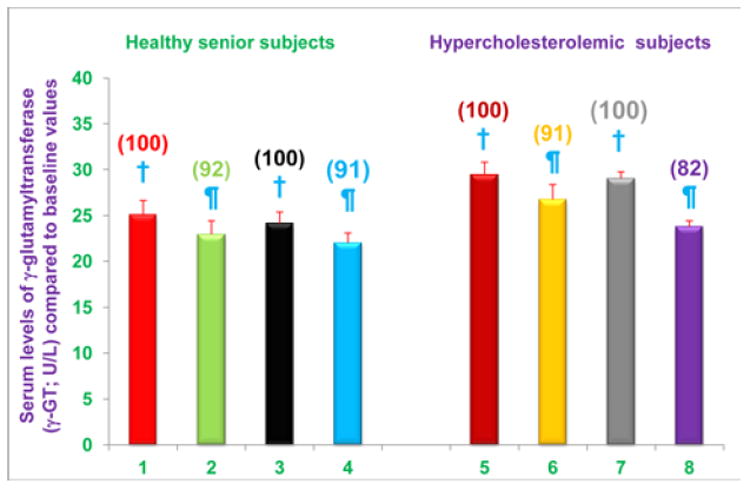
Columns 1-4 represent Group 1 subjects with normal initial total cholesterol levels. 1 = Baseline γ-GT activity levels for 30 subjects; 2 =γ-GT activity levels for column 1 subjects after four weeks diet supplementation with NS-7 (Subgroup A); 3 = Baseline γ-GT activity levels for 39 subjects; 4 =γ-GT activity levels for column 3 subjects after four weeks diet supplementation with NS-6 (Subgroup B). Columns 5-8 represent Group 2 subjects with elevated initial total cholesterol levels. 5 = Baseline γ-GT activity levels for 41 subjects; 6 = γ-GT activity levels for column 5 subjects 4 weeks after changing to the AHA Step-1 diet and supplementation with NS-7 (Subgroup C); 7 = Baseline γ-GT activity levels for 30 subjects; 8 = γ-GT activity levels for column 7 subjects four weeks after changing to the AHA Step-1 diet and supplementation with NS-6 (Subgroup D). Data are means ± SE. Values in a column not sharing a common symbol are significantly different at P < 0.05. Percentages of each treatment compared to baseline values are in parenthesis above the column.
It is well established that elevated serum uric acid levels cause gout, and are also linked to hypertension, dyslipidemia and dysregulated glucose metabolism, which contribute to the pathogenesis of atherosclerosis [25]. Consequently we were interested in determining the effects of diet supplementation, and the combined effects of diet change and supplementation, on serum uric acid levels. We found that serum uric acid levels were significantly reduced, compared to baseline levels, in free-living healthy seniors whose diets were supplemented with NS-7 (6% reduction; subgroup A) or NS-6 (12% reduction; subgroup B), but who did not restrict to the AHA Step-1 diet (Figure 5). Serum uric acid levels were also significantly reduced from baseline levels in hypercholesterolemic subjects who were restricted to the AHA step-1 diet and who received dietary supplementation with either NS-7 (6% reduction; subgroup C) or NS-6 (9% reduction; subgroup D; Figure 5).
Figure 5. Serum uric acid levels are decreased in free-living healthy seniors receiving NS-7 or NS-6 capsules, and in hypercholesterolemic subjects who were restricted to the AHA Step-1 diet plus intake of NS-7 or NS-6 capsules.
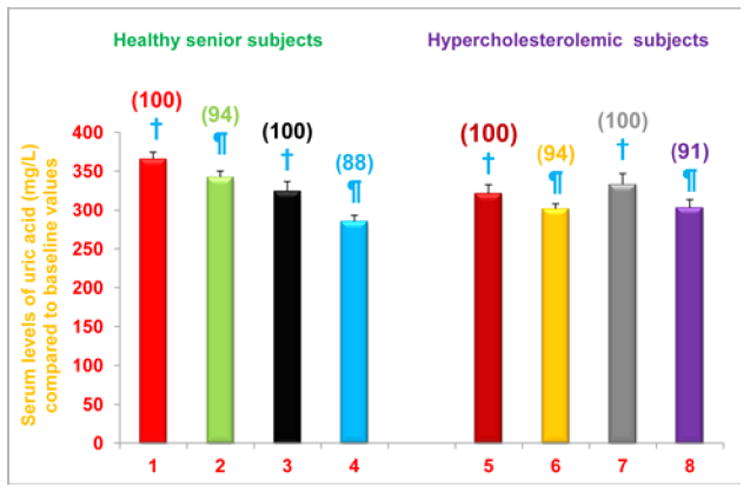
Columns 1-4 represent Group 1 subjects with normal initial total cholesterol levels. 1 = Baseline uric acid levels for 30 subjects; 2 = Uric acid levels for column 1 subjects after four weeks diet supplementation with NS-7 (Subgroup A); 3 = Baseline uric acid levels for 39 subjects; 4 = Uric acid levels for column 3 subjects after four weeks diet supplementation with NS-6 (Subgroup B). Columns 5-8 represent Group 2 subjects with elevated initial total cholesterol levels. 5 = Baseline uric acid levels for 41 subjects; 6 = Uric acid levels for column 5 subjects four weeks after changing to the AHA Step-1 diet and supplementation with NS-7 (Subgroup C); 7 = Baseline uric acid levels for 30 subjects; 8 = Uric acid levels for column 7 subjects four weeks after changing to the AHA Step-1 diet and supplementation with NS-6 (Subgroup D). Data are means ± SE. Values in a column not sharing a common symbol are significantly different at P < 0.05. Percentages of each treatment compared to baseline values are in parenthesis above the column.
Serum total antioxidant status (TAS) is increased in free-living healthy seniors receiving NS-7 or NS-6 capsules, and in hypercholesterolemic subjects who were restricted to the AHA Step-1 diet plus intake of NS-7 or NS-6 capsules for four weeks
The composition of NS-7 and NS-6 nutritional supplements was selected because of the superior antioxidant properties of the individual components compared to other vitamins, their capacity to inhibit the proteasome, and their anti-inflammatory properties [1-4,12,20]. The results presented above demonstrate that markers of inflammation (e.g. NO, CRP) are decreased in subjects receiving 2 capsules/d of NS-7 or NS-6 for four weeks. Next, we wanted to determine the effects of diet supplementation, and the combined effects of diet change and supplementation, on TAS. We found that TAS was significantly increased, compared to baseline levels, in free-living healthy seniors whose diets were supplemented with NS-7 (4% increase; subgroup A) or NS-6 (10% increase; subgroup B), but who did not restrict to the AHA Step-1 diet (Figure 6). TAS was also significantly increased from baseline levels in hypercholesterolemic subjects who were restricted to the AHA Step-1 diet and who received dietary supplementation with either NS-7 (20% increase; subgroup C) or NS-6 (12% increase; subgroup D; Figure 6).
Figure 6. Serum TAS levels are increased in free-living healthy seniors receiving NS-7 or NS-6 capsules, and in hypercholesterolemic subjects who were restricted to the AHA Step-1 diet plus intake of NS-7 or NS-6 capsules.
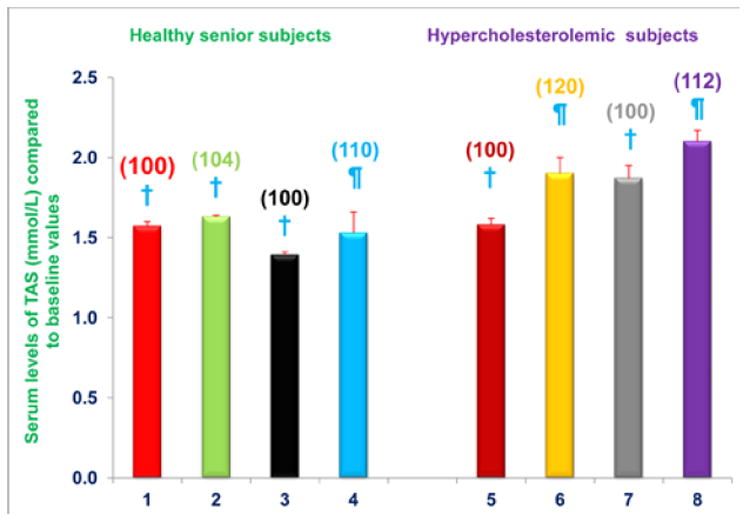
Columns 1-4 represent Group 1 subjects with normal initial total cholesterol levels. 1 = Baseline TAS for 30 subjects; 2 = TAS for column 1 subjects after four weeks diet supplementation with NS-7 (Subgroup A); 3 = Baseline TAS for 39 subjects; 4 = TAS for column 3 subjects after four weeks diet supplementation with NS-6 (Subgroup B). Columns 5-8 represent Group 2 subjects with elevated initial total cholesterol levels. 5 = Baseline TAS for 41 subjects; 6 = TAS for column 5 subjects four weeks after changing to the AHA Step-1 diet and supplementation with NS-7 (Subgroup C); 7 = Baseline TAS for 30 subjects; 8 = TAS for column 7 subjects four weeks after changing to the AHA Step-1 diet and supplementation with NS-6 (Subgroup D). Data are means ± SE. Values in a column not sharing a common symbol are significantly different at P < 0.05. Percentages of each treatment compared to baseline values are in parenthesis above the column.
Collectively, the results presented above support the conclusion that diet supplementation with NS-7 or NS-6 alone decreased serum levels of NO, CRP, γ-GT activity, and uric acid, and increased TAS levels, in free-living healthy seniors. Similar decreases in serum levels of NO, CRP, γ-GT activity, and uric acid, and increased TAS levels, were observed in hypercholesterolemic subjects who were restricted to the AHA Step-1 diet and whose diets were supplemented with NS-7 or NS-6 capsules.
Serum total cholesterol, LDL-cholesterol, and triglycerides levels are decreased in hypercholesterolemic subjects who were restricted to the AHA Step-1 diet plus intake of NS-7 or NS-6 capsules, but not in free-living healthy seniors receiving only NS-7 or NS-6 capsules
Elevated serum total cholesterol (> 5 mmol/L), and LDL-cholesterol levels (> 3 mmol/L) are known risk factors for myocardial infarction. Therefore, it is important to maintain serum levels of total cholesterol and LDL-cholesterol below recommended values by dietary restriction or medication. Initial serum total cholesterol levels for all subjects in Group 2 were elevated, indicating that they were at increased risk for myocardial infarction (Table 4). Therefore, after establishing baseline values (phase I), all Group 2 subjects were restricted to an AHA Step-1 diet plus dietary supplementation with either NS-7 (Group C) or NS-6 (Group D) capsules for four weeks (phase II).
Serum total cholesterol levels were reduced in hypercholesterolemic subjects who were restricted to the AHA step-1 diet plus intake of either NS-7 (subgroup C) or NS-6 (subgroup D) capsules after establishing baseline cholesterol levels. Serum total cholesterol levels decreased by 8% and 11% (P < 0.05) for subgroups C and D, respectively, compared to baseline values (Figure 7). In contrast, serum total cholesterol levels were unchanged, compared to baseline levels, in free-living healthy seniors with normal baseline cholesterol levels whose diets were supplemented with NS-7 or NS-6 capsules, but who did not restrict to the AHA Step-1 diet (subgroups A and B; Figure 7).
Figure 7. Serum total cholesterol levels are decreased in hypercholesterolemic subjects who were restricted to the AHA Step-1 diet plus intake of NS-7 or NS-6 capsules, but not in free-living healthy seniors receiving only NS-7 or NS-6 capsules.
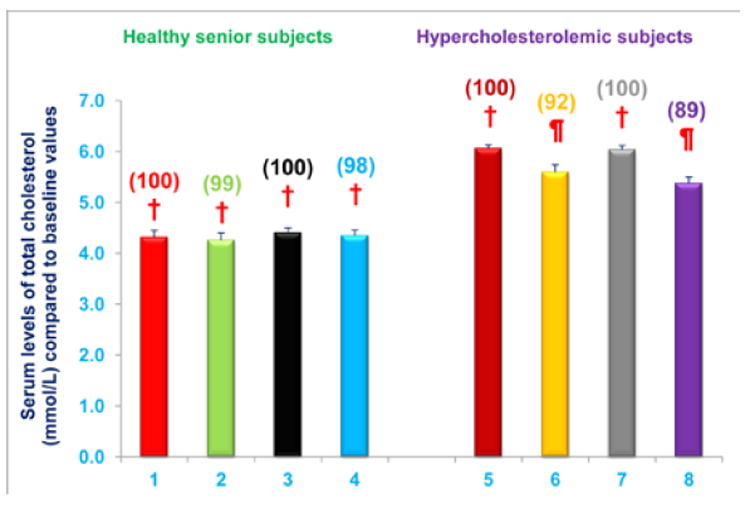
Columns 1-4 represent Group 1 subjects with normal initial total cholesterol levels. 1 = Baseline serum total cholesterol levels for 30 subjects; 2 = Total cholesterol levels for column 1 subjects after four weeks diet supplementation with NS-7 (Subgroup A); 3 = Baseline serum total cholesterol levels for 39 subjects; 4 = Total cholesterol levels for column 3 subjects after four weeks diet supplementation with NS-6 (Subgroup B). Columns 5-8 represent Group 2 subjects with elevated initial total cholesterol levels. 5 = Baseline serum total cholesterol levels for 41 subjects; 6 = Total cholesterol levels for column 5 subjects 4 weeks after changing to the AHA Step-1 diet and supplementation with NS-7 (Subgroup C); 7 = Baseline serum total cholesterol levels for 30 subjects; 8 = Total cholesterol levels for column 7 subjects four weeks after changing to the AHA Step-1 diet and supplementation with NS-6 (Subgroup D). Data are means ± SE. Values in a column not sharing a common symbol are significantly different at P < 0.05. Percentages of each treatment compared to baseline values are in parenthesis above the column.
Serum LDL-cholesterol levels were reduced in hypercholesterolemic subjects who were restricted to the AHA Step-1 diet and who received either NS-7 (subgroup C) or NS-6 (subgroup D) capsules after establishing baseline LDL-cholesterol levels. Serum LDL-cholesterol levels decreased by 10% and 13% (P < 0.05) for subgroups C and D, respectively, compared to baseline values (Figure 8). In contrast, serum LDL cholesterol levels were unchanged, compared to baseline levels, in free-living healthy seniors with normal baseline LDL cholesterol levels whose diets were supplemented with NS-7 or NS-6, but who did not restrict to the AHA Step-1 diet (subgroups A and B; Figure 8).
Figure 8. Serum LDL-cholesterol levels are decreased in hypercholesterolemic subjects who were restricted to the AHA Step-1 plus intake of NS-7 or NS-6 capsules, but not in free-living healthy seniors receiving only NS-7 or NS-6 capsules.
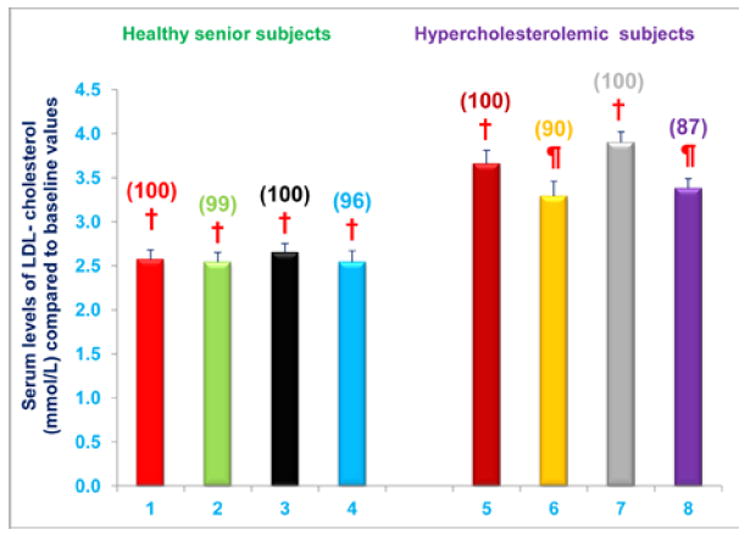
Columns 1-4 represent Group 1 subjects with normal initial total cholesterol levels. 1 = Baseline LDL-cholesterol levels for 30 subjects; 2 = LDL-cholesterol levels for column 1 subjects after four weeks diet supplementation with NS-7 (Subgroup A); 3 = Baseline LDL-cholesterol levels for 39 subjects; 4 = LDL-cholesterol levels for column 3 subjects after four weeks diet supplementation with NS-6 (Subgroup B). Columns 5-8 represent Group 2 subjects with elevated initial total cholesterol levels. 5 = Baseline LDL-cholesterol levels for 41 subjects; 6 = LDL-cholesterol levels for column 5 subjects four weeks after changing to the AHA Step-1 diet and supplementation with NS-7 (Subgroup C); 7 = Baseline LDL-cholesterol levels for 30 subjects; 8 = LDL-cholesterol levels for column 7 subjects four weeks after changing to the AHA Step-1 diet and supplementation with NS-6 (Subgroup D). Data are means ± SE. Values in a column not sharing a common symbol are significantly different at P < 0.05. Percentages of each treatment compared to baseline values are in parenthesis above the column.
Serum triglycerides levels were significantly reduced in hypercholesterolemic subjects who were restricted to the AHA Step-1 diet and who either NS-7 (subgroup C) or NS-6 (subgroup D) capsules after establishing baseline triglycerides levels. Serum triglycerides levels decreased by 16% and 23% (P < 0.05) for subgroups C and D, respectively, compared to baseline values (Figure 9). In contrast, serum triglycerides levels were unchanged, compared to baseline levels, in free-living healthy seniors with normal baseline triglycerides levels whose diets were supplemented with NS-7 or NS-6, but who did not restrict to the AHA Step-1 diet (subgroups A and B; Figure 9).
Figure 9. Serum triglycerides levels are decreased in hypercholesterolemic subjects who were restricted to the AHA Step-1 diet plus intake of NS-7 or NS-6 capsules, but not in free-living healthy seniors receiving only NS-7 or NS-6 capsules.
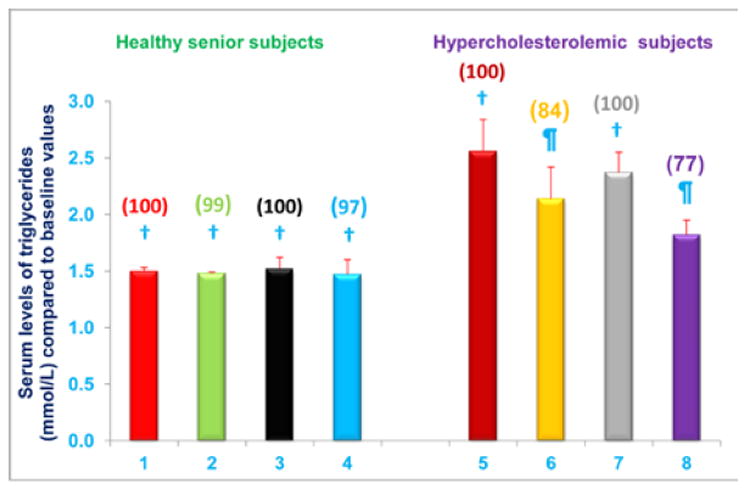
Columns 1-4 represent Group 1 subjects with normal initial total cholesterol levels. 1 = Baseline triglycerides levels for 30 subjects; 2 = Triglycerides levels for column 1 subjects after four weeks diet supplementation with NS-7 (Subgroup A); 3 = Baseline triglycerides levels for 39 subjects; 4 = Triglycerides levels for column 3 subjects after 4 weeks diet supplementation with NS-6 (Subgroup B). Columns 5-8 represent Group 2 subjects with elevated initial total cholesterol levels. 5 = Baseline triglycerides levels for 41 subjects; 6 = Triglycerides levels for column 5 subjects four weeks after changing to the AHA Step-1 diet and supplementation with NS-7 (Subgroup C); 7= Baseline triglycerides levels for 30 subjects; 8 = Triglycerides levels for column 7 subjects four weeks after changing to the AHA Step-1 diet plus intake of NS-6 (Subgroup D). Data are means ± SE. Values in a column not sharing a common symbol are significantly different at P < 0.05. Percentages of each treatment compared to baseline values are in parenthesis above the column.
Administration of NS-7 or NS-6 capsules, with or without dietary alteration, has no effect on serum HDL-cholesterol levels
Serum HDL-cholesterol levels were not changed from baseline levels in any of the study subgroups (A-D; Figure 10). Thus, diet supplementation alone with NS-7 or NS-6 capsules does not impact serum HDL-cholesterol levels in free-living healthy seniors. Serum HDL-cholesterol levels are also unaffected in hypercholesterolemic subjects who were restricted to the AHA Step-1 diet and receive NS-7 or NS-6 capsules (Figure 10).
Figure 10. Nutritional supplementation with NS-7 or NS-6, with or without dietary alteration, has no effect on serum HDL-cholesterol levels.
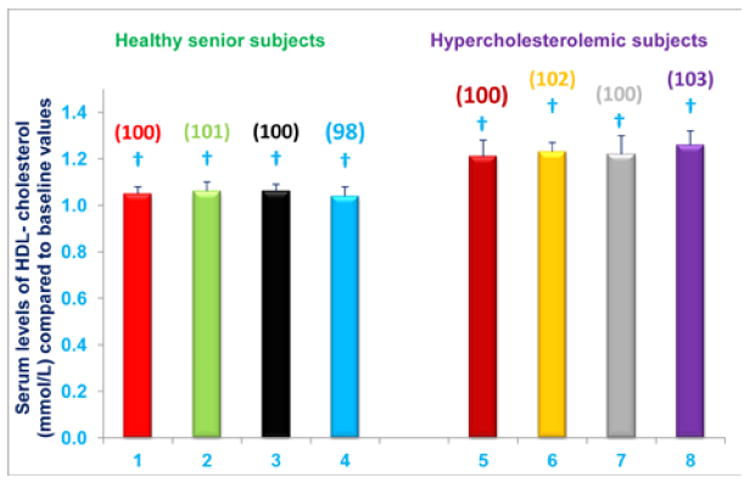
Columns 1-4 represent Group 1 subjects with normal initial total cholesterol levels. 1 = Baseline HDL-cholesterol levels for 30 subjects; 2 = HDL-cholesterol levels for column 1 subjects after four weeks diet supplementation with NS-7 (Subgroup A); 3 = Baseline HDL-cholesterol levels for 39 subjects; 4 = HDL-cholesterol levels for column 3 subjects after four weeks diet supplementation with NS-6 (Subgroup B). Columns 5-8 represent Group 2 subjects with elevated initial total cholesterol levels. 5 = Baseline HDL-cholesterol levels for 41 subjects; 6 = HDL-cholesterol levels for column 5 subjects four weeks after changing to the AHA Step-1 diet and supplementation with NS-7 (Subgroup C); 7= Baseline HDL-cholesterol levels for 30 subjects; 8 = HDL-cholesterol levels for column 7 subjects four weeks after changing to the AHA Step-1 diet and supplementation with NS-6 (Subgroup D). Data are means ± SE. Values in a column not sharing a common symbol are significantly different at P < 0.05. Percentages of each treatment compared to baseline values are in parenthesis above the column.
The collective results presented above support the conclusion that hypercholesterolemic patients receiving combined treatment with the AHA Step-1 diet and dietary supplementation with NS-7 or NS-6 have significantly reduced serum total cholesterol, LDL-cholesterol and triglycerides levels compared to respective controls (Group 1; subgroups C and D). Dietary supplementation with NS-7 or NS-6 alone, without dietary restrictions, did not lower serum total cholesterol, LDL-cholesterol or triglycerides levels in free-living healthy seniors (Group 2; subgroups A and B).
Discussion
The key findings of the current study are: 1) that serum NO levels were significantly increased in seniors compared to both children (~80%) and young adults (~65%); 2) that diet supplementation with either NS-7 or NS-6 significantly decreased serum levels of NO, CRP, uric acid and γ-GT activity in free-living healthy seniors; 3) that serum levels of NO, CRP, uric acid, γ-GT activity, total cholesterol, LDL-cholesterol, and triglycerides were significantly decreased in hypercholesterolemic subjects who were restricted to the AHA Step-1 diet and whose diets were supplemented with NS-7 or NS-6 capsules, and; 4) that TAS was increased in free-living healthy seniors receiving diet supplementation alone with NS-7 or NS-6, and in hypercholesterolemic subjects who were restricted to the AHA Step-1 diet and whose diets were supplemented with NS-7 or NS-6 capsules.
Elevated serum levels of CRP, uric acid, and γ-GT activity are all associated with an increased risk for cardiovascular disease. Similarly, NO has been implicated in the pathogenesis of a variety of age associated diseases. Consequently, the results of the current study, which demonstrate that NO levels are increased substantially in elderly humans compared to children or young adults, and that diet supplementation with NS-7 or NS-6 for four weeks results in significant decreases in serum levels of NO, CRP, uric acid, and γ-GT activity suggests that these dietary supplements could have long term beneficial health effects.
The study was designed so that the effects of dietary supplementation alone could only be detected in study subjects with normal serum total cholesterol levels (Group 1). In hypercholesterolemic subjects (Group 2), four week dietary supplementation with NS-7 or NS-6 was implemented simultaneously with a change to the AHA Step-1 diet, and these interventions also resulted in decreased serum levels of NO, CRP, uric acid, and γ-GT activity compared to baseline. Consequently, we could not discern to what extent the decreases in these parameters were due to dietary change vs. dietary supplementation in hypercholesterolemic subjects. Nevertheless, the combined effects of dietary change and dietary supplementation with NS-7 or NS-6 on serum levels of NO, CRP, uric acid, and γ-GT activity are potentially important, as hypercholesterolemic subjects are at greatest risk for poor cardiovascular outcomes.
Interestingly, diet supplementation alone with NS-7 or NS-6 did not have a significant effect on serum total cholesterol, LDL-cholesterol, HDL-cholesterol, or triglycerides levels in subjects with normal baseline total-cholesterol levels (Group 1). In hypercholesterolemic subjects (Group 2), four week dietary supplementation with NS-7 or NS-6 was implemented simultaneously with a change to the AHA-Step-1 diet, and these interventions resulted in decreased serum total cholesterol, LDL-cholesterol, and triglycerides levels compared to baseline. Again, we could not discern to what extent these decreases were due to dietary change vs. dietary supplementation in hypercholesterolemic subjects. Nevertheless, the combined effects of dietary change and dietary supplementation with NS-7 or NS-6 on serum total cholesterol, LDL-cholesterol, and triglycerides levels were beneficial and somewhat greater than the approximate 5% decreases we have consistently observed after acclimation to the AHA-Step-1 diet alone in our previously published studies [26-28]. Conservatively, it appears safe to conclude that diet supplementation with NS-7 or NS-6 does not adversely impact the beneficial effects of the AHA-Step-1 diet on serum levels of total cholesterol, LDL-cholesterol, and triglycerides.
The active ingredients of NS-7 are resveratrol, pterostilbene, quercetin, riboflavin, morin hydrate, δ-tocotrienol, and nicotinic acid (25 mg of each). NS-6 differed from NS-7 by increasing the quercetin content from 25 mg to 50 mg and excluding morin hydrate. All of these active ingredients have been approved by the FDA for human consumption, and used for many years without significant adverse effects [18,19]. Consequently, the potentially beneficial effects of diet supplementation with NS-7 and NS-6 demonstrated in this study can be achieved with relatively few regulatory obstacles.
Reduction of CRP and NO serum levels by NS-7 and NS-6 nutritional supplements, without any adverse effects, constitute an important finding. Serum CRP levels have recently been shown to be decreased in healthy men and women consuming statin drugs to lower risk of heart disease [22,29]. There is no doubt that statins are very potent drugs for lowering serum levels of total cholesterol, LDL-cholesterol, triglycerides, and CRP in hypercholesterolemic subjects. Rosuvastatin (a commercial statin drug) also lowered CRP levels in healthy subjects, but its prolonged use resulted in serious side-effects, including muscle weakness, stomach cramps and fatigue [22,29]. It has also been suggested that prolonged use of statin drugs in healthy humans may cause cancer or diabetes, so it is critical to search for alternative agents with similarl beneficial effects [29].
The use of various mixtures of resveratrol, quercetin, δ-tocotrienol, and other polyphenols with similar biological properties could represent an alternative option for patients with hypercholesterolemia. We have clearly demonstrated the beneficial effects of nutritional supplementation with these compounds on CRP, NO, uric acid and γ-GT activity, and it appears that they may also enhance the cholesterol lowering effects of the AHA Step-1 diet. Therefore, dietary supplementation with NS-7 or NS-6 might play a major role in future treatment of patients suffering from age-related diseases associated with inflammation and hypercholesterolemia.
We have recently reported a possible mechanism by which these compounds regulate the production of NO and several pro-inflammatory cytokines via the proteasome [1,2], though others have proposed that these compounds suppress NO production due to their antioxidant and free-radical scavenging properties [30,31]. All these compounds appear to be relatively potent inhibitors of multiple proteasome subunits that are critically engaged in regulating the production of inflammatory mediators [2,3]. More specifically, we demonstrated that these compounds decrease proteolytic degradation of P-IκB by the proteasome, which in turn, decreases translocation of activated NF-κB to the nucleus, thereby depressing transcription of TNF-α, iNOS, IL-6, and IL-1β genes [1,2]. It is therefore likely that the combined proteasome inhibitory, antioxidant, and anti-inflammatory properties of these nutritional supplements contributed to their capacity to decrease serum levels of various markers associated with inflammation and atherosclerosis in humans.
Conclusions
The main conclusions in the present study are as follows:
This is the first report, which describes elevated (80%) plasma NO levels in free-living healthy seniors (~70-years-old) compared to children (~4-years old) and young adults (~30 years old).
Diet supplementation with either NS-7 (resveratrol, pterostilbene, morin hydrate, quercetin, δ-tocotrienol, riboflavin, and nicotinic acid) or NS-6 (resveratrol, pterostilbene, quercetin, δ-tocotrienol, riboflavin, and nicotinic acid) significantly decreased serum levels of NO, CRP, uric acid and γ-GT activity in seniors with normal serum total cholesterol levels. Increased risk for cardiovascular disease has been associated with elevated levels of each of these markers, so diet supplementation with NS-7 or NS-6 could, potentially, reduce the risk of cardiovascular disease in free-living healthy seniors.
Serum levels of NO, CRP, uric acid, γ-GT activity, total cholesterol, LDL-cholesterol, and triglycerides were significantly decreased in hypercholesterolemic subjects who were restricted to the AHA Step-1 diet and whose diets were supplemented with NS-7 or NS-6 capsules. The simultaneous implementation of the AHA Step-1 diet and supplementation with NS-7 or NS-6 capsules prevented determination of the relative contribution of diet alteration vs. diet supplementation on these parameters in this population. The AHA Step-1 diet has never previously been shown to decrease serum levels of NO, CRP, uric acid, γ-GT activity, and the combined effects of diet supplementation and diet alteration on lipid profiles in the current study are greater than those anticipated based on our previously published studies. Conservatively, it appears safe to conclude that diet supplementation with NS-7 or NS-6 does not adversely impact the beneficial effects of the AHA-Step-1 diet on serum total cholesterol, LDL-cholesterol, and triglycerides levels. Importantly, the beneficial effects of diet supplementation with NS-7 or NS-6 on serum levels of NO, CRP, uric acid, γ-GT activity appear to be sustained in this population. Thus, diet supplementation with NS-7 or NS-6 is likely to have beneficial health effects in this high risk population.
This lowering of lipid parameters was due to δ-tocotrienol, nicotinic acid, and resveratrol in NS-7 and NS-6 mixtures. δ-Tocotrienol is a potent inhibitor of β-hydroxy-β-methylglutaryl-CoA reductase activity (the rate-limiting enzyme of cholesterol biosynthesis), modulated by post-transcription mechanism [12]. Nicotinic acid is potent hypolipidemic agent, and resveratrol through the activation of cholesterol 7α-hydroxylase (the rate-limiting enzyme of degradation of cholesterol via bile acid synthetic pathways [32]).
In short, the present findings on the inhibition of NO production and other cardiovascular risk factors by the components of NS-7 and NS-6 mixtures are likely to have cardio-prevention and clinical significance with regards to host defense mechanisms against infection and treatments of inflammatory diseases.
Acknowledgments
We thank Mr. Keith Gilchrist (USDA, ARS, MWA, Cereals and Crops Research Laboratory, Madison, WI, 53726, USA) for carrying out statistical analyses of this data. We also thank Dr. Mostafa Z Badr (Division of Pharmacology and Toxicology, School of Pharmacy, University of Missouri-Kansas City, 2464 Charlotte Street, Kansas City, MO 64108, USA), and Miss Areeba Qazi for reviewing, and proof reading the manuscript. The studies were supported by AMR (Advanced Medical Research, Madison, WI, USA) and in part, by NIH grant GM-50870 (NQ). The study was carried out under a FDA approved IND number 36906.
Abbreviations
- CRP
C - reactive protein
- IL-1β
Interleukin-1β
- IL-6
Interleukin-6
- iNOS
Inducible Nitric Oxide Synthase
- IκB
Interferon kappa B
- γ-GT
γ-Glutamyltransferase
- LPS
Lipopolysaccharide
- NF-κB
Nuclear Factor-kappa B
- TAS
Total Antioxidant Status
- TNF-α
Tumor Necrosis Factor-alpha
- AHA Step-1 diet
American Heart Association Step-1 diet
Footnotes
Competing Interests
The authors declare that they have no competing interests.
Publisher's Disclaimer: This is an open-access article distributed under the terms of the Creative Commons Attribution License, which permits unrestricted use, distribution, and reproduction in any medium, provided the original author and source are credited.
References
- 1.Qureshi AA, Tan X, Reis JC, Badr MZ, Papasian CJ, et al., editors. Inhibition of nitric oxide in LPS-stimulated macrophages of young and senescent mice by δ-tocotrienol and quercetin. Lipids Health Dis. 2011;10:239. doi: 10.1186/1476-511X-10-239. [DOI] [PMC free article] [PubMed] [Google Scholar]
- 2.Qureshi AA, Tan X, Reis JC, Badr MZ, Papasian CJ, et al. Suppression of nitric oxide production and pro-inflammatory cytokines by novel proteasome inhibitors in various experimental models. Lipids Health Dis. 2011;10:177. doi: 10.1186/1476-511X-10-177. [DOI] [PMC free article] [PubMed] [Google Scholar]
- 3.Qureshi AA, Guan XQ, Reis JC, Papasian CJ, Morrison DC, et al. Inhibition of nitric oxide and inflammatory cytokines in LPS-stimulated murine macrophages by resveratrol, potent proteasome inhibitor. Lipids Health Dis. 2012;11:76. doi: 10.1186/1476-511X-11-76. [DOI] [PMC free article] [PubMed] [Google Scholar]
- 4.Qureshi AA, Reis JC, Papasian CJ, Morrison DC, Qureshi N. Tocotrienols inhibit lipopolysacharide-induced pro-inflammatory cytokines in macrophages of female mice. Lipids Health Dis. 2010;9:143. doi: 10.1186/1476-511X-9-143. [DOI] [PMC free article] [PubMed] [Google Scholar]
- 5.Ross R. Atherosclerosis---ant-inflammatory diseases. N Engl J Med. 1999;340:115–126. doi: 10.1056/NEJM199901143400207. [DOI] [PubMed] [Google Scholar]
- 6.Rus HG, Niculescu F, Vlaicu R. Tumor necrosis factor-alpha in human arterial wall with atherosclerosis. Atherosclerosis. 1991;89:247–254. doi: 10.1016/0021-9150(91)90066-c. [DOI] [PubMed] [Google Scholar]
- 7.Barath P, Fishbein MC, Cao J, Berenson J, Helfant RH, et al. Detection and localization of tumor necrosis factor in human atheroma. Am J Cardiol. 1990;65:297–302. doi: 10.1016/0002-9149(90)90291-8. [DOI] [PubMed] [Google Scholar]
- 8.Barath P, Fishbein MC, Cao J, Berenson J, Helfant RH, et al. Tumor necrosis factor gene expression in human vascular intimal smooth muscle cells detected by in situ hybridization. Am J of Pathology. 1990;137:503–509. [PMC free article] [PubMed] [Google Scholar]
- 9.McCary MF. Interleukin-6 as a central mediator of cardiovascular risk associated with chronic inflammation, smoking, diabetes, and visceral obesity: down regulation with essential fatty acids, ethanol and pentoxifylline. Med Hypotheses. 1999;52:465–477. doi: 10.1054/mehy.1997.0684. [DOI] [PubMed] [Google Scholar]
- 10.Mehta JL, Saldeen TGP, Rand K. Interactive role of infection, inflammation and traditional risk factors in atherosclerosis and coronary artery disease. J Am Coll Cardiol. 1998;31:1217–1225. doi: 10.1016/s0735-1097(98)00093-x. [DOI] [PubMed] [Google Scholar]
- 11.Libby P, Ridker PM. Novel inflammatory markers of coronary risk. Theory versus practice. Circulation. 1999;100:1148–1150. doi: 10.1161/01.cir.100.11.1148. [DOI] [PubMed] [Google Scholar]
- 12.Qureshi AA, Reis JC, Qureshi N, Papasian CJ, Morrison DC, et al., editors. δ-Tocotrienol and quercetin reduce serum levels of nitric oxide and lipid parameters in female chickens. Lipids Health Dis. 2011;10:39. doi: 10.1186/1476-511X-10-39. [DOI] [PMC free article] [PubMed] [Google Scholar]
- 13.Bradamante S, Barenghi L, Piccinini F, Bertelli AA, de Jonge R, et al. Resveratrol provides late-phase cardioprotection by means of a nitric oxide- and adenosine-mediated mechanism. Eur J Pharmacol. 2003;465:115–123. doi: 10.1016/s0014-2999(03)01441-9. [DOI] [PubMed] [Google Scholar]
- 14.Ferrieres J. The French Paradox; Lessons for other countries. Heart. 2004;90:107–111. doi: 10.1136/heart.90.1.107. [DOI] [PMC free article] [PubMed] [Google Scholar]
- 15.Remsberg CM, Yanez JA, Ohgami Y, Vega-Villa KR, Rimando AM, et al. Phamacometric of pterostilbene: Pre-clinical pharmacokinetics and metabolism, anti-cancer, anti-inflammatory, anti-oxidant and analgesic activity. Phytother Res. 2008;22:169–179. doi: 10.1002/ptr.2277. [DOI] [PubMed] [Google Scholar]
- 16.Yugarani T, Tan BKH, Reh M, Das NP. Effects of polyphenolic natural products on the lipid profiles of rats fed high fat diets. Lipids. 1992;27:181–186. doi: 10.1007/BF02536175. [DOI] [PubMed] [Google Scholar]
- 17.Qureshi AA, Mo H, Packer L, Peterson DM. Isolation and structural identification of novel tocotrienols from rice bran with hypocholesterolemic, antioxidant and antitumor properties. J Agric Food Chem. 2000;48:3130–3140. doi: 10.1021/jf000099t. [DOI] [PubMed] [Google Scholar]
- 18.Sen CK, Khanna S, Roy S. Tocotrienols in health and diseases: The other half of the natural vitamin E family. Mol Aspects Med. 2007;28:692–728. doi: 10.1016/j.mam.2007.03.001. [DOI] [PMC free article] [PubMed] [Google Scholar]
- 19.Middleton E, Jr, Kandaswami C, Theoharides TC. The effects of plant flavonoids on mammalian cells: Implications for inflammation, heart disease, and cancer. Pharmacol Rev. 2000;52:673–751. [PubMed] [Google Scholar]
- 20.Miller NJ, Rice-evans C, Davis MJ, Gopinathan V, Milner A. A novel method of measuring antioxidant capacity and its application to monitoring the antioxidant status in premature neonates. Clin Sci (Lond) 1993;84:407–412. doi: 10.1042/cs0840407. [DOI] [PubMed] [Google Scholar]
- 21.Chen LC, Pace JL, Russell SW, Morrison DC. Altered regulation of inducible nitric oxide synthase expression in macrophages from senescent mice. Infect Immun. 1996;64:4288–4298. doi: 10.1128/iai.64.10.4288-4298.1996. [DOI] [PMC free article] [PubMed] [Google Scholar]
- 22.Ridker PM, Danielson E, Fonseca FAH, Genest J, Gotto AM, et al. Rosuvastatin to prevent vascular events in men and women with elevated C-reactive protein. N Engl J Med. 2008;359:2195–2207. doi: 10.1056/NEJMoa0807646. [DOI] [PubMed] [Google Scholar]
- 23.Lee DH, Blomhoff R, Jacob DR., Jr Is serum gamma-glutamyltransferase acts as a marker of oxidative stress? Free Radic Res. 2004;38:535–539. doi: 10.1080/10715760410001694026. [DOI] [PubMed] [Google Scholar]
- 24.Culleton BF, Larson MG, Kannel WB, Levy D. Serum uric acid and risk for cardiovascular disease and death: the Framingham Heart Study. Ann Intern Med. 1999;131:7–13. doi: 10.7326/0003-4819-131-1-199907060-00003. [DOI] [PubMed] [Google Scholar]
- 25.Libby P, Hansson GK, Pober JS. Atherogenesis and inflammation. In: Chein KR, editor. Molecular Basis of Cardiovascular Disease. Philadelphia: W. B. Saunders Company; 1999. pp. 349–366. [Google Scholar]
- 26.Qureshi AA, Bradlow BA, Salser WA, Brace LD. Novel tocotrienols of rice bran modulate cardiovascular disease risk parameters of hypercholesterolemic humans. J Nutr Biochem. 1997;8:290–298. [Google Scholar]
- 27.Qureshi AA, Sami SA, Salser WA, Khan FA. Synergistic effect of tocotrienol-rich fraction (TRF(25)) of rice bran and lovastatin on lipid parameters in hypercholesterolemic humans. J Nutr Biochem. 2001;12:318–329. doi: 10.1016/s0955-2863(01)00144-9. [DOI] [PubMed] [Google Scholar]
- 28.Qureshi AA, Sami SA, Salser WA, Khan FA. Dose-dependent suppression of serum cholesterol by tocotrienol-rich fraction (TRF25) of rice bran and in hypercholesterolemic humans. Atherosclerosis. 2002;161:199–207. doi: 10.1016/s0021-9150(01)00619-0. [DOI] [PubMed] [Google Scholar]
- 29.Sanderson K. Should healthy people take statins too. Nature. 2008:1–3. [Google Scholar]
- 30.Moncada S, Palmer RM, Higgs EA. Nitric oxide: physiology, pathology, and pharmacology. Pharmacol Rev. 1991;43:109–142. [PubMed] [Google Scholar]
- 31.Murota K, Terao J. Anti-oxidative flavonoids quercetin: Implication of its intestinal absorption and metabolism. Arch Biochem Biophys. 2003;417:12–17. doi: 10.1016/s0003-9861(03)00284-4. [DOI] [PubMed] [Google Scholar]
- 32.Chen Q, Wang E, Ma Liping, Zhai P. Dietary resveratrol increases the expression of hepatic 7alpha-hydroxylase and ameliorates hypercholesterolemia in high-fat fed C57BL/6J mice. Lipids Health Dis. 2012;11:56. doi: 10.1186/1476-511X-11-56. [DOI] [PMC free article] [PubMed] [Google Scholar]