Abstract
This study analyzes available severe fever with thrombocytopenia syndrome virus (SFTSV) genomes and reports that a sublineage of lineage I bears a unique M segment recombined from two of three prevailing SFTSV lineages. Through recombination, the sublineage has acquired nearly complete G1 associated with protective epitopes from lineage III, suggesting that this recombination has the capacity to induce antigenic shift of the virus. Therefore, this study provides some valuable implications for the vaccine design of SFTSV.
TEXT
In May 2007, three patients with fever, abdominal pain, bloating, nausea, vomiting, gastrointestinal bleeding, and elevated levels of amino-transferases were reported in Henan Province of China (28). Similar cases were also found in Shandong, Jiangsu, Hubei, and Anhui provinces (28, 29). As of June 2011, at least 42 people died from the disease (http://www.xyw.gov.cn/zt201106p/). The disease, with an initial case fatality rate of approximately 30%, was termed severe fever with thrombocytopenia syndrome (SFTS) (7). Recently, it has been reported that SFTS has the potential of person-to-person transmission (1, 2, 8). Its pathogen, designated SFTS virus (SFTSV) (29) or Huaiyangshan virus (HYSV) (5, 30, 31), is a novel member of the Phlebovirus genus in the Bunyaviridae family.
SFTSV has a single-stranded negative-sense RNA genome comprising three segments, S, M, and L. Segment M encodes the two viral envelope glycoproteins, G1 and G2, which are involved in immunogenicity and neutralizing or protective epitopes (25). Genetic diversity of SFTSV was reported in a recent study (31). In order to control the virus, it is necessary to know the mechanism resulting in its genetic diversity. In this study, we analyze all available SFTSV sequences and report a prevailing SFTSV lineage with the recombinant M gene. This finding might provide important insights into the contribution of recombination in shaping the genetic diversity of SFTSV.
All available SFTSV sequences were collected from GenBank and aligned with CLUSTALW (24). The alignment file is available online (http://user.qzone.qq.com/1530879254?ptlang=2052#!app=2&pos=1337175833). Neighbor-joining (NJ), maximum parsimony (MP), and maximum-likelihood (ML) phylogenetic trees were constructed by using MEGA5 (23). The best-fit substitution model, the general time reversible (GTR) model, was used for ML analysis according to Bayesian information criteria within the MEGA5 software. Identification methods of recombinants were described in previous reports (11, 13). Briefly, the gene sequence similarity analyses were performed and displayed as graphics with Simplot software (15). The sequence alignment files were sought for potential mosaic viruses using the recombination detection program software package RDP2 (17). At last, incongruent phylogenetic relations of different regions of segment M delimited by potential breakpoint(s) were used to determine the recombination event.
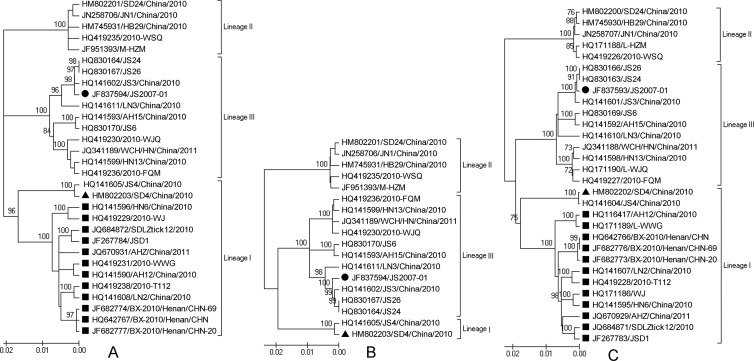
According to the available M and L segment sequences, SFTSV can be divided into three lineages (Fig. 1), and there were two sublineages in lineage I (Fig. 1A and C). Interestingly, the larger sublineage of lineage I was found to have significant recombination signals in its M segment after deep phylogenetic analysis.
Fig 1.
The evolutionary history of SFTSV circulating in China inferred from sequences of M and L segments. (A) The phylogenetic history of M segment; (B) the phylogenetic history of the M segment (deleting recombinants); (C) the evolution history of the L segment. The percentages of replicate trees in which the associated taxa clustered together in the bootstrap test (1,000 replicates) are shown next to the branches. The evolutionary history was inferred using the neighbor-joining (NJ) method. Branches corresponding to partitions reproduced in less than 50% bootstrap replicates are collapsed. The tree is drawn to scale, with branch lengths in the same units as those of the evolutionary distances used to infer the phylogenetic tree. The evolutionary distances were computed using the maximum composite likelihood (MCL) method and are in the units of the number of base substitutions per site. The rate variation among sites was modeled with a gamma distribution. The potential recombinants are marked with ■. Lineages I and III are indicated with ▲ and ●, respectively.
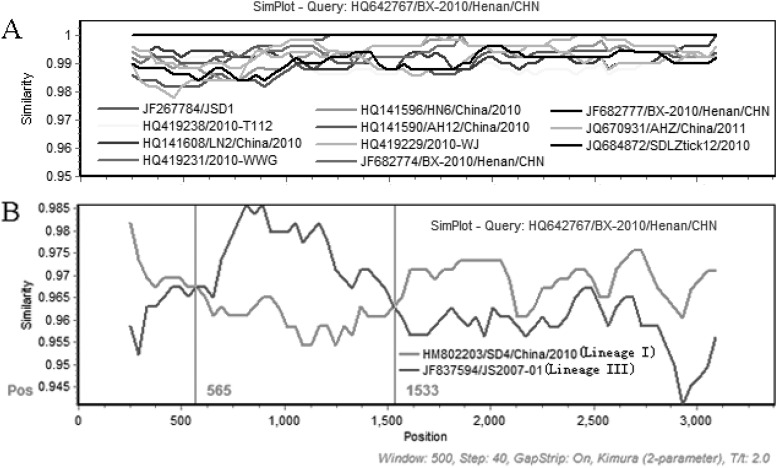
At first, the M segment sequences were compared. All members of the potential recombinant group shared high sequence similarity (>98%) with each other (Fig. 2A). When representatives of these potential recombinants, lineages I and III (HQ642767/BX-2010/Henan/CHN, HM802203/SD4/China/2010, and JF837594/JS2007-01), were compared, it was found that there were two crossover sites around positions 565 and 1533 if HQ642767/BX-2010/Henan/CHN was used as the query (Fig. 2B). HQ642767/BX-2010/Henan/CHN and JF837594/JS2007-01 of lineage III had higher similarities between the two crossover sites, which was contrary to other regions (Fig. 2B).
Fig 2.
(A) A sequence comparison of the segment M of all recombinant viruses. HQ642767/BX-2010/Henan/CHN is used as the query. The y axis gives the percentage of identity within a sliding window 500 bp wide centered on the position plotted, with a step size between plots of 40 bp. (B) A sequence comparison of the segment M of HQ642767/BX-2010/Henan/CHN and the two parent lineage representatives, JF837594/JS2007-01 and HM802203/SD4/China/2010. The recombinant HQ642767/BX-2010/Henan/CHN was used as the query. The red vertical lines represent the two crossover sites. The rest is the same as described for panel A.
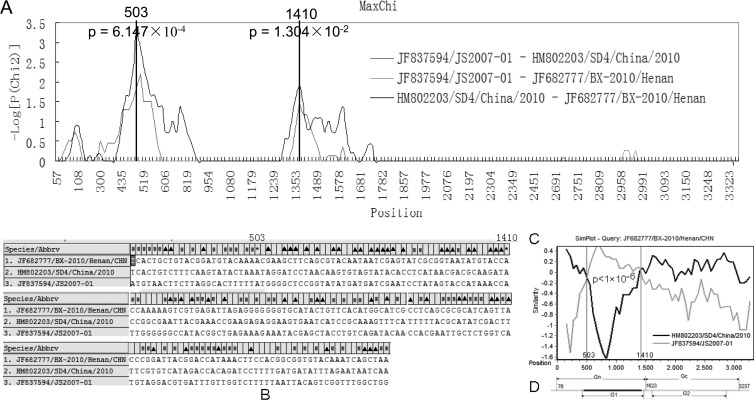
Because the crossover sites depended on the sliding window size, they might be different from the recombination breakpoints. Therefore, the RDP2 software package was used to identify the potential breakpoint and to determine the recombination event. Six recombination detection programs implemented in RDP2 supported that there was a recombination signal with two putative breakpoints (positions 503 and 1410 of the alignment): RDP (16), P = 3.2 × 10⁻³; Bootscan (17), P = 6.9 × 10⁻³; Maxchi (22), P = 6.1 × 10⁻⁴; Chimaera (20), P = 8.4 × 10⁻⁴; Siscan (9), P = 7.1 × 10⁻¹⁶; 3Seq (3), P = 1.3 × 10⁻³. The result of MaxChi is shown in Fig. 3A. The analysis of variable sites of the three viruses also determined the potential breakpoints. In different regions delimited by the two breakpoints, identities of variable sites of HQ642767/BX-2010/Henan/CHN and each putative parent were significantly different (Fig. 3B and C) (Fisher's exact test, P < 1 × 10⁻⁶). The schematic drawing of the mosaic M segment is also shown in Fig. 3D.
Fig 3.
(A) The analysis of putative breakpoints in the M segment employing the MaxChi method. The vertical lines represent the putative recombination breakpoints. P values of recombination analysis are shown near the breakpoints. (B) Alignment of M segment variable sites of HQ642767/BX-2010/Henan/CHN and its parent lineage representatives (JF837594/JS2007-01 and HM802203/SD4/China/2010). The recombinant variable sites identical to JF837594/JS2007-01 and HM802203/SD4/China/2010 are, respectively, indicated with ▲ and ■. The putative breakpoints are indicated with an asterisk. (C) Comparison of the segment M variable sites between HQ642767/BX-2010/Henan/CHN and each of its parent lineage representatives. The y axis gives the percentage of identity between the recombinant and putative parents. The x axis represents the nucleotide position of the M segment. Fisher's exact test was employed to test the different significance of these variable sites. The P value is shown between the two putative breakpoints. (D) A schematic representation of the recombinant M segment. The regions encoding Gn/G1 and Gs/G2 are shown. The recombination region is marked in black.
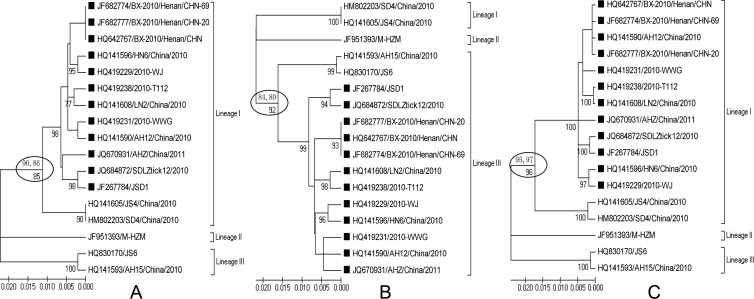
SFTSV phylogenetic histories of different regions delimited by the breakpoints were reanalyzed to further determine the recombination event in the M segment. As predicted, the recombinant group had incongruent phylogenetic histories in different regions of segment M. The recombinant group came forth in lineage I when SFTSV phylogenetic history was reconstructed using the sequence of the region before position 503 (Fig. 4A) and after 1410 (Fig. 4C). On the contrary, the homologous recombination (HR) group was clustered into lineage III between the two putative breakpoints (Fig. 4B).
Fig 4.
Phylogenetic history of different regions of the M segment delimited by the putative breakpoints. (A) Phylogenetic history inferred from positions 1 to 503 of segment M. (B) Phylogenetic relationship inferred from positions 504 to 1410. (C) Phylogenetic tree inferred from positions 1410 to 3379. The MCL of the NJ method was employed to reconstruct the phylogenetic history. Two thousand bootstrap replicates were performed to assess the robustness of the clustering. The bootstrap values (more than 70%) were shown under each branch. The phylogenetic history of each region was also reconstructed by using the MP and ML methods. The three methods obtained the same topology. The bootstrap values of the MP (left) and ML (right) methods are listed above the branches, including the recombinants. The recombinant strains were marked with ■.
These results provided robust evidence that homologous recombination played a key role in diversity of SFTSV. In the recombinant M segment, the region encoding nearly complete protein G1 was descended from lineage III, other regions from lineage I (Fig. 3D). All recombinant strains shared the same recombination event and high sequence identity and comprised a monophyletic group, suggesting that they should be descended from a common recombinant ancestor. Therefore, this recombinant lineage had a unique origin different from other SFTSV strains of lineage I.
For a recombination event, coinfection is necessary. The most suitable hosts for such coinfection events are via vectors, where the virus can persist and undergo vertical transmission, which further increases the probability of recombination. Therefore, the host Haemaphysalis longicornis of SFTSV could provide the place of the coinfection and recombination for the virus.
Recombination can influence the reliability of phylogenetic analysis (20). It is true that there is a topologic difference between the phylogenetic trees with (Fig. 1A) and without (Fig. 1B) the recombinant group. In the phylogenetic tree without recombinants, lineages I and III constitute a monophyletic group, which consists of the tree inferred from the L segment (Fig. 1B and C).
As gene reassortment takes place, recombination processes will allow some viruses to acquire many of the key adaptive mutations in a single step and hence make a major leap in fitness space, which might result in a change of host tropism (14). HR can also cause antigenic shift, which is important for the emergence of new viral pathogens (6, 27). Here, HR is found in the M segment, which encodes the protective epitopes of the virus in G1 and G2 (25). G1 is also an important virulence determinant (18).Through HR, lineage I has acquired nearly complete G1 from lineage III. It means that this recombination might cause the change of antigenicity and virulence of lineage I. Thus, this study provides the potential implications for vaccine design of the virus.
HR has been considered a key genetic diversity mechanism for positive-sense RNA viruses. However, intragenic recombination was considered being rare in negative-strand RNA virus (NSRV), including important human pathogens such as influenza, Ebola, and hantaviruses (4, 10). These viruses have been thought to generate genetic diversity necessary for successful evolution, via mutation and reassortment of those with segmented genomes (19). Nevertheless, NSRV pathogens originating from HR and circulating in the field have been reported in influenza (12, 13), Ebola (26), and hantaviruses (19, 21). Coinfection experiments have also confirmed that HR can occur in the hantaviruses of the Bunyaviridae family (19). Here, our study suggests that HR results in the new SFTSV sublineage circulating in China, which further determines that HR is an important molecular mechanism of NSRV diversity.
In conclusion, this study provides evidence that HR is a key molecular mechanism resulting in the rapid evolution of SFTSV. Considering that HR could bring unpredicted results in viral pathogen, such as the change of antigenicity and virulence, this study also provides valuable clues for a vaccine design for the virus.
ACKNOWLEDGMENTS
This work was supported by the Projects of Shandong Province Higher Educational Science and Technology Program (J09LCD209-12 and J12LE06) and the Shandong Province Young and Middle-Aged Scientists Research Awards Fund (BS2009NY011).
Footnotes
Published ahead of print 29 August 2012
REFERENCES
- 1. Bao CJ, et al. 2011. A family cluster of infections by a newly recognized bunyavirus in eastern China, 2007: further evidence of person-to-person transmission. Clin. Infect. Dis. 53:1208–1214 [DOI] [PubMed] [Google Scholar]
- 2. Bao CJ, Qi X, Wang H. 2011. A novel bunyavirus in China. N. Engl. J. Med. 365:862–865 [DOI] [PubMed] [Google Scholar]
- 3. Boni MF, Posada D, Feldman MW. 2007. An exact nonparametric method for inferring mosaic structure in sequence triplets. Genetics 176:1035–1047 [DOI] [PMC free article] [PubMed] [Google Scholar]
- 4. Chare ER, Gould EA, Holmes EC. 2003. Phylogenetic analysis reveals a low rate of homologous recombination in negative-sense RNA viruses. J. Gen. Virol. 84:2691–2703 [DOI] [PubMed] [Google Scholar]
- 5. Chen XP, et al. 2012. Infection and pathogenesis of Huaiyangshan virus (a novel tick-borne bunyavirus) in laboratory rodents. J. Gen. Virol. 93:1288–1293 [DOI] [PubMed] [Google Scholar]
- 6. Crawford-Miksza LK, Schnurr DP. 1996. Adenovirus serotype evolution is driven by illegitimate recombination in the hypervariable regions of the hexon protein. Virology 224:357–367 [DOI] [PubMed] [Google Scholar]
- 7. Feldmann H. 2011. Truly emerging—a new disease caused by a novel virus. N. Engl. J. Med. 364:1561–1563 [DOI] [PMC free article] [PubMed] [Google Scholar]
- 8. Gai Z, et al. 2012. Person-to-person transmission of severe fever with thrombocytopenia syndrome bunyavirus through blood contact. Clin. Infect. Dis. 54:249–252 [DOI] [PMC free article] [PubMed] [Google Scholar]
- 9. Gibbs MJ, Armstrong JS, Gibbs AJ. 2000. Sister-scanning: a Monte Carlo procedure for assessing signals in recombinant sequences. Bioinformatics 16:573–582 [DOI] [PubMed] [Google Scholar]
- 10. Han GZ, Worobey M. 2011. Homologous recombination in negative sense RNA viruses. Viruses 3:1358–1373 [DOI] [PMC free article] [PubMed] [Google Scholar]
- 11. He CQ, et al. 2010. Intragenic recombination as a mechanism of genetic diversity in bluetongue virus. J. Virol. 84:11487–11495 [DOI] [PMC free article] [PubMed] [Google Scholar]
- 12. He CQ, et al. 2012. Identification of three H1N1 influenza virus groups with natural recombinant genes circulating from 1918 to 2009. Virology 427:60–66 [DOI] [PubMed] [Google Scholar]
- 13. He CQ, et al. 2009. Homologous recombination as an evolutionary force in the avian influenza A virus. Mol. Biol. Evol. 26:177–187 [DOI] [PubMed] [Google Scholar]
- 14. Kuiken T, et al. 2006. Host species barriers to influenza virus infections. Science 312:394–397 [DOI] [PubMed] [Google Scholar]
- 15. Lole KS, et al. 1999. Full-length human immunodeficiency virus type 1 genomes from subtype C-infected seroconverters in India, with evidence of intersubtype recombination. J. Virol. 73:152–160 [DOI] [PMC free article] [PubMed] [Google Scholar]
- 16. Martin D, Rybicki E. 2000. RDP: detection of recombination amongst aligned sequences. Bioinformatics 16:562–563 [DOI] [PubMed] [Google Scholar]
- 17. Martin DP, Williamson C, Posada D. 2005. RDP2: recombination detection and analysis from sequence alignments. Bioinformatics 21:260–262 [DOI] [PubMed] [Google Scholar]
- 18. Pekosz A, Griot C, Stillmock K, Nathanson N, Gonzalez-Scarano F. 1995. Protection from La Crosse virus encephalitis with recombinant glycoproteins: role of neutralizing anti-G1 antibodies. J. Virol. 69:3475–3481 [DOI] [PMC free article] [PubMed] [Google Scholar]
- 19. Plyusnin A, Kukkonen SK, Plyusnina A, Vapalahti O, Vaheri A. 2002. Transfection-mediated generation of functionally competent Tula hantavirus with recombinant S RNA segment. EMBO J. 21:1497–1503 [DOI] [PMC free article] [PubMed] [Google Scholar]
- 20. Posada D, Crandall KA. 2001. Evaluation of methods for detecting recombination from DNA sequences: computer simulations. Proc. Natl. Acad. Sci. U. S. A. 98:13757–13762 [DOI] [PMC free article] [PubMed] [Google Scholar]
- 21. Sibold C, et al. 1999. Recombination in Tula hantavirus evolution: analysis of genetic lineages from Slovakia. J. Virol. 73:667–675 [DOI] [PMC free article] [PubMed] [Google Scholar]
- 22. Smith JM. 1992. Analyzing the mosaic structure of genes. J. Mol. Evol. 34:126–129 [DOI] [PubMed] [Google Scholar]
- 23. Tamura K, et al. 2011. MEGA5: molecular evolutionary genetics analysis using maximum likelihood, evolutionary distance, and maximum parsimony methods. Mol. Biol. Evol. 28:2731–2739 [DOI] [PMC free article] [PubMed] [Google Scholar]
- 24. Thompson JD, Gibson TJ, Plewniak F, Jeanmougin F, Higgins DG. 1997. The CLUSTAL_X windows interface: flexible strategies for multiple sequence alignment aided by quality analysis tools. Nucleic Acids Res. 25:4876–4882 [DOI] [PMC free article] [PubMed] [Google Scholar]
- 25. Wang M, Pennock DG, Spik KW, Schmaljohn CS. 1993. Epitope mapping studies with neutralizing and non-neutralizing monoclonal antibodies to the G1 and G2 envelope glycoproteins of Hantaan virus. Virology 197:757–766 [DOI] [PubMed] [Google Scholar]
- 26. Wittmann TJ, et al. 2007. Isolates of Zaire Ebola virus from wild apes reveal genetic lineage and recombinants. Proc. Natl. Acad. Sci. U. S. A. 104:17123–17127 [DOI] [PMC free article] [PubMed] [Google Scholar]
- 27. Wu ZY, et al. 2009. A study of homologous recombination in foot-and-mouth disease virus in China. Prog. Biochem. Biophys. 36:1–8 [Google Scholar]
- 28. Xu B, et al. 2011. Metagenomic analysis of fever, thrombocytopenia and leukopenia syndrome (FTLS) in Henan Province, China: discovery of a new bunyavirus. PLoS Pathog. 7:e1002369 doi:10.1371/journal.ppat.1002369 [DOI] [PMC free article] [PubMed] [Google Scholar]
- 29. Yu XJ, et al. 2011. Fever with thrombocytopenia associated with a novel bunyavirus in China. N. Engl. J. Med. 364:1523–1532 [DOI] [PMC free article] [PubMed] [Google Scholar]
- 30. Zhang YZ, et al. 2012. Hemorrhagic fever caused by a novel bunyavirus in China: pathogenesis and correlates of fatal outcome. Clin. Infect. Dis. 54:527–533 [DOI] [PubMed] [Google Scholar]
- 31. Zhang YZ, et al. 2012. The ecology, genetic diversity, and phylogeny of Huaiyangshan virus in China. J. Virol. 86:2864–2868 [DOI] [PMC free article] [PubMed] [Google Scholar]


