

Abstract
The potential effect of blocking the CCR5 receptor on HIV disease progression biomarkers is not well understood. We showed that an 8-day maraviroc (MVC) monotherapy clinical test (MCT) can be used in selecting patients to receive MVC-containing combined antiretroviral therapy (cART). Using this MCT model, we assessed the effect of MVC on several HIV disease progression biomarkers during the MCT (MVC-specific effect) and following short-term (12-week) cART. We compared 45 patients on MVC monotherapy with a control group of 25 patients on MVC-sparing cART. We found that MVC did not modify any biomarkers in patients that had no virological response after the MCT. MVC-specific effects in patients with virological responses included increased CD8+ T-cell activation and senescence levels, preservation of an increase in soluble CD14 (sCD14), and a decrease in D dimer levels. After 12 weeks, MVC-containing cART increased CD8+ T-cell counts and preserved CD4+ T-cell senescence levels compared with MVC-sparing cART. Moreover, there was a decrease in sCD14 levels in patients that received MVC-containing cART. In conclusion, effects compatible with CD8+ T-cell redistribution in peripheral blood were observed after MVC therapy. However, MVC was associated with a favorable profile in HIV disease progression biomarkers only in patients with a virological response. These results support a potential clinical benefit of a therapy which includes MVC in HIV-infected patients.
INTRODUCTION
The introduction of highly active antiretroviral therapy has dramatically decreased AIDS-related mortality and morbidity (19). However, non-AIDS-defining illnesses have increased despite the use of combined antiretroviral therapy (cART) (18). Several biomarkers, such as T-cell activation (12, 15, 17), T-cell senescence (6), soluble CD14 (sCD14), D dimer, and high-sensitivity C-reactive protein (hsCRP) (4, 16, 24), have been associated with death and clinical progression in HIV infection. These biomarkers remain elevated in HIV patients despite suppressive cART. Thus, it is important to explore whether new drugs can have an impact on HIV progression-related biomarkers. Maraviroc (MVC) (7), the first CCR5 (R5) antagonist approved for the treatment of HIV-1 infection, has been proposed as a drug with an immunomodulatory effect independent of its antiviral activity (1, 23, 25). Moreover, it has been recently suggested that MVC-containing cART can facilitate a greater reduction in immune activation and inflammation markers than conventional cART (10). However, in these studies, other antiretroviral drugs combined with MVC may have masked the net MVC immunomodulatory effect.
Our group has developed the MVC clinical test (MCT) (11), in which the virological response to monotherapy with MVC treatment for 8 days is used to select patients for R5 antagonist use in subsequent cART. Thus, the MCT constitutes a unique scenario for testing the short-term effect of the R5 blockade. In this sense, we found a higher CD8+ T-cell gain in patients undergoing MCT treatment than with the 8-day effect of conventional cART (20). However, the potential MVC-specific effects on HIV disease progression biomarkers were not evaluated.
Our aim was to assess the effect of MVC on several immunological and HIV disease progression-related biomarkers after MVC monotherapy (MVC-specific effect) and following short-term (12-week) cART.
MATERIALS AND METHODS
Patients.
Since July 2008, the MCT has been routinely used at the Infectious Diseases Service at Virgen del Rocío University Hospital for selecting candidate patients to receive MVC-containing cART (11). Briefly, the MCT consists of 8 days of MVC monotherapy exposure. The subsequent virological response is analyzed to determine whether MVC should be included in the subsequent round of cART. The MCT is considered positive if a significant viral load reduction, defined as a reduction of ≥1 log10 HIV RNA copy/ml, or an undetectable viral load (<40 HIV RNA copies/ml) was achieved on day 8 after MVC monotherapy. All of the patients were asymptomatic when the study was performed, and the inclusion criteria for the MCT have been previously defined (11). Inclusion criteria include (i) a persistently detectable viral load (>40 HIV RNA copies/ml) during the last 6 months, (ii) no highly active antiretroviral therapy (HAART) modification in the last 6 months, (iii) no HAART reintroduction in the last 6 months in patients undergoing previous supervised treatment interruption (STI), (iv) no previous treatment with coreceptor antagonists, and (v) available future therapeutic options apart from MVC. For the purpose of the present study, a subgroup of patients with available samples was included. Three groups were defined as follows. (i) The MCT-positive group (MCT+) contains patients with a positive response after the MCT (n = 30). (ii) The MCT-negative group (MCT−) includes patients without a virological response after the MCT (n = 15). MVC-containing and MVC-sparing cART, respectively, was started after the MCT in these patients. (iii) The control group contains 25 consecutive asymptomatic treatment-naive patients starting conventional MVC-sparing cART (n = 25). The inclusion period for these patients was the same as those for the MCT groups.
All patients were evaluated at baseline and on day 8. Furthermore, in addition to the evaluation time points in our previous study design (20), patients on follow-up were analyzed at baseline and after 12 weeks on cART. The study design is shown in Fig. 1. Patients, or legal guardians of patients under 18 years of age, provided written informed consent, and the ethical committee of the hospital approved the study.
Fig 1.
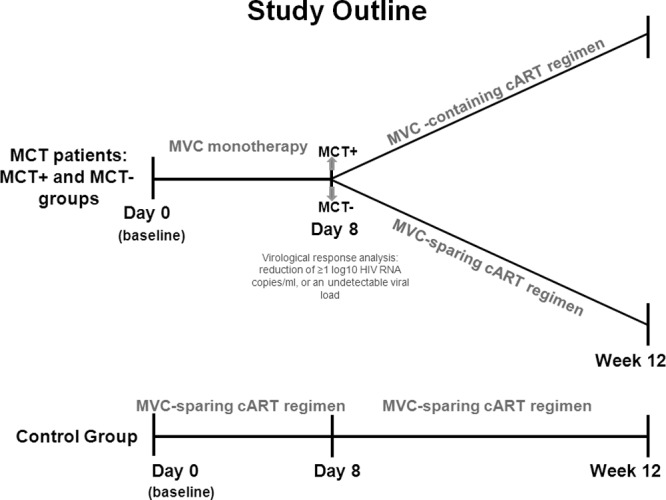
Study design. The MVC-specific effect was assessed in patients with the MCT. Afterward (8 days), the patients were divided into two groups, MCT− and MCT+, according to the virological response experienced after the MCT. According to this response, the patients were followed for 12 weeks on MVC-containing (MCT+ patients) or MVC-sparing (MCT− patients) cART. The same study variables were analyzed at day 8 and week 12 in a control group of patients on MVC-sparing cART.
Laboratory tests.
Plasma HIV-1 RNA was measured in fresh samples by quantitative PCR (Cobas AmpliPrep/Cobas TaqMan HIV-1 test; Roche Molecular Systems, Basel, Switzerland) according to the manufacturer's instructions. The lower detection limit was 40 HIV-1 RNA copies/ml. A qualitative PCR amplification was performed for plasma hepatitis C virus (HCV) RNA amplification (Cobas Amplicor; Roche Diagnostics, Barcelona, Spain), and the lower detection limit was 15 IU/ml. CD4+ T-cell counts were determined in fresh whole blood using the Epics XL-MCL flow cytometer (Beckman-Coulter Inc., California) according to the manufacturer's instructions.
HIV disease progression-associated biomarkers.
Predictor biomarkers of all causes of mortality in HIV-infected patients (3, 4, 16, 24) were assayed on available frozen samples by following the manufacturer's instructions with minor modifications. sCD14 levels, a monocyte activation biomarker, were assayed with the commercially available enzyme-linked immunosorbent assay (ELISA) kit on sera diluted 0.01% in duplicate wells (R&D Systems). D dimer levels, a thrombotic activity biomarker, were measured in an automated latex-enhanced immunoassay for the quantitative determination of D dimer in plasma samples (HemosIL D-Dimer HS 500; Instrumentation Laboratory). Levels of hsCRP, an inflammation marker, were determined with an immunoturbidimetric assay on sera using Roche automated clinical chemistry analyzers by following the manufacturer's instructions. The sensitivity and linearity ranges were assayed in every biomarker, and they fit with the range indicated in the respective assay kit as described by the manufacturer's instructions. There was an interassay linearity of the samples of >90% in all the assays. All the sample measures were above the detection limit of every assay.
T-cell immunophenotyping.
CD4+ and CD8+ peripheral T-cell subsets were positively selected from available frozen peripheral blood mononuclear cells (PBMCs) using magnetic microbeads from magnetically activated cell sorting (MACS) cell separation reagents (Miltenyi Biotec, Germany) according to the manufacturer's instructions. The purity obtained from the separation of both T-cell subsets was routinely >90%. CD4+ and CD8+ T cells were then stained with the conjugated monoclonal antibodies CD28-PE, CD57-FITC, HLA-DR-ECD, CD45RA-ECD, CD27-PC5, and CD38-PE (Beckman Coulter, Hialeah, FL), CD45RA-FITC, and CD45RO-PC7 (BD Biosciences, CA) and analyzed by 5-color flow cytometry performed with a Beckman Coulter Cytomics FC500 MPL flow cytometer. T-cell subsets were defined as follows: naive T cells (CD45RA+ CD27+), memory T cells (CD45RO+ CD27+), effector memory T cells (CD45RO+ CD27−), and effector memory RA+ T cells (TemRA) (CD45RA+ CD27−). The accuracy of these phenotypes was recently reported (8). To identify activated T cells, HLA-DR+ CD38+ staining was used for CD4+ and CD8+ T cells, and CD38+ staining was used for CD8+ T cells. Senescent T cells were characterized as CD57+ CD28−.
Statistical analyses.
Continuous variables are expressed as medians with the interquartile ranges (IQR), and categorical variables are expressed as numbers and percentages. Differences between the groups were analyzed using a chi-square test to compare categorical variables, while the Mann-Whitney U test (nonpaired variables) and Wilcoxon test (paired variables) were used for continuous variables. All P values of <0.05 were considered significant. Statistical analyses were performed using the Statistical Package for the Social Sciences software (SPSS 17.0; Chicago, IL), and the graphics were generated with Prism, version 5.0 (GraphPad Software, Inc.).
RESULTS
Baseline characteristics of the patients.
The baseline characteristics of the 70 patients included in this study are shown in Table 1. Compared with the control group, MCT+ patients exhibited higher CD4+ T-cell counts, a lower HIV load, older age, a greater length of time since HIV diagnosis, and a higher frequency of HCV coinfection. Moreover, MCT− patients had the lowest nadir and CD4+ T-cell counts, as previously described (22), and a higher proportion of these patients were in CDC stage C.
Table 1.
Baseline characteristics of the patients
| Characteristic | Median value (IQR) in each groupa |
P value forb: |
|||
|---|---|---|---|---|---|
| MCT− (n = 15) | MCT+ (n = 30) | Control group (n = 25) | MCT− vs control | MCT+ vs control | |
| Age (yr) | 40 (37–45) | 44 (40–48) | 37 (28–47) | NS | 0.024 |
| No. (%) male | 13 (86.7) | 22 (73.3) | 19 (76.0) | NS | NS |
| Time from HIV diagnosis (wk) | 858 (769–1,014) | 950 (596–1,061) | 30 (9–57) | <0.001 | <0.001 |
| No. (%) in CDC clinical stage C | 7 (46.7) | 6 (20.0) | 3 (12.0) | 0.024 | NS |
| CD4+ T cells (cells/mm3) | 77 (17–164) | 287 (221–456) | 224 (122–320) | 0.005 | 0.045 |
| Nadir CD4+ T cells (cells/mm3) | 33 (4–77) | 190 (112–282) | 190 (103–348) | <0.001 | NS |
| CD8+ T cells (cells/mm3) | 437 (372–1,236) | 826 (577–1,037) | 617 (458–938) | NS | NS |
| HIV load (log10 RNA copies/ml) | 4.9 (3.7–5.3) | 4.2 (2.9–4.9) | 4.8 (4.3–5.2) | NS | 0.007 |
| No. (%) HCV PCR+c | 6 (40.0) | 13 (43.3) | 3 (12.0) | NS | 0.018 |
Data are expressed as the median (interquartile range) of all participants unless otherwise specified.
NS, not significant.
PCR+, PCR positive for hepatitis C virus. Chi-square and Mann-Whitney U tests were used for categorical and continuous variables, respectively.
MVC-specific effects after 8-day therapy.
The HIV viral load and T-cell levels were not modified in the MCT− group. The HIV viral load decreased significantly (P < 0.001), and the median T-cell levels increased significantly in the MCT+ group and the control group, as we previously reported (20) (Table 2). T-cell increases were similar between the MCT+ group and the control group (P value of 0.284 for CD4+ and P value of 0.251 for CD8+ T cells).
Table 2.
Absolute T-cell and HIV viral load changes after 8-day therapy and 12 weeks on cART
| Measured change | Therapy | Median (IQR) change and P value in each groupa |
|||||
|---|---|---|---|---|---|---|---|
| MCT− |
MCT+ |
Control |
|||||
| Median (IQR) | P | Median (IQR) | P | Median (IQR) | P | ||
| CD4+ T cells (cells/mm3) | 8-day therapy | 2 (−5 to 22) | 0.798 | 67 (30 to 117) | <0.001 | 87 (40 to 140) | <0.001 |
| 12-wk cART | 53 (16 to 102) | 0.029 | 92 (34 to 162) | <0.001 | 173 (68 to 210) | <0.001 | |
| CD8+ T cells (cells/mm3) | 8-day therapy | 42 (−108 to 294) | 0.426 | 264 (76 to 542) | <0.001 | 142 (18 to 417) | 0.008 |
| 12-wk cART | 135 (53 to 357) | 0.014 | 91 (12 to 386) | 0.004 | 57 (−155 to 221) | 0.421 | |
| HIV load (log10 RNA copies/ml) | 8-day therapy | 0.05 (−0.17 to 0.23) | 0.496 | −1.23 (−1.66 to −1.03) | <0.001 | −1.56 (−1.79 to −1.17) | <0.001 |
| 12-wk cART | −3.30 (−3.58 to −2.32) | 0.003 | −2.44 (−3.01 to −1.47) | <0.001 | −3.24 (−3.44 to −2.57) | 0.001 | |
The Wilcoxon test was used to study T-cell and HIV load levels between day 0 and day 8 and between day 0 and week 12 along the follow-up in the different groups. P values of <0.05 were considered statistically significant and are indicated in bold.
No differences in any of the studied biomarkers were observed in the MCT− group (Fig. 2A to E). CD8+ T-cell activation and senescence levels increased in the MCT+ group, while these levels remained unchanged in the control group. No changes in CD4+ T-cell activation or senescence levels were observed in either group (Fig. 2A to D). Regarding these biomarkers in the T-cell subsets, only TemRA CD4+ T-cell senescence levels decreased in the MCT+ group (P = 0.044) (Fig. 3A). Regarding inflammatory markers, sCD14 levels significantly increased in the control group while they remained stable in the MCT+ group (Fig. 2E; see also Fig. S1A in the supplemental material). Moreover, D dimer levels significantly decreased only in the MCT+ group (Fig. 2F; see also Fig. S1B in the supplemental material). Finally, hsCRP showed a trend toward decreasing only in the MCT+ group (P = 0.073) (data not shown).
Fig 2.

MVC-specific effects after eight-day therapy. The results are expressed as absolute T-cell numbers (cells/mm3) at day 0 (D0) and day 8 (D8) for every study group. (A and B) CD4+ T-cell activation (A) and senescence (B) levels. (C and D) CD8+ T-cell activation (C) and senescence (D) levels. (E and F) sCD14 and D dimer levels (E and F, respectively). Horizontal gray bars represent the median values for each data point. Differences along the follow-up were studied using the Wilcoxon test; significant values are depicted with an asterisk. Data from the MCT-negative group (MCT−) are represented as triangles, data from the MCT-positive group (MCT+) are shown as circles, and data from the control group are shown as squares. The numbers of analyzed patients in the MCT−, MCT+, and control groups were 12, 28, and 24 (A), 12, 29, and 24 (B), 15, 29, and 23 (C), 14, 27, and 20 (D), 11, 27, and 25 (E), and 9, 19, and 23 (F), respectively.
Fig 3.

Absolute TemRA senescent CD4+ T-cell levels after 8-day MVC monotherapy and after 12 weeks on cART. The figures show senescent TemRA CD4+ T-cell numbers (cells/mm3) at day 0 and day 8 for every study group in panel A and senescent TemRA CD4+ T-cell numbers (cells/mm3) at day 0 and week 12 (W12) for every study group in panel B. Horizontal gray bars represent the median values for each data point. Differences during the follow-up were studied using the Wilcoxon test; significant values are depicted with an asterisk. Data from the MCT-negative group (MCT−) are represented as triangles, data from the MCT-positive group (MCT+) are shown as circles, and data from the control group are shown as squares. The numbers of analyzed patients in the MCT−, MCT+, and control groups were 6, 22, and 19 (A) and 5, 19, and 9 (B), respectively.
Effects after 12 weeks on cART.
Patients with follow-up at week 12 on cART were analyzed. Eleven MCT− patients (73.3%), 24 MCT+ patients (80.0%), and 13 patients from the control group were included in the follow-up studies (52.0%). The baseline characteristics of these subgroups were similar to those from the whole study population (see Table S1 in the supplemental material). Background antiretroviral treatments of the different groups are shown in Table S2 in the supplemental material.
All the groups demonstrated significantly decreased HIV viral load levels (Table 2). CD4+ T-cell counts significantly increased in all groups. CD8+ T-cell counts increased in the MCT+ and MCT− groups, while in the control group, these levels remained unchanged (Table 2). The median CD4+ T-cell increases (ranges) were similar between the MCT+ group and the control group (92 [34 to 162] and 173 [68 to 210], respectively; P = 0.139).
CD4+ T-cell activation levels tended to increase, and CD4+ T-cell senescence levels significantly increased only in the groups on MVC-sparing cART (Fig. 4A and B). Moreover, only senescent TemRA CD4+ T-cell levels showed a decreasing trend in the MCT+ group, similar to the results of the 8-day treatment (P = 0.061) (Fig. 3B). CD8+ T-cell activation levels tended to decrease in the MCT+ group and significantly decreased in the control group (Fig. 4C). When we considered the activation phenotype to be CD38+ HLA-DR+, we found similar results with even more significant decreases (P value of 0.008 for MCT+ patients and P value of 0.048 for control group patients). Additionally, increased CD8+ T-cell senescence levels were found only in the control group, and these differences remained significant when the outlier value at week 12 was eliminated from the control group (Fig. 4D). Interestingly, sCD14 levels decreased in the MCT+ patients, and there was a decreasing trend in the MCT− group. However, there were no changes in the control group (Fig. 4E; see also Fig. S2A in the supplemental material). The MCT+ and control groups showed a significant decrease in D dimer levels (Fig. 4F; see also Fig. S2B in the supplemental material). The short-term cART effects on hsCRP levels were similar in all groups, showing no significant changes (data not shown).
Fig 4.

Effect of MVC-containing or MVC-sparing cART after 12 weeks. The results are expressed as absolute T-cell numbers (cells/mm3) at day 0 and week 12 for every study group. (A and B) CD4+ T-cell activation (A) and senescence (B) levels. (C and D) CD8+ T-cell activation (C) and senescence (D) levels. (E and F) sCD14 and D dimer levels (E and F, respectively). Horizontal gray bars represent the median values for each data point. Differences along the follow-up were studied using the Wilcoxon test; significant values are depicted with an asterisk. Data from the MCT-negative group (MCT−) are represented as triangles, data from the MCT-positive group (MCT+) are shown as circles, and data from the control group are shown as squares. The numbers of analyzed patients in the MCT−, MCT+, and control groups were 8, 22, and 13 (A), 10, 23, and 13 (B), 10, 22, and 13 (C), 9, 22, and 9 (D), 9, 22, and 13 (E), and 8, 15, and 13 (F), respectively.
DISCUSSION
Eight days of MVC monotherapy allowed us to determine the specific effects of blocking R5 on several HIV disease progression-related biomarkers. First, MVC did not modify any biomarkers in MCT− patients. In contrast, an increase in both CD8+ T-cell activation and senescence levels and a favorable profile of D dimer and sCD14 levels were observed in MCT+ patients. In addition, 12 weeks of MVC-containing cART significantly increased the absolute CD8+ T-cell counts and maintained lower CD4+ T-cell senescence levels compared with the values for the cART group. Similarly, MVC-containing cART decreased sCD14 levels compared with those of an MVC-sparing cART.
We have previously shown that MVC-specific effects on T-cell changes are dependent on the drug's antiretroviral activity (20). We analyzed this issue in depth with respect to HIV disease progression biomarkers. In accordance with our previous results, the first important finding of this study is that MVC had no effect on any of the measured parameters in the patients who had no virological response. This finding supports the fact that an antiretroviral effect is necessary to observe the specific immune effects of MVC in relation to these markers. Thus, MVC will not have any immunomodulatory effect on patients who are insensitive to the drug, at least on the parameters studied herein, a finding which is in contrast to what has been previously suggested (23).
Surprisingly, the MVC-specific effect after 8 days was an increase in CD8+ T-cell activation and senescence levels. The fact that these effects ceased at the onset of the cART after the MCT, even with MVC-containing cART, may suggest that blocking CCR5 causes early lymphocyte redistribution from the lymph nodes to blood (5, 21) rather than a proactivation effect of MVC. In fact, T-cell redistribution from lymph to blood has been shown to occur early after HAART, although this effect has not been studied at such a short term as in this study (5). In addition, MVC showed a favorable specific effect on soluble markers associated with HIV disease progression, demonstrated by significant decreases in D dimer together with sCD14 stabilization and a trend toward decreasing hsCRP levels compared with the control group, although levels at day 8 were similar for the two therapies.
The results presented here shed light on the potential clinical beneficial effects of MVC-containing cART. In fact, when we analyzed the short-term cART effect, we observed how MVC differentially diminished sCD14 levels. This decrease in a marker of innate immune activation may have important clinical implications because high sCD14 levels have been independently associated with mortality in HIV-infected patients (24). The decrease of D dimer levels which have been associated with lower cardiovascular risk in HIV-infected patients (4) could also be clinically relevant. However, these results contradict the increase in sCD14 levels observed after MVC intensification in a recent study (14). In fact, the higher levels found in that study were statistically significant after 24 to 48 weeks, but not at 12 weeks, on cART, and the previous study included a very different set of patients (under an MVC intensification strategy, on suppressive cART, and with much higher CD4+ T-cell levels than patients in the present work). Better profiles of MVC were also found in cellular markers in that study, in which MVC was associated with stability in CD4+ T-cell activation and T-cell senescence markers. In contrast to conventional cART, we found that MVC-containing cART did not change the absolute T-cell numbers with the absence of CD28 expression in CD4+ T cells. CD28 is a costimulatory T-cell molecule whose absence on the T-cell surface has been linked to replicative senescence and HIV-1 progression (6). These differences may be due to the backbone therapy accompanying MVC in the new cART compared with the control group. However, when patient treatment variables were adjusted, the same effects on T-cell senescence were observed (data not shown). The trend observed in CD4+ T-cell activation levels is in agreement with the previous data of the MERIT substudy (10), in which cART with MVC versus the same therapy including efavirenz showed a trend toward higher deactivation of CD4+ T-cell levels after 24 weeks. However, we did not observe changes in activated CD4+ T-cell levels in the MCT+ group, a result which is contrary to the surprising trend toward increasing CD4+ T-cell activation in the conventional cART group. In cART, decreases in CD4+ T-cell activation levels have been observed at a longer follow-up time (2, 9, 13) and may be the reason for such discrepancies. In contrast, MVC was associated with a decrease in the senescence levels of TemRA CD4+, terminally differentiated CD4+ T cells, which are mostly replicatively senescent. The long-term causes and effects of this decrease are unknown at present.
This work has some limitations, including the fact that groups that underwent MCT were pretreated and were older, had a greater length of time since HIV diagnosis, and had a higher proportion of HCV coinfection than the control group, which was composed of naive patients. This different composition of the groups was mandatory when this study was designed and performed because MVC prescription in Europe was indicated only in pretreated patients at that time. These differences may negatively impact the parameters measured in the MCT+ group. However, we observed similar CD4+ T-cell changes after therapy and, in general, a more favorable immunological profile in these patients than in the control group. Therefore, we would expect even greater differences favoring the MCT+ group if the variables mentioned above were controlled for among the patients. We do not know if a longer time on MVC monotherapy would have favored additional MVC-specific effects. This final limitation may also be considered a strength of the study, reflecting the unique design of the MCT, which led us to analyze the MVC-specific effect.
In conclusion, MVC-specific effects induced a favorable profile in D dimer and sCD14 levels, a result which is opposite of the effects observed in T-cell activation. The reversible nature of the latter effect after cART suggests that this phenomenon is compatible with a redistribution of T cells from the lymph nodes in the short term. MVC-containing cART seems to induce a more favorable profile in HIV disease progression-related markers, such as sCD14, CD4+ T-cell activation, and T-cell senescence. These observations are particularly important in the current cART era, in which new immunotherapeutic approaches to decrease HIV disease progression markers, beyond the antiretroviral effect, are needed.
Supplementary Material
ACKNOWLEDGMENTS
This work was supported by Pfizer/ViiV Healthcare (grant number WS843473) and by Redes Temáticas de Investigación en SIDA (ISCIII RETIC RD06/0006/0021), Fondo de Investigación Sanitaria (grant PS09/01595), and the Fondos Europeos para el Desarrollo Regional (FEDER). S.F.M. and E.R.M. have grants from the Fondo de Investigaciones Sanitarias (CD10/00382 and CP08/00172, respectively). Manuel Leal has a grant from Pfizer.
We are grateful to the patients that participated in this study and to Marien Gutierrez Sancho, Francisca Cano, Ana Maria Guijarro, Inmaculada Rivas, and Magdalena Rodriguez from the Day Care Hospital (Infectious Diseases Department) and Amparo Lluch (Pharmacy Department) for their support to the patients.
Footnotes
Published ahead of print 4 September 2012
Supplemental material for this article may be found at http://aac.asm.org/.
REFERENCES
- 1. Asmuth DM, et al. 2010. CD4+ T-cell restoration after 48 weeks in the maraviroc treatment-experienced trials MOTIVATE 1 and 2. J. Acquir. Immune Defic. Syndr. 54:394–397 [DOI] [PubMed] [Google Scholar]
- 2. Badley AD, et al. 1999. Dynamic correlation of apoptosis and immune activation during treatment of HIV infection. Cell Death Differ. 6:420–432 [DOI] [PubMed] [Google Scholar]
- 3. Baker JV, et al. 2011. Changes in inflammatory and coagulation biomarkers: a randomized comparison of immediate versus deferred antiretroviral therapy in patients with HIV infection. J. Acquir. Immune Defic. Syndr. 56:36–43 [DOI] [PMC free article] [PubMed] [Google Scholar]
- 4. Boulware DR, et al. 2011. Higher levels of CRP, D-dimer, IL-6, and hyaluronic acid before initiation of antiretroviral therapy (ART) are associated with increased risk of AIDS or death. J. Infect. Dis. 203:1637–1646 [DOI] [PMC free article] [PubMed] [Google Scholar]
- 5. Bucy RP, et al. 1999. Initial increase in blood CD4(+) lymphocytes after HIV antiretroviral therapy reflects redistribution from lymphoid tissues. J. Clin. Invest. 103:1391–1398 [DOI] [PMC free article] [PubMed] [Google Scholar]
- 6. Cao W, et al. 2009. Premature aging of T cells is associated with faster HIV-1 disease progression. J. Acquir. Immune Defic. Syndr. 50:137–147 [DOI] [PMC free article] [PubMed] [Google Scholar]
- 7. Dorr P, et al. 2005. Maraviroc (UK-427,857), a potent, orally bioavailable, and selective small-molecule inhibitor of chemokine receptor CCR5 with broad-spectrum anti-human immunodeficiency virus type 1 activity. Antimicrob. Agents Chemother. 49:4721–4732 [DOI] [PMC free article] [PubMed] [Google Scholar]
- 8. Ferrando-Martinez S, Ruiz-Mateos E, Leal M. 2010. CD27 and CCR7 expression on naive T cells, are both necessary? Immunol. Lett. 127:157–158 [DOI] [PubMed] [Google Scholar]
- 9. Franco JM, et al. 1999. Reduction of immune system activation in HIV-1-infected patients undergoing highly active antiretroviral therapy. Eur. J. Clin. Microbiol. Infect. Dis. 18:733–736 [DOI] [PubMed] [Google Scholar]
- 10. Funderburg N, et al. 2010. Effects of maraviroc and efavirenz on markers of immune activation and inflammation and associations with CD4+ cell rises in HIV-infected patients. PLoS One 5:e13188 doi:10.1371/journal.pone.0013188 [DOI] [PMC free article] [PubMed] [Google Scholar]
- 11. Genebat M, et al. 2009. Correlation between the Trofile test and virological response to a short-term maraviroc exposure in HIV-infected patients. J. Antimicrob. Chemother. 64:845–849 [DOI] [PubMed] [Google Scholar]
- 12. Giorgi JV, et al. 1999. Shorter survival in advanced human immunodeficiency virus type 1 infection is more closely associated with T lymphocyte activation than with plasma virus burden or virus chemokine coreceptor usage. J. Infect. Dis. 179:859–870 [DOI] [PubMed] [Google Scholar]
- 13. Giorgi JV, et al. 1993. Elevated levels of CD38+ CD8+ T cells in HIV infection add to the prognostic value of low CD4+ T cell levels: results of 6 years of follow-up. J. Acquir. Immune Defic. Syndr. 6:904–912 [PubMed] [Google Scholar]
- 14. Gutierrez C, et al. 2011. Intensification of antiretroviral therapy with a CCR5 antagonist in patients with chronic HIV-1 infection: effect on T cells latently infected. PLoS One 6:e27864 doi:10.1371/journal.pone.0027864 [DOI] [PMC free article] [PubMed] [Google Scholar]
- 15. Hazenberg MD, et al. 2000. T-cell division in human immunodeficiency virus (HIV)-1 infection is mainly due to immune activation: a longitudinal analysis in patients before and during highly active antiretroviral therapy (HAART). Blood 95:249–255 [PubMed] [Google Scholar]
- 16. Kuller LH, et al. 2008. Inflammatory and coagulation biomarkers and mortality in patients with HIV infection. PLoS Med. 5:e203 doi:10.1371/journal.pmed.0050203 [DOI] [PMC free article] [PubMed] [Google Scholar]
- 17. Liu Z, et al. 1997. Elevated CD38 antigen expression on CD8+ T cells is a stronger marker for the risk of chronic HIV disease progression to AIDS and death in the Multicenter AIDS Cohort Study than CD4+ cell count, soluble immune activation markers, or combinations of HLA-DR and CD38 expression. J. Acquir. Immune Defic. Syndr. Hum. Retrovirol. 16:83–92 [DOI] [PubMed] [Google Scholar]
- 18. Palella FJ, Jr, et al. 2011. Increased mortality among publicly insured participants in the HIV Outpatient Study despite HAART treatment. AIDS 25:1865–1876 [DOI] [PubMed] [Google Scholar]
- 19. Palella FJ, Jr, et al. 1998. Declining morbidity and mortality among patients with advanced human immunodeficiency virus infection. N. Engl. J. Med. 338:853–860 [DOI] [PubMed] [Google Scholar]
- 20. Pulido I, et al. 2012. T-cell changes after a short-term exposure to maraviroc in HIV-infected patients are related to antiviral activity. J. Infect. 64:417–423 [DOI] [PubMed] [Google Scholar]
- 21. Rossi R, et al. 2010. Downregulation of leukocyte migration after treatment with CCR5 antagonist maraviroc. J. Acquir. Immune Defic. Syndr. 54:e13–e14 [DOI] [PubMed] [Google Scholar]
- 22. Ruiz-Mateos E, et al. 2011. Virological response after short-term CCR5 antagonist exposure in HIV-infected patients: frequency of subjects with virological response and associated factors. Antimicrob. Agents Chemother. 55:4664–4669 [DOI] [PMC free article] [PubMed] [Google Scholar]
- 23. Saag M, et al. 2009. A double-blind, placebo-controlled trial of maraviroc in treatment-experienced patients infected with non-R5 HIV-1. J. Infect. Dis. 199:1638–1647 [DOI] [PubMed] [Google Scholar]
- 24. Sandler NG, et al. 2011. Plasma levels of soluble CD14 independently predict mortality in HIV infection. J. Infect. Dis. 203:780–790 [DOI] [PMC free article] [PubMed] [Google Scholar]
- 25. Wilkin TJ, Ribaudo HR, Tenorio AR, Gulick RM. 2010. The relationship of CCR5 antagonists to CD4+ T-cell gain: a meta-regression of recent clinical trials in treatment-experienced HIV-infected patients. HIV Clin. Trials 11:351–358 [DOI] [PMC free article] [PubMed] [Google Scholar]
Associated Data
This section collects any data citations, data availability statements, or supplementary materials included in this article.