

Abstract
Piperacillin in combination with tazobactam is one of the most commonly used intravenous antibiotics. There is evidence for a possible saturable elimination of piperacillin. Therefore, the saturable elimination and its impact on the choice of optimal dosage regimens were quantified. In a randomized crossover study, 10 healthy volunteers received 1,500 mg and 3,000 mg of piperacillin as 5-min intravenous infusion. Population pharmacokinetics based on plasma and urine data were determined utilizing NONMEM and S-ADAPT. Probabilities of target attainment (PTAs) were compared for different models and dosage regimens, based on the target time of the non-protein-bound concentration above the MIC of at least 50% of the dosing interval. Total clearance of piperacillin was 18% (geometric mean ratio, 90% confidence interval, 11 to 24%) lower (P < 0.01), and renal clearance was 24% (9 to 37%) lower (P = 0.02) at the high compared to the low dose. The final model included first-order nonrenal elimination and parallel first-order and mixed-order renal elimination. Nonrenal clearance was 5.44 liter/h (coefficient of variation, 18%), first-order renal clearance was 4.42 liter/h (47%), and the maximum elimination rate of mixed-order renal elimination was 219 mg/h (84%), with a Michaelis-Menten constant of 36.1 mg/liter (112%). Compared to models with saturable elimination, a linear model predicted up to 10% lower population PTAs for high-dose short-term infusions (6 g every 8 h) and up to 4% higher population PTAs for low-dose continuous infusions (6 g/day). While renal elimination of piperacillin was saturable at therapeutic concentrations, the extent of saturation of nonrenal clearance was small. The influence of saturable elimination on PTAs for clinically relevant dosage regimens was relatively small.
INTRODUCTION
Piperacillin in combination with the beta-lactamase inhibitor tazobactam is one of the most frequently used intravenous antibiotic choices. It is bactericidal against Gram-positive microorganisms and Pseudomonas aeruginosa (37) and is frequently used in the empirical treatment of hospital-acquired infections. It has sufficient stability at room temperature (39), which makes it attractive for prolonged or continuous infusion. During the use of piperacillin for more than 2 decades, there have been discussions about whether a clinically significant saturable elimination pathway exists (5, 6, 9, 10, 20, 30, 41). There is evidence (12, 27, 36, 40) that the renal tubular secretion of piperacillin is saturable at therapeutic concentrations. Saturable elimination of antibiotics may be clinically important and affect the choice of optimal dosage regimen, and it may be more pronounced for specific dose levels and dosage regimens. However, the impact of potentially saturable piperacillin elimination on probabilities of target attainment (PTAs) has not been studied previously.
Our first objective was to assess the potentially saturable renal and nonrenal elimination of piperacillin in a well-controlled healthy volunteer crossover study at two dose levels. To our knowledge, this presents the first crossover study of piperacillin in plasma and urine with analysis using a population PK methodology. The second objective was to estimate the influence of saturable elimination on the pharmacokinetic/pharmacodynamic (PK/PD) characteristics of piperacillin via Monte Carlo simulation (MCS). The PTAs were compared between different pharmacokinetic models with saturable and nonsaturable (i.e., linear) elimination for various dosage regimens. This allowed us to determine the potential clinical relevance or lack thereof of the saturation of piperacillin elimination for therapeutically relevant dosage regimens.
MATERIALS AND METHODS
Study participants.
The study included 10 healthy Caucasian volunteers (five male, five female). All subjects were required to undergo a physical examination, electrocardiography, and laboratory tests, such as urinalysis and screening for drugs of abuse, prior to entering into the study. The volunteers were closely observed by physicians during the study periods. Subjects were asked to report any discomfort or adverse reactions and to complete a questionnaire on their health status on each study day. The study was approved by the investigational review board of the Medical Faculty and University Hospital of the University of Essen, Germany, and was performed following the revised version of the Declaration of Helsinki. All subjects gave their written informed consent before the start of the study.
Study design and drug administration.
The study was a randomized, controlled, two-way crossover trial. Each subject received a single dose of 1,500 mg or 3,000 mg of piperacillin as a 5-min intravenous infusion during each of the two study periods. Food and fluid intake were strictly standardized on each study day. Treatment periods were separated by a washout period of at least 4 days. During the study periods the volunteers were required to avoid the intake of alcohol and caffeine-containing foods and beverages.
Sampling schedule.
The blood samples were drawn through an intravenous catheter from a forearm vein on the arm that was not used for drug administration. Samples were taken immediately before the start of the infusion, at the end of the infusion, and at 5, 10, 15, 20, 25, 45, 60, 75, and 90 min and 2, 2.5, 3, 3.5, 4, 5, 6, 8, and 24 h after the end of the infusion. The samples were cooled in an ice water bath and then centrifuged. The resulting plasma samples were immediately frozen and stored at −70°C until determination of piperacillin concentrations. Urine samples were collected immediately before the start of the infusion. Complete urine collection was performed from the start of the infusion until 1 h after the end of the infusion, and over the intervals of 1 to 2, 2 to 3, 3 to 4, 4 to 5, 5 to 6, 6 to 8, 8 to 12, and 12 to 24 h after the end of the infusion. The urine samples were stored at 4°C during the collection period. The amount and pH of the urine were measured. Urine samples were immediately frozen and were stored at −70°C before analysis.
Determination of plasma and urine drug concentrations.
For sample preparation, 100 μl of each plasma sample was deproteinized with 200 μl acetonitrile that contained the internal standard. The solution was then mixed and centrifuged at 21,885 × g, and 40 μl of the supernatant was injected onto a high-performance liquid chromatography (HPLC) system. For urine samples, 20 μl of each sample was diluted with 180 μl of water. After mixing of the solution, 40 μl was injected into an HPLC system. A reversed-phase column and a potassium dihydrogen phosphate (pH 6.2)/acetonitrile mobile phase at a flow rate of 2 ml/min were used. Piperacillin and the internal standard were detected at 220 nm. Samples were measured against plasma or urine calibration curves.
For the control of interassay variation, spiked quality controls in plasma and urine were prepared by adding defined volumes of the stock solution or the spiked control of a higher concentration to defined volumes of tested drug-free plasma or urine. No interference was observed in plasma or urine for piperacillin or the internal standard (mezlocillin). Calibration was performed by using linear regression. The linearity of the piperacillin calibration curves was demonstrated from 0.200 to 150 μg/ml in plasma and from 1.00 to 1,000 μg/ml in urine. The quantification limits were identical to the lowest calibration levels. The interday precision and the analytical recovery of the spiked quality control standards of piperacillin in human plasma (urine) ranged from 3.5 to 9.2% (3.0 to 5.5%) and from 95.0 to 106.9% (92.0 to 97.9%).
Pharmacokinetics. (i) Noncompartmental analysis.
The maximum plasma concentration was read directly from the concentration-time curves. The area under the plasma concentration-time curve (AUC) was calculated by using the linear up/log down method (linear interpolation when concentrations are increasing or constant and logarithmic interpolation when concentrations are decreasing).
(ii) Population PK analysis.
One-, two-, and three-compartment disposition models were considered. Competing models were distinguished by their predictive performance, assessed via visual predictive checks, their objective function value, the plausibility of parameter estimates, and standard diagnostic plots (25, 26).
(iii) Clearance.
A nonrenal (CLNR) and a renal (CLR) component of clearance were assumed. The renal clearance was estimated based on the amount of piperacillin excreted unchanged into urine. According to prior population PK models and data on piperacillin (10, 12, 27, 31, 36, 40), four different elimination models were studied: model 1, linear CLR and linear CLNR; model 2, saturable CLR and linear CLNR; model 3, parallel linear plus saturable CLR and linear CLNR; model 4, parallel linear plus saturable CLR and saturable CLNR. The equations for total clearance (CLT) corresponding to each model are as follows:
| (1) |
| (2) |
| (3) |
| (4) |
where C is the piperacillin concentration in the central compartment, VmaxR is the maximum rate of elimination for saturable renal elimination, KmR is the Michaelis-Menten constant for saturable renal elimination, VmaxNR is the maximum rate of elimination for saturable nonrenal elimination, and KmNR is the Michaelis-Menten constant for saturable nonrenal elimination.
(iv) Between-subject variability (BSV) model.
An exponential parameter variability model was used, and various types of variance-covariance matrices were assessed.
Observation model and computation.
The residual unidentified variability was described by a combined additive and proportional error model for plasma drug concentrations and amounts of drug excreted in urine. The first-order conditional estimation (FOCE) method with the interaction estimation option in NONMEM VI level 1.2 (8) and the importance sampling Monte-Carlo parametric expectation-maximization method (MC-PEM; pmethod = 4) in S-ADAPT (version 1.57) (7) were used for population PK modeling. SADAPT-TRAN (11, 14) with its default estimation settings for S-ADAPT was utilized as a pre- and postprocessing tool for S-ADAPT (13, 15). WinNonlin Pro (version 5.2.1; Pharsight Corp., Mountain View, CA) was utilized for noncompartmental analysis and equivalence statistics.
Monte Carlo simulation.
A non-protein-bound plasma drug concentration above the MIC (fT>MIC) for at least 50% of the dosing interval was used as the PK/PD target for piperacillin. This is the commonly used target for near-maximal bactericidal activity of penicillins at 24 h in murine infection models (2, 3, 16, 17). The PTA within the MIC range from 0.008 to 512 mg/liter was calculated assuming protein binding of 30% for piperacillin (4, 33).
Six dosage regimens were simulated: (i) continuous infusion of 6 g piperacillin/day; (ii) prolonged (4-h) infusion of 3 g every 8 h (q8h; daily dose, 9 g); (iii) continuous infusion of 18 g/day; (iv) short-term (30-min) infusion of 4 g q8h (daily dose, 12 g); (v) short-term (30-min) infusion of 6 g q8h (daily dose, 18 g); (vi) short-term (30-min) infusion of 4 g q6h (daily dose, 16 g). To assess the impact of saturable elimination on the PD profile, each of those six dosage regimens was simulated for all four population PK models at steady state in the absence of residual error and 10,000 subjects for each combination of elimination model and dosage regimen (i.e., 24 × 10,000 subjects in total). The PTA was determined by calculating the fraction of subjects who attained the target at each MIC. The PK/PD breakpoint was defined as the highest MIC for which the PTA was at least 90%.
To estimate the clinical relevance of the differences between the four elimination models for piperacillin, the overall expectation value for the PTA (also called the cumulative fraction of response [CFR]), i.e., the expected population PTA for a specific dosage regimen and a specific population of microorganisms (29), was calculated. The expectation values of the five dosage regimens against Pseudomonas aeruginosa, Klebsiella pneumoniae, and Escherichia coli were calculated based on MIC distributions published by the European Committee on Antimicrobial Susceptibility Testing (EUCAST; accessed 6 August 2012) (19). EUCAST MIC distributions are collated from worldwide sources. In addition, various other published MIC distributions were considered, including distributions from hospitals and from cystic fibrosis patients (1, 22–24, 32, 35) to thoroughly explore the maximum difference in PTA expectation values due to use of different elimination models.
RESULTS
All 10 subjects completed the study. The average ± standard deviation (SD) weight was 69.6 ± 9.7 kg, height was 177.5 ± 8.0 cm, and age was 25.7 ± 3.1 years. All subjects had normal renal function (range of creatinine clearances [calculated with the Cockcroft-Gault equation], 76 to 125 ml/min). Piperacillin plasma concentrations and amounts in urine (Fig. 1) demonstrated that the urinary excretion was saturated to a higher degree at the 3,000-mg than the 1,500-mg dose.
Fig 1.
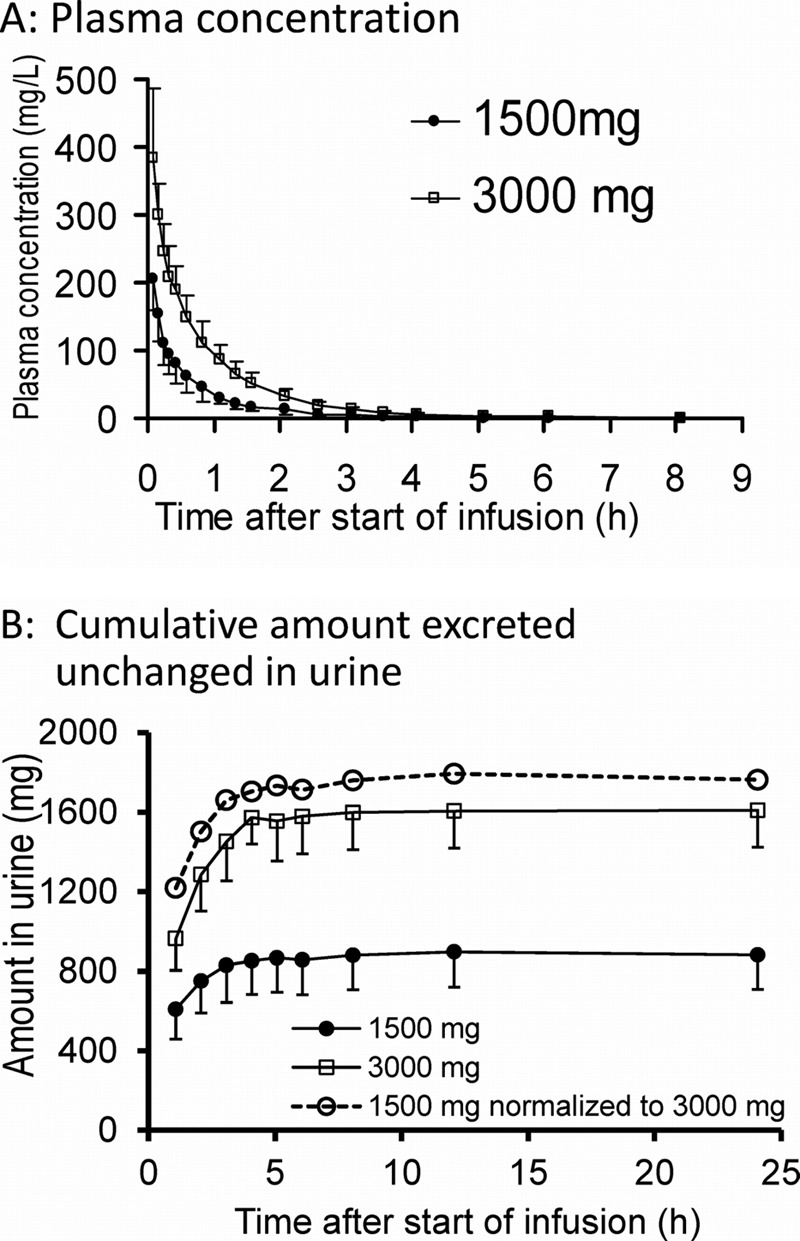
Average (± SD) profiles of piperacillin in healthy volunteers after 5-min infusion of 1,500 mg or 3,000 mg piperacillin. (A) Plasma drug concentrations; (B) cumulative amounts excreted unchanged in urine. The dashed line in panel B represents the amounts excreted in urine after the 1,500-mg dose multiplied by 2.
Noncompartmental analysis.
Doubling the dose reduced the renal clearance by 24% (P = 0.02), while the nonrenal clearance was not affected (Table 1; Fig. 2). Total body clearance decreased by 18% (P < 0.01).
Table 1.
Pharmacokinetic parameters for 1,500 mg and 3,000 mg piperacillin from noncompartmental analysisa
| Parameter | Geometric mean (% CV) |
% point estimate (90% CI) for 3,000-mg/1,500-mg dose ratio | P valuec | |
|---|---|---|---|---|
| 3,000 mg | 1,500 mg | |||
| Total body clearance (liters/h) | 11.0 (23) | 13.5 (24) | 82 (76–89) | <0.01 |
| Renal clearance (liters/h) | 5.88 (27) | 7.77 (34) | 76 (63–91) | 0.02 |
| Nonrenal clearance (liters/h) | 5.08 (23) | 5.34 (31) | 95 (80–114) | 0.62 |
| Fraction excreted unchanged in urine | 0.53 (11) | 0.58 (20) | 92 (81–106) | 0.31 |
| Vol of distribution at steady state (liters) | 10.8 (17) | 12.1 (22) | 89 (79–101) | 0.13 |
| Peak plasma concn (mg/liter) | 377 (25) | 201 (22) | 187 (155–226)b | <0.01b |
| Terminal half-life (h) | 1.05 (26) | 1.18 (77) | 89 (60–132) | 0.60 |
| Mean residence time (h) | 0.98 (10) | 0.90 (27) | 109 (98–121) | 0.17 |
Abbreviations: CV, coefficient of variation; CI, confidence interval.
These estimates and P values apply to a comparison of peak concentrations without dose normalization.
P value derived using ANOVA statistics on a log scale.
Fig 2.
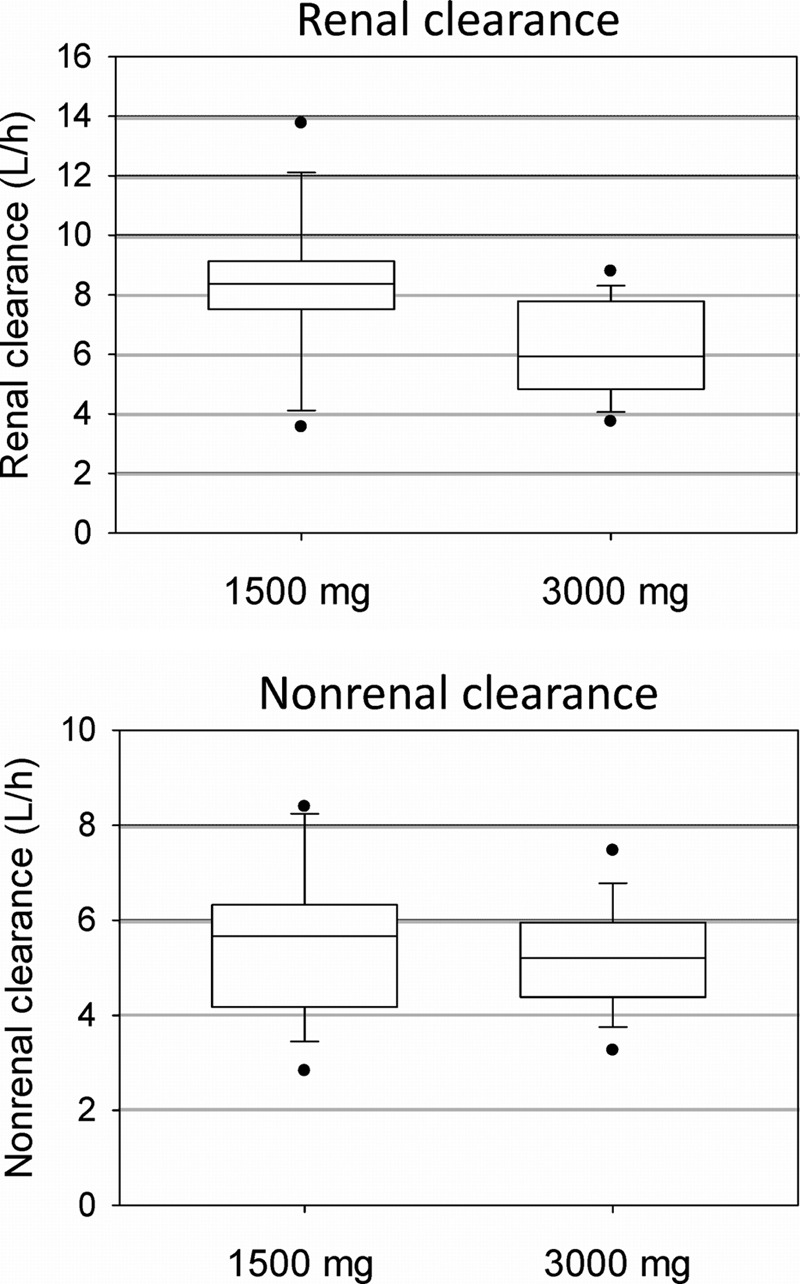
Renal and nonrenal clearance from noncompartmental analysis after administration of 1,500 mg or 3,000 mg piperacillin to healthy volunteers. The boxes show the 25th, 50th, and 75th percentiles, and whiskers are the 10th and 90th percentiles; filled circles are the minima and maxima.
Population pharmacokinetics.
Three-compartment disposition models were selected because they had approximately 130-point-better objective functions (−2× log likelihood) and better predictive performance than two-compartment models. Table 2 shows the parameter estimates from NONMEM for the four elimination models, including the final model, model 3. A saturable renal elimination resulted in a large improvement in the objective function (model 2 versus 1). Inclusion of first-order renal clearance in parallel with saturable renal clearance (model 3) further improved the objective function by 13.8 in NONMEM (Table 2) and by 10.6 in S-ADAPT (Table 3). The first-order renal clearance (CLR, 4.42 liter/h [Table 2]) was similar to the glomerular filtration rate multiplied by the unbound fraction (0.70) of piperacillin in plasma. At therapeutic piperacillin concentrations, the mixed-order renal elimination was much more saturated in model 3 (KmR, 36.1 mg/liter) than in model 2 (KmR, 199 mg/liter). This was expected, as the saturable elimination was the only renal elimination pathway in model 2. Figure 3 shows the decreases in total and renal clearance with increasing plasma concentrations for model 3.
Table 2.
Estimated population means and between-subject variabilities for the different elimination models based on NONMEM
| Parametera (units) | Type of elimination model or estimated population mean (% BSV CV) |
|||
|---|---|---|---|---|
| Model 1 | Model 2 | Model 3 | Model 4 | |
| Renal elimination | First order | Mixed order | Parallel first order and mixed order | Parallel first order and mixed order |
| Nonrenal elimination | First order | First order | First order | Mixed order |
| Δ objective functionb | +76.9 | +13.8 | 0 | −14.3 |
| CLR (liters/h) | 8.46 (39) | 4.42 (47) | 4.96 (42) | |
| VmaxR (mg/h) | 1,980 (33) | 219 (84) | 134 (70) | |
| KmR (mg/liter) | 199 (65) | 36.1 (112) | 24.0 (107) | |
| CLNR (liters/h) | 3.40 (30) | 5.49 (18) | 5.44 (18) | |
| VmaxNR (mg/h) | 3,350 (122) | |||
| KmNR (mg/liter) | 456 (142) | |||
| Vss (liters) | 12.0 | 12.8 | 12.6 | 13.4 |
| V1 (liters) | 6.42 (18) | 6.20 (18) | 6.32 (18) | 6.32 (20) |
| V2 (liters) | 3.63 (40) | 4.02 (48) | 3.59 (48) | 3.52 (45) |
| V3 (liters) | 1.92 (31) | 2.61 (16) | 2.69 (15) | 3.58 (7) |
| CLicshallow (liters/h) | 14.0 | 18.3 | 15.2 | 16.4 |
| CLicdeep (liters/h) | 0.623 | 1.67 | 1.65 | 2.55 |
| TK0 (fixed; min) | 5 | 5 | 5 | 5 |
| CVC (%) | 13.1 | 12.8 | 12.8 | 12.4 |
| SDC (mg/liter) | 0.31 | 0.27 | 0.26 | 0.28 |
| CVAU (%) | 39.0 | 25.5 | 24.7 | 22.5 |
| SDAU (mg) | 1.44 | 4.21 | 4.17 | 4.30 |
Estimated population means (coefficients of variation for between-subject variability) for different elimination models from NONMEM (using the FOCE+I algorithm), including between-subject variability and a full covariance matrix for all parameters except for CLicshallow and CLicdeep. Abbreviations: CLR, first-order renal clearance; VmaxR, maximum rate of elimination for mixed-order renal elimination; KmR, Michaelis-Menten constant for mixed-order renal elimination; CLNR, nonrenal clearance; VmaxNR, maximum rate of elimination for mixed-order nonrenal elimination; KmNR, Michaelis-Menten constant for mixed-order nonrenal elimination; Vss, volume of distribution at steady state; V1, volume of distribution for central compartment; V2 volume of distribution for the shallow peripheral compartment; V3, volume of distribution for the deep peripheral compartment; CLicshallow, intercompartmental clearance between the central and the shallow peripheral compartments; CLicdeep, intercompartmental clearance between the central and the deep peripheral compartments; TK0, duration of zero-order input (not estimated); CVC, proportional residual error component for the plasma drug concentrations; SDC, additive residual error component for the plasma drug concentrations; CVAU, proportional residual error component for the amounts of drug excreted in urine; SDAU, additive residual error component for the amounts of drug excreted in urine.
Objective function differences were calculated based on the −2× log likelihood.
Table 3.
Estimated population means and between-subject variabilities for the different elimination models based on S-ADAPTa
| Parameter (units) | Type of elimination model or estimated population mean (% BSV CV) |
|||
|---|---|---|---|---|
| Model 1 | Model 2 | Model 3 | Model 4 | |
| Renal elimination | First order | Mixed order | Parallel first order and mixed order | Parallel first order and mixed order |
| Nonrenal elimination | First order | First order | First order | Mixed order |
| Δ objective functionb | +69.6 | +10.6 | 0 | −4.5 |
| CLR (liters/h) | 8.37 (41) | 4.70 (39) | 4.56 (41) | |
| VmaxR (mg/h) | 2,327 (40) | 234 (52) | 254 (60) | |
| KmR (mg/liter) | 239 (76) | 46.0 (108) | 48.3 (122) | |
| CLNR (liters/h) | 3.24 (35) | 5.29 (19) | 5.26 (19) | |
| VmaxNR (mg/h) | 3,655 (79) | |||
| KmNR (mg/liter) | 560 (88) | |||
| Vss (liters) | 11.7 | 13.0 | 12.7 | 13.3 |
| V1 (liters) | 6.35 (19) | 6.20 (19) | 6.35 (19) | 6.35 (20) |
| V2 (liters) | 3.42 (45) | 4.28 (48) | 3.79 (50) | 4.04 (44) |
| V3 (liters) | 1.96 (32) | 2.50 (26) | 2.55 (26) | 2.91 (16) |
| CLicshallowc (liters/h) | 14.4 (15) | 17.3 (15) | 14.8 (15) | 15.6 (15) |
| CLicdeepc (liters/h) | 0.695 (15) | 1.17 (15) | 1.19 (15) | 1.58 (15) |
| TK0 (fixed; min) | 5 | 5 | 5 | 5 |
| CVC (%) | 11.9 | 12.0 | 12.0 | 11.8 |
| SDC (mg/liter) | 0.22 | 0.18 | 0.17 | 0.19 |
| CVAU (%) | 34.2 | 22.6 | 20.7 | 19.0 |
| SDAU (mg) | 1.19 | 2.61 | 2.87 | 3.24 |
Estimated population means (coefficients of variation for between-subject variability) for different elimination models from S-ADAPT (MC-PEM algorithm), including estimated between-subject variability and a full covariance matrix for all parameters except CLicshallow and CLicdeep. For parameter explanations, see footnote a of Table 2.
Objective function differences were calculated based on the −2× log likelihood.
The BSV CLicshallow and CLicdeep values were fixed to 15% not estimated.
Fig 3.

Linear renal clearance, saturable renal clearance, linear nonrenal clearance, and total body clearance at various plasma concentrations of piperacillin for model 3 (Table 2). The approximate range of clinically encountered piperacillin concentrations was 45 to 80 mg/liter (the 10th to 90th percentiles from the Monte Carlo simulation) for continuous infusion of 18 g/day, 0 to 60 mg/liter for a 4-h infusion of 3 g q8h, and 0 to 600 mg/liter for a 0.5-h infusion of 6 g q8h.
Modeling the nonrenal elimination as a saturable process further improved the objective function by 14.3 in NONMEM (P = 0.001, likelihood ratio test), but only by 4.5 in S-ADAPT (P = 0.11). The individual estimates for the Michaelis-Menten constant of the nonrenal elimination (KmNR) suggested that the nonrenal elimination was saturated only in some subjects. Therefore, model 3 was chosen as the final model. The parameter estimates in NONMEM (Table 2; FOCE+I algorithm) and S-ADAPT (Table 3; importance sampling) were in excellent agreement, which provided further confidence for the results. The relative standard errors for all population mean parameter estimates were below 36% for model 3.
The predictive performances of models 2 and 4 were similar to model 3 (Fig. 4, NONMEM estimates) and were very good for models 2 to 4. The visual predictive checks for the parameter estimates from S-ADAPT (results not shown) were similar to those from NONMEM. Model 1 (only linear elimination) was inferior, as it predicted a median drug amount in urine 1 h after the end of the infusion that was 23% higher than the highest observed amount for the 3,000-mg dose. Model 1 also overpredicted the plasma drug concentrations after the 1,500-mg dose and slightly underpredicted the plasma drug concentrations after the 3,000-mg dose.
Fig 4.

Visual predictive checks for plasma drug concentrations and amounts of drug excreted unchanged in urine for model 3 (see Table 2). The plots show the observed data and the 80% prediction interval (i.e., between the 10th to 90th percentiles) and the interquartile range (i.e., between the 25th and 75th percentiles) from 4,000 simulated subjects. Ideally, 50% of the observed data points should fall inside the interquartile range at each time point, and 80% of the observed data should fall inside the 80% prediction interval.
Monte Carlo simulations.
The four elimination models yielded very similar PTA-versus-MIC profiles (Fig. 5) for the 4-h infusion of 3 g piperacillin q8h and the continuous infusion of 18 g/day. For continuous infusion of 6 g/day, slightly higher PTAs were predicted for model 1 than for the other models. The largest differences between models with different assumptions on saturability of elimination were seen for the dosage regimen with the most pronounced peaks (30-min infusion of 6 g q8h). The PTA-versus-MIC profiles based on simulations from the S-ADAPT parameter estimates (results not shown) were very similar to the MCS results from NONMEM.
Fig 5.

Probabilities of target attainment for the four population PK models (Table 2) and different dosage regimens of piperacillin (PK/PD target, fT>MIC of ≥50%). ▲, first-order renal and first-order nonrenal elimination (model 1); □, mixed-order renal and first-order nonrenal elimination (model 2); ◊, parallel first- and mixed-order renal and first-order nonrenal elimination (model 3); and ○, parallel first- and mixed-order renal and mixed-order nonrenal elimination (model 4).
The PK/PD breakpoints were 8 mg/liter for 6 g as a continuous infusion, 12 mg/liter for the 4-h infusion of 3 g q8h, and 24 mg/liter for 18 g as a continuous infusion for all four elimination models. For the different elimination models, the 30-min infusion of 4 g q8h achieved breakpoints of 2 to 3 mg/liter. The range of breakpoints was 4 to 8 mg/liter for the 30-min infusion of 4 g q6h and 3 to 6 mg/liter for the 30-min infusion of 6 g q8h. The breakpoints from model 3 were at the low end of the range, i.e., the most conservative, and model 2 predicted the highest breakpoints. Overall, the differences in breakpoints due to different modes of administration, e.g., 18 g as a continuous infusion versus 30-min infusion of 6 g q8h, were considerably larger than differences due to saturable versus linear elimination.
A continuous infusion of 6 g per day had a higher PTA expectation value than the short-term infusions of 4 g q8h at a daily dose of 12 g, and this was consistent for various MIC distributions (Table 4). As expected, the continuous infusion of 18 g/day yielded higher PTA expectation values than short-term infusions of 6 g q8h for all three pathogens. For continuous and prolonged infusions, the PTA expectation values differed by less than 4.2% (68.6% versus 64.4%) for the linear compared to saturable models. For the 30-min infusions of 6 g q8h, the maximum difference was 9.7% (53.8% for model 1 versus 63.5% for model 2). For a variety of MIC distributions (1, 22–24, 32, 35), the maximum difference was below 10%.
Table 4.
PTA expectation values for piperacillin versus E. coli, K. pneumoniae, and P. aeruginosa (EUCAST) based on the PK/PD target fT>MIC of ≥50% for the four elimination models
| Dosage regimen | Elimination modela | PTA expectation value (%) |
||
|---|---|---|---|---|
| E. coli (n = 51,561) | K. pneumoniae (n = 21,507) | P. aeruginosa (n = 31,535) | ||
| Daily dose: 6 g piperacillin as continuous infusion | 1 | 93.8 | 83.7 | 68.6 |
| 2 | 93.1 | 82.1 | 65.2 | |
| 3 | 93.2 | 82.4 | 65.9 | |
| 4 | 92.9 | 81.8 | 64.4 | |
| Daily dose: 9 g piperacillin 3 g q8h as 4-h infusions | 1 | 95.2 | 86.6 | 75.3 |
| 2 | 94.9 | 85.9 | 73.8 | |
| 3 | 95.1 | 86.4 | 74.7 | |
| 4 | 95.0 | 86.1 | 74.2 | |
| Daily dose: 18 g piperacillin as continuous infusion | 1 | 96.8 | 89.4 | 81.7 |
| 2 | 96.7 | 89.2 | 81.3 | |
| 3 | 96.8 | 89.4 | 81.7 | |
| 4 | 96.8 | 89.4 | 81.7 | |
| Daily dose: 12 g piperacillin as 4 g q8h, 0.5-h infusions | 1 | 85.9 | 67.8 | 41.1 |
| 2 | 88.7 | 72.4 | 47.1 | |
| 3 | 83.3 | 66.1 | 42.6 | |
| 4 | 86.3 | 70.0 | 46.6 | |
| Daily dose: 18 g piperacillin as 6 g q8h, 0.5-h infusions | 1 | 90.2 | 76.0 | 53.8 |
| 2 | 92.7 | 81.2 | 63.5 | |
| 3 | 89.7 | 76.1 | 56.3 | |
| 4 | 91.9 | 79.8 | 62.1 | |
| Daily dose: 16 g piperacillin as 4 g q6h, 0.5-h infusions | 1 | 93.0 | 81.8 | 64.9 |
| 2 | 93.8 | 83.6 | 68.5 | |
| 3 | 92.4 | 81.0 | 64.2 | |
| 4 | 93.3 | 82.5 | 66.8 | |
See Table 2 for further details on the four elimination models.
DISCUSSION
Piperacillin is frequently used in combination with tazobactam for the empirical treatment of hospital-acquired infections. It is subject to glomerular filtration (a first-order nonsaturable process) and active tubular secretion (a capacity-limited process), as well as nonrenal elimination. Conflicting data exist on the extent of saturation of piperacillin elimination and which pathway it arises from. Saturable elimination has been reported for the renal pathway (6), the nonrenal pathway (10, 34), and both (36). The older studies on piperacillin used standard noncompartmental methods, which are based on the assumption of linear PK and do not account for saturation of clearance. Occhipinti et al. (30) found no statistically significant differences in PK parameters from standard two-stage analysis between two similar dosage regimens of piperacillin-tazobactam (3.375 g q6h and 4.5 g q8h) in 12 healthy volunteers. Three recent population PK analyses favored models with saturable elimination over models with first-order elimination only (12, 27, 40). To our knowledge, there exists no crossover study with different piperacillin dose levels that was analyzed by population PK modeling. Also, the impact of the saturation of piperacillin elimination on the selection of optimal dosage regimens has not yet been systematically assessed.
The present well-controlled crossover study was performed at two dose levels with frequent plasma and urine samples over 24 h and with careful sample handling and bioanalysis to minimize drug degradation. The intensive sampling and latest population pharmacokinetic analysis benefitted the estimation of a 3-compartment model as well as quantification of saturable elimination. Models that include a mixed-order renal elimination were superior to the model with only linear elimination. Model 3 is the physiologically most plausible model for renal elimination, as it includes parallel first-order and mixed-order renal elimination and a KmR of 36.1 mg/liter, which is well in the range of therapeutic piperacillin plasma concentrations. Together with the significant decrease in renal clearance at the higher dose (Table 1), this clearly showed the presence of (partly) saturable renal elimination (Fig. 1B). The estimates for models 1 to 3 (Tables 2 and 3) reasonably agreed with previous studies, given the variability of the PK parameters (12, 27, 40).
The noncompartmental estimates for nonrenal clearance did not change significantly with dose (Table 1). The KmNR was 456 mg/liter, with a large BSV of 142% (Table 2). This suggested a small impact of a potential saturation of nonrenal elimination at clinically relevant concentrations, since the KmNR was approximately 6- to 8-fold above the expected concentrations for prolonged and continuous infusions. Both models 3 and 4 had very good predictive performances, and their model structures and estimates were physiologically plausible. Model 3 was chosen as the final model, following the rule of parsimony. While both population PK analyses (Tables 2 and 3) found saturable PK of piperacillin, the small sample size of this study in healthy volunteers presents a potential limitation.
The saturation of piperacillin elimination at therapeutic concentrations appears to be lower than that of other acylureidopenicillins, such as azlocillin (9). Analyses using only part of the data in this study demonstrated that plasma data at two dose levels or plasma and urine data at one dose level were necessary to estimate VmaxR and KmR. This suggested that the lack of urine data or the lack of data at multiple dose levels contribute significantly to conflicting results in the literature about the saturable elimination of piperacillin. Also, a known saturation in elimination, as demonstrated for mezlocillin in volunteers (9, 21, 28), is not always seen in patients. In a crossover study with acutely infected, traumatized patients with renal dysfunction, a fixed daily dose of mezlocillin was given as large doses with long intervals or as small frequent doses (18). Those authors observed a similar net saturation of elimination after both regimens at steady state, probably due to continuous saturation of mezlocillin elimination. Thus, the PK appeared linear for this study design (18).
As our study was performed in healthy volunteers, it needs to be considered that the pharmacokinetic parameters of piperacillin might be different in patients. Lodise et al. (27) found a 27% lower total body clearance and a larger volume of distribution for hospitalized patients than for volunteers. Roberts et al. (31) reported a considerably higher clearance (17.2 liters/h) and volume of distribution (Vd, 25.0 liters) in critically ill patients with sepsis than in healthy volunteers. Still, investigation of the extent of saturability of piperacillin elimination in a healthy volunteer study possibly provides advantages. The latter is more sensitive for detecting the extent of saturation, which may be masked by the larger variability in patients and additional complexities due to impaired renal function, as is often seen in patients with hospital-related infections.
In clinical practice, piperacillin is given in combination with tazobactam, whereas in our study piperacillin was given alone. The pharmacokinetics of piperacillin are not affected by concomitant administration of tazobactam at dose ratios of 4:1 or 8:1 (33).
The main issue for clinical practice is whether saturation of elimination pathways has an impact on the expected treatment outcome. The predicted PTA-versus-MIC profiles (Fig. 5) did not differ much between models for continuous and prolonged infusions. However, differences were observed for the high-dose short-term infusions. The maximum difference in the PTA expectation values between linear and saturable models (Table 4) was below 10% if the PTA expectation values were around 50 to 65%, and it was below 2% for PTA expectation values above 90%. With MCS on 14 additional MIC distributions, no larger differences between elimination models were found (results not shown). As these differences were small compared to the differences between dosage regimens, saturable elimination had a limited impact on the choice of optimal dosage regimens.
The BSV is larger in patients, and other factors, such as decreased renal function, are expected to have a higher influence on the PTA than the saturable elimination. In critically ill patients, such as patients with sepsis, reported large increases in clearance and volume of distribution are most likely to have a much larger effect on the clinical outcome than the saturable elimination (38).
In conclusion, at therapeutic piperacillin concentrations, renal elimination showed a considerable extent of saturation, whereas the degree of saturation for the nonrenal pathway was much lower and more variable. At least plasma drug concentrations at two different dose levels or plasma drug concentrations and amounts in urine at one dose level were necessary to soundly estimate the nonlinearity. This is likely a reason why other studies have described the PK of piperacillin by linear elimination. Extensive MCS have shown a limited impact of saturable elimination on the PTA-versus-MIC profiles and PTA expectation values and no impact on the choice of optimal dosage regimens. Therefore, the saturable elimination is not expected to be of major clinical importance in patients for relevant dosage regimens at daily doses of 6 to 18 g piperacillin. Many other factors are present that increase the variability in patients and affect the clinical outcome. Future studies are needed to assess the importance of saturable renal elimination in patients with moderate to severe renal failure.
Footnotes
Published ahead of print 20 August 2012
REFERENCES
- 1. Ambrose PG, Bhavnani SM, Jones RN. 2003. Pharmacokinetics-pharmacodynamics of cefepime and piperacillin-tazobactam against Escherichia coli and Klebsiella pneumoniae strains producing extended-spectrum beta-lactamases: report from the ARREST program. Antimicrob. Agents Chemother. 47:1643–1646 [DOI] [PMC free article] [PubMed] [Google Scholar]
- 2. Ambrose PG, et al. 2007. Pharmacokinetics-pharmacodynamics of antimicrobial therapy: it's not just for mice anymore. Clin. Infect. Dis. 44:79–86 [DOI] [PubMed] [Google Scholar]
- 3. Andes D, Craig WA. 2002. Animal model pharmacokinetics and pharmacodynamics: a critical review. Int. J. Antimicrob. Agents 19:261–268 [DOI] [PubMed] [Google Scholar]
- 4. Anonymous 1999. Piperacillin sodium and tazobactam sodium (Zosyn) product information. Lederle Laboratories, Pearl River, NY [Google Scholar]
- 5. Aronoff GR, Sloan RS, Brier ME, Luft FC. 1983. The effect of piperacillin dose on elimination kinetics in renal impairment. Eur. J. Clin. Pharmacol. 24:543–547 [DOI] [PubMed] [Google Scholar]
- 6. Batra VK, Morrison JA, Lasseter KC, Joy VA. 1979. Piperacillin kinetics. Clin. Pharmacol. Ther. 26:41–53 [DOI] [PubMed] [Google Scholar]
- 7. Bauer RJ. 2010. S-ADAPT/MCPEM user's guide (version 1.57). Software for pharmacokinetic, pharmacodynamic and population data analysis. Biomedical Simulations Resource, University of Southern California, Los Angeles, CA [Google Scholar]
- 8. Beal SL, Sheiner LB, Boeckmann AJ. 2006. NONMEM user's guides (1989–2006). Icon Development Solutions, Ellicott City, MD [Google Scholar]
- 9. Bergan T. 1981. Overview of acylureidopenicillin pharmacokinetics. Scand. J. Infect. Dis. Suppl. 29:33–48 [PubMed] [Google Scholar]
- 10. Bergan T, Williams JD. 1982. Dose dependence of piperacillin pharmacokinetics. Chemotherapy 28:153–159 [DOI] [PubMed] [Google Scholar]
- 11. Bulitta JB, Bingolbali A, Shin BS, Landersdorfer CB. 2011. Development of a new pre- and post-processing tool (SADAPT-TRAN) for nonlinear mixed-effects modeling in S-ADAPT. AAPS J. 13:201–211 [DOI] [PMC free article] [PubMed] [Google Scholar]
- 12. Bulitta JB, et al. 2010. Nonlinear pharmacokinetics of piperacillin in healthy volunteers: implications for optimal dosage regimens. Br. J. Clin. Pharmacol. 70:682–693 [DOI] [PMC free article] [PubMed] [Google Scholar]
- 13. Bulitta JB, et al. 2011. Comparable population pharmacokinetics and pharmacodynamic breakpoints of cefpirome in cystic fibrosis patients and healthy volunteers. Antimicrob. Agents Chemother. 55:2927–2936 [DOI] [PMC free article] [PubMed] [Google Scholar]
- 14. Bulitta JB, Landersdorfer CB. 2011. Performance and robustness of the Monte Carlo importance sampling algorithm using parallelized S-ADAPT for basic and complex mechanistic models. AAPS J. 13:212–226 [DOI] [PMC free article] [PubMed] [Google Scholar]
- 15. Bulitta JB, et al. 2011. Relevance of pharmacokinetic and pharmacodynamic modeling to clinical care of critically ill patients. Curr. Pharm. Biotechnol. 12:2044–2061 [DOI] [PubMed] [Google Scholar]
- 16. Craig WA. 1998. Pharmacokinetic/pharmacodynamic parameters: rationale for antibacterial dosing of mice and men. Clin. Infect. Dis. 26:1–12 [DOI] [PubMed] [Google Scholar]
- 17. Drusano GL. 2004. Antimicrobial pharmacodynamics: critical interactions of ‘bug and drug’. Nat. Rev. Microbiol. 2:289–300 [DOI] [PubMed] [Google Scholar]
- 18. Drusano GL, Forrest A, Fiore D, Auger F, Caplan ES. 1984. Effect of saturable clearance during high-dose mezlocillin therapy. Antimicrob. Agents Chemother. 26:686–688 [DOI] [PMC free article] [PubMed] [Google Scholar]
- 19. European Committee on Antimicrobial Susceptibility Testing 2012. EUCAST MIC distribution website. EUCAST, Voxjo, Sweden: http://www.eucast.org [Google Scholar]
- 20. Evans MA, Wilson P, Leung T, Williams JD. 1978. Pharmacokinetics of piperacillin following intravenous administration. J. Antimicrob. Chemother. 4:255–261 [DOI] [PubMed] [Google Scholar]
- 21. Flaherty JF, Barriere SL, Mordenti J, Gambertoglio JG. 1987. Effect of dose on pharmacokinetics and serum bactericidal activity of mezlocillin. Antimicrob. Agents Chemother. 31:895–898 [DOI] [PMC free article] [PubMed] [Google Scholar]
- 22. Kiffer CR, Mendes C, Kuti JL, Nicolau DP. 2004. Pharmacodynamic comparisons of antimicrobials against nosocomial isolates of Escherichia coli, Klebsiella pneumoniae, Acinetobacter baumannii and Pseudomonas aeruginosa from the MYSTIC surveillance program: the OPTAMA program, South America 2002. Diagn. Microbiol. Infect. Dis. 49:109–116 [DOI] [PubMed] [Google Scholar]
- 23. Kuti JL, Nightingale CH, Nicolau DP. 2004. Optimizing pharmacodynamic target attainment using the MYSTIC antibiogram: data collected in North America in 2002. Antimicrob. Agents Chemother. 48:2464–2470 [DOI] [PMC free article] [PubMed] [Google Scholar]
- 24. Kuti JL, Nightingale CH, Quintiliani R, Nicolau DP. 2002. Pharmacodynamic profiling of continuously infused piperacillin/tazobactam against Pseudomonas aeruginosa using Monte Carlo analysis. Diagn. Microbiol. Infect. Dis. 44:51–57 [DOI] [PubMed] [Google Scholar]
- 25. Landersdorfer CB, et al. 2009. Competitive inhibition of renal tubular secretion of gemifloxacin by probenecid. Antimicrob. Agents Chemother. 53:3902–3907 [DOI] [PMC free article] [PubMed] [Google Scholar]
- 26. Landersdorfer CB, et al. 2010. Competitive inhibition of renal tubular secretion of ciprofloxacin and metabolite by probenecid. Br. J. Clin. Pharmacol. 69:167–178 [DOI] [PMC free article] [PubMed] [Google Scholar]
- 27. Lodise TP, Jr, Lomaestro B, Rodvold KA, Danziger LH, Drusano GL. 2004. Pharmacodynamic profiling of piperacillin in the presence of tazobactam in patients through the use of population pharmacokinetic models and Monte Carlo simulation. Antimicrob. Agents Chemother. 48:4718–4724 [DOI] [PMC free article] [PubMed] [Google Scholar]
- 28. Mangione A, Boudinot FD, Schultz RM, Jusko WJ. 1982. Dose-dependent pharmacokinetics of mezlocillin in relation to renal impairment. Antimicrob. Agents Chemother. 21:428–435 [DOI] [PMC free article] [PubMed] [Google Scholar]
- 29. Mouton JW, Dudley MN, Cars O, Derendorf H, Drusano GL. 2005. Standardization of pharmacokinetic/pharmacodynamic (PK/PD) terminology for anti-infective drugs: an update. J. Antimicrob. Chemother. 55:601–607 [DOI] [PubMed] [Google Scholar]
- 30. Occhipinti DJ, et al. 1997. Pharmacokinetics and pharmacodynamics of two multiple-dose piperacillin-tazobactam regimens. Antimicrob. Agents Chemother. 41:2511–2517 [DOI] [PMC free article] [PubMed] [Google Scholar]
- 31. Roberts JA, Kirkpatrick CM, Roberts MS, Dalley AJ, Lipman J. 2010. First-dose and steady-state population pharmacokinetics and pharmacodynamics of piperacillin by continuous or intermittent dosing in critically ill patients with sepsis. Int. J. Antimicrob. Agents 35:156–163 [DOI] [PubMed] [Google Scholar]
- 32. Schulin T. 2002. In vitro activity of the aerosolized agents colistin and tobramycin and five intravenous agents against Pseudomonas aeruginosa isolated from cystic fibrosis patients in southwestern Germany. J. Antimicrob. Chemother. 49:403–406 [DOI] [PubMed] [Google Scholar]
- 33. Sorgel F, Kinzig M. 1993. The chemistry, pharmacokinetics and tissue distribution of piperacillin/tazobactam. J. Antimicrob. Chemother. 31(Suppl A):39–60 [DOI] [PubMed] [Google Scholar]
- 34. Sorgel F, Kinzig M. 1994. Pharmacokinetic characteristics of piperacillin/tazobactam. Intensive Care Med. 20(Suppl 3):S14–S20 [DOI] [PubMed] [Google Scholar]
- 35. Spencker FB, Staber L, Lietz T, Schille R, Rodloff AC. 2003. Development of resistance in Pseudomonas aeruginosa obtained from patients with cystic fibrosis at different times. Clin. Microbiol. Infect. 9:370–379 [DOI] [PubMed] [Google Scholar]
- 36. Tjandramaga TB, Mullie A, Verbesselt R, De Schepper PJ, Verbist L. 1978. Piperacillin: human pharmacokinetics after intravenous and intramuscular administration. Antimicrob. Agents Chemother. 14:829–837 [DOI] [PMC free article] [PubMed] [Google Scholar]
- 37. Touw DJ. 1998. Clinical pharmacokinetics of antimicrobial drugs in cystic fibrosis. Pharm. World Sci. 20:149–160 [DOI] [PubMed] [Google Scholar]
- 38. Udy AA, Roberts JA, Boots RJ, Paterson DL, Lipman J. 2010. Augmented renal clearance: implications for antibacterial dosing in the critically ill. Clin. Pharmacokinet. 49:1–16 [DOI] [PubMed] [Google Scholar]
- 39. Viaene E, Chanteux H, Servais H, Mingeot-Leclercq MP, Tulkens PM. 2002. Comparative stability studies of antipseudomonal beta-lactams for potential administration through portable elastomeric pumps (home therapy for cystic fibrosis patients) and motor-operated syringes (intensive care units). Antimicrob. Agents Chemother. 46:2327–2332 [DOI] [PMC free article] [PubMed] [Google Scholar]
- 40. Vinks AA, Den Hollander JG, Overbeek SE, Jelliffe RW, Mouton JW. 2003. Population pharmacokinetic analysis of nonlinear behavior of piperacillin during intermittent or continuous infusion in patients with cystic fibrosis. Antimicrob. Agents Chemother. 47:541–547 [DOI] [PMC free article] [PubMed] [Google Scholar]
- 41. Welling PG, et al. 1983. Pharmacokinetics of piperacillin in subjects with various degrees of renal function. Antimicrob. Agents Chemother. 23:881–887 [DOI] [PMC free article] [PubMed] [Google Scholar]