

Abstract
The hyperpolarization-activated current (Ih) has been implicated in nociception/pain, but its expression levels in nociceptors remained unknown. We recorded Ih magnitude and properties by voltage clamp from dorsal root ganglion (DRG) neurons in vivo, after classifying them as nociceptive or low-threshold-mechanoreceptors (LTMs) and as having C-, Aδ- or Aα/β-conduction velocities (CVs). For both nociceptors and LTMs, Ih amplitude and Ih density (at −100 mV) were significantly positively correlated with CV. Median Ih magnitudes and Ih density in neuronal subgroups were respectively: muscle spindle afferents (MSAs): −4.6 nA, −33 pA pF−1; cutaneous Aα/β LTMs: −2.2 nA, −20 pA pF−1; Aβ-nociceptors: −2.6 nA, −21 pA pF−1; both Aδ-LTMs and nociceptors: −1.3 nA, ∼−14 pA pF−1; C-LTMs: −0.4 nA, −7.6 pA pF−1; and C-nociceptors: −0.26 nA, −5 pA pF−1. Ih activation slow time constants (slow τ values) were strongly correlated with fast τ values; both were shortest in MSAs. Most neurons had τ values consistent with HCN1-related Ih; others had τ values closer to HCN1+HCN2 channels, or HCN2 in the presence of cAMP. In contrast, median half-activation voltages (V0.5) of −80 to −86 mV for neuronal subgroups suggest contributions of HCN2 to Ih. τ values were unrelated to CV but were inversely correlated with Ih and Ih density for all non-MSA LTMs, and for Aδ-nociceptors. From activation curves ∼2–7% of Ih would be activated at normal membrane potentials. The high Ih may be important for excitability of A-nociceptors (responsible for sharp/pricking-type pain) and Aα/β-LTMs (tactile sensations and proprioception). Underlying HCN expression in these subgroups therefore needs to be determined. Altered Ih expression and/or properties (e.g. in chronic/pathological pain states) may influence both nociceptor and LTM excitability.
Key points
Ih is a hyperpolarisation-activated current that influences neuronal excitability and is present in some sensory neurons.
The magnitude and properties of Ih in different groups of sensory neurons that respond to painful stimuli (nociceptors) or to non-painful stimuli, such as low threshold mechanoreceptors (LTMs), were unknown.
We found that neurons with the greatest Ih were the nociceptors and LTMs with the fastest conducting fibres. The highest Ih of all was present in LTM neurons that sense muscle stretch and length (muscle spindle afferents).
The high levels of Ih could fundamentally influence excitability of fast conducting sensory neurons which detect muscle stretch/length, touch and pressure, and painful stimuli. Ih could thus influence sensations associated with all these.
The properties of Ih are similar to those of HCN1- and HCN2-related Ih, suggesting that these channels underlie the current.
Introduction
The hyperpolarisation-activated current (Ih), that generates inward current at hyperpolarised potentials was first described in cardiac pacemaker cells (DiFrancesco & Ojeda, 1980), and was subsequently identified in a variety of neurons including primary afferent dorsal root ganglion (DRG) neurons (Mayer & Westbrook, 1983; Bader & Bertrand, 1984; Crepel & Penit-Soria, 1986; Maccaferri et al. 1993). In A-fibre neurons in vivo, a membrane voltage, evoked by hyperpolarising current, had properties later associated with Ih (Harper & Lawson, 1985), and Ih was described in mainly medium-large cultured DRG neurons (Chaplan et al. 2003; Yao et al. 2003; Tu et al. 2004). Ih was also recorded in a few acutely isolated DRG small neurons (Scroggs et al. 1994; Cardenas et al. 1999). Ih contributes to electrophysiological properties such as membrane potential (Em) (Tu et al. 2004), adaptation (Spain et al. 1987; Takigawa et al. 1998), and afterhyperpolarisation (McCormick & Pape, 1990; Womble & Moises, 1993) of CNS and DRG neurons and thus is likely to influence membrane excitability.
Ih in DRG neurons has been implicated in chronic pain (Chaplan et al. 2003; Yao et al. 2003; Tu et al. 2004; Momin et al. 2008; Emery et al. 2011). Regarding the types of neurons that express it, a general finding is that larger, or faster conducting, DRG or nodose ganglion neurons express greater Ih, and with faster activation times than smaller, more slowly conducting neurons (Villiere & McLachlan, 1996; Doan & Kunze, 1999; Hogan & Poroli, 2008; Kouranova et al. 2008). However, although DRG neuron soma size is related to fibre conduction velocity (CV) (Harper & Lawson, 1985), it provides only limited guidance as to sensory properties, because all ranges of cell size and CVs (C, Aδ and Aα/β) include both nociceptors and low threshold mechanoreceptors (LTMs) (Fang et al. 2002; Djouhri et al. 2003). Therefore none of the above information indicates whether Ih expression is related to LTMs versus nociceptors, or to CV only.
The channels underlying Ih are the hyperpolarisation-activated, cyclic nucleotide-gated family of four non-selective cation (HCN1–4) channels. HCN1 has the fastest activation rates, followed in order by HCN2, HCN3 and HCN4 (Moosmang et al. 2001). Ih activation rates that differ in different sensory neuronal subgroups will suggest the isoform or isoforms likely to contribute to their Ih. While Ih activation is faster in very large DRG neurons than in small neurons (e.g. Kouranova et al. 2008), activation rates have not been studied in relation to sensory properties.
We therefore investigated Ih in vivo in identified nociceptive and LTM neurons in L4-L6 DRGs. Recordings were made intracellularly in anaesthetised rats and their sensory properties were identified. Discontinuous single electrode voltage clamp was then used to record Ih and examine its magnitude, density and biophysical properties, including reversal potential, fast and slow activation rates (τ values) and half-activation potential (V0.5). We explored whether these variables were related to sensory properties or CVs. The τ and V0.5 values allowed us to predict which HCN isoforms contribute to Ih in different neuronal subgroups.
Methods
Animal preparation
Experimental procedures were under UK Home Office guidelines. Rats were killed at the end of experiments with an anaesthetic overdose. For details of rat preparation for electrophysiological recording see Fang et al. (2002, 2005, 2006) and Djouhri et al. (2003). Female Wistar rats (150–180 g) were anaesthetized with sodium pentobarbital (70–80 mg kg−1, i.p.) to produce deep anaesthesia with no reflex withdrawal to pinch of the forepaw. Fur on the left hindlimb was clipped short. A tracheotomy enabled artificial ventilation and monitoring of end-tidal CO2. The right carotid artery and right external jugular vein were cannulated for blood pressure monitoring and i.v. injections. Throughout the experiment, further anaesthetic (10 mg kg−1, i.v.) was administered hourly. The left L4, L5 and sometimes L6 DRGs and their dorsal roots were exposed. A pool for liquid paraffin was created with dental impression paste (Xantopren VL plus, Hanau, Germany); this was maintained at ∼30°C (28.5–32°C). The core temperature was 35 ± 0.5°C.
The DRG under study was slightly raised by a small silver platform, to improve recording stability; its dorsal root was cut near the spinal cord entry and placed over a pair of bipolar platinum stimulating electrodes within the liquid paraffin. The left hindpaw was fixed with the dorsal hairy surface downwards with superglue to a platform to improve stability during search for receptive fields; the plantar surface was exposed upwards for sensory testing. Blood pressure (∼80–100 mmHg) remained stable throughout experiments, indicating deep anaesthesia. Just prior to recording, muscle relaxant (pancuronium bromide, 1 mg kg−1 i.v.) was administered, with repeat doses approximately hourly. All pancuronium doses were accompanied by the hourly anaesthetic (10 mg kg−1 i.v.).
Intracellular recordings
Borosilicate microelectrodes were filled with 3 m KCl (40–90 MΩ). Neurones were penetrated by advancing the microelectrode in 1 μm steps and applying a small capacitance buzz until an Em was recorded. Once a stable Em was obtained, the dorsal root was stimulated with a rectangular pulse (0.03 ms duration for A-fibre neurons or 0.3 ms for C-fibre neurons) with a gradually increasing voltage until a somatic action potential (AP) was evoked (threshold). A stimulus twice threshold for A-neurons or suprathreshold for C-neurons was used to evoke somatic APs that were recorded for offline analysis. Recordings were amplified (Axoclamp 2A, Molecular Devices, Sunnyvale, CA, USA), digitized (1401, at 40 kHz, Cambridge Electronic Design (CED), Cambridge, UK) and recorded by a PC running CED Spike2 v. 4–6.
Conduction velocity (CV)
The conduction distance between the cathode and the recorded DRG neuron, divided by latency (including utilization time) provided CV as previously described (Djouhri & Lawson, 2001). CV classes were C (<1.0 m s−1), Aδ (1.5 to 6.5 m s−1) or Aα/β(>6.5 m s−1); these boundaries had been determined with dorsal root compound action potentials under the same conditions (temperature, sex, rat weight) (Fang et al. 2002).
Identification of sensory properties
Hand-held stimulators were used to evaluate sensory properties of each recorded DRG neuron. These were applied to the hindlimb and flank. We have published full details of combinations of stimuli and responses to these, necessary to identify different classes of neuron (Lawson et al. 1997; Djouhri et al. 1998; Parekh et al. 2010). Non-noxious mechanical stimuli (including light touch, brushing, tapping, stretching and light pressure) were applied first. Low-threshold mechanoreceptive (LTM) neurons responded to these stimuli. If the neuron did not respond, noxious mechanical stimuli, initially stronger pressure, then pricking (needle), pinching or squeezing (flat or toothed forceps) were applied. Responses to cooling with a brief localized spray of ethyl chloride were tested. Only mechanical nociceptors with superficial receptive fields were tested with heat (hot water >50°C). Nociceptors were neurons that responded only to noxious stimuli; they included high-threshold mechanoreceptors (HTMs), polymodal mechano-heat units, or mechano-cold units. Mechano-heat and mechano-cold units thus had superficial (probably epidermal) receptive fields for mechanical stimuli (responding to pricking or fine superficial pinch). HTMs had superficial or non-superficial (sometimes deep, subcutaneous) receptive fields; those with non-superficial receptive fields were classed as HTMs by default, due to no thermal testing. Cooling units responded only to cooling.
The sensory properties of neurons in each CV group are summarised below. LTMs and nociceptors were in all CV groups. Neurons with Aα/β-fibres included muscle spindle afferents (MSAs), cutaneous LTMs and Aβ-nociceptors. Cutaneous Aα/β-LTMs included rapidly adapting (RA) and slowly adapting (SA) units. RA units responded best to moving stimuli: in glabrous skin they were glabrous RA and in hairy skin they were guard hair (G) or field (F) units. SA units showed sustained firing to sustained gentle pressure. MSAs responded to gentle pressure over the muscle and to vibration (100–250 Hz) and had a receptive field that did not move with the skin if that was moved, showing them to be subcutaneous. Many MSAs showed ongoing firing because of muscle stretch due to (a) extension of the hindlimb and (b) use of muscle relaxant (see Parekh et al. 2010). Nociceptors had Aβ, Aδ or C-fibre CVs. Most Aδ-LTMs were D hair units with large receptive fields that were very sensitive to slow movement of hair, skin stretch and cooling. One such unit was included with Aδ-LTMs despite having a CV of 7.13 m s−1; a few D hair-type units commonly fall slightly above the Aδ CV range (Djouhri & Lawson, 2004). C-LTMs were sensitive to cooling and very slow movement across skin. A-fibre nociceptors were HTMs with superficial or deep receptive fields. A subclass of Aβ-nociceptors that fired in response to moderate pressure but fired more with noxious pressure or pinch, were classed as moderate pressure nociceptors. C-nociceptor subtypes were superficial and deep HTMs, and superficial mechano-heat (polymodal) and mechano-cold units.
Unresponsive neurons failed to respond to all the above mechanical stimuli. Those with C- or Aδ-fibre CVs with typical nociceptor action potential durations, i.e. relatively broad often with a falling-phase inflection, and with a long afterhyperpolarisation (Lawson, 2002; Fang et al. 2005), were designated ‘nociceptor-type’ neurons and included in the nociceptor groups. They are indicated on scatterplots with star symbols (Figs 2–4). No unresponsive Aα/β-units were included.
Figure 2. Ih versus sensory properties and CV.
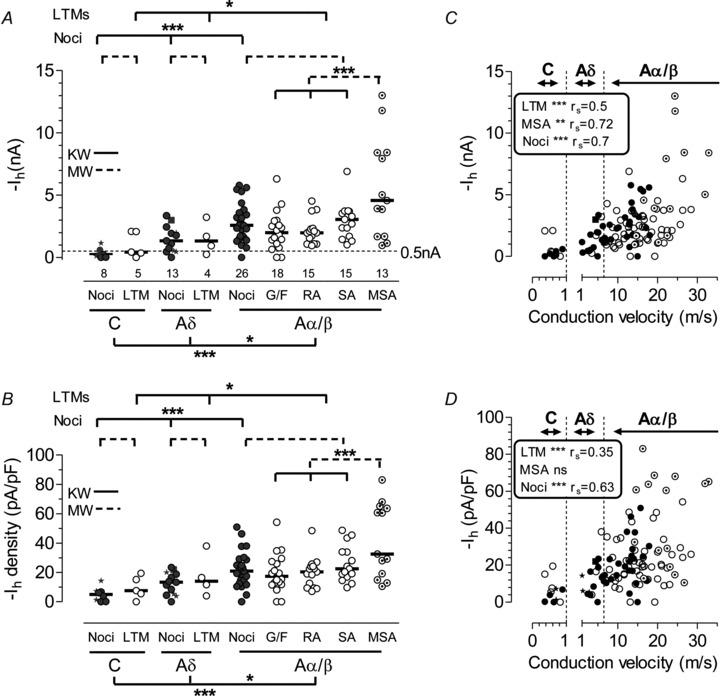
A, Ih magnitude in DRG neurons; each symbol represents Ih amplitude at −100 mV from a neuron with identified sensory properties. Medians are shown. B: Ih density, otherwise as for A. Abbreviations: Noci: nociceptors; LTM: low threshold mechanoreceptors; G/F: G hair or field units; SA: slowly adapting; RA: rapidly adapting; MSA: muscle spindle afferents. Star symbols indicate C- and Aδ-fibre unidentified nociceptor-type neurons. The filled square shows the sole Aδ-mechano-cold unit. Comparisons between medians of variables were with Kruskall–Wallis (KW) test (continuous line/s) with Dunn's post hoc test between all groups compared (a) for all neurons (nociceptors plus LTMs) between C, Aδ and Aα/β neuron groups, results below graphs; then (b) between different CV groups of (i) nociceptors and (ii) LTMs (results above graphs). Ih was also compared between nociceptors and LTMs for each CV group with Mann–Whitney (MW) tests (dashed lines). Significance is indicated by *P < 0.05, **P≤ 0.01, ***P≤ 0.001, ****P≤ 0.0001. For the KW test, significances shown are between the groups indicated in the post hoc Dunn's test. C, CV versus Ih; D, CV versus Ih density. C and D: vertical dotted lines indicate CV borderlines between C-, Aδ- and Aα/β-fibre neurons. Ih and Ih density were both highly correlated with CV in nociceptors (filled circles) and LTMs (open circles) and MSAs (Ih only, in C). In A–D, Ih and Ih density were highest in muscle spindle afferents (MSAs).
Figure 4. Ih half activation potential (V0.5).
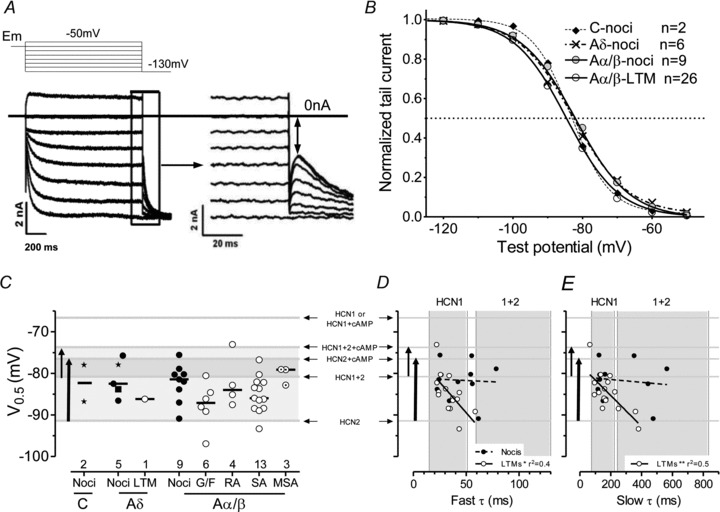
A, protocol (top) and example (lower) for activation curve plotting from hyperpolarising tail currents with (right) enlargement of the section in the rectangle. Double headed arrow illustrates where instantaneous tail currents were measured. These were normalised to the maximum tail current (after a −130 mV prepulse) and plotted against prepulse magnitudes to generate activation curves. B, activation curves (Boltzmann fits) used to determine V0.5. C, scatter plots for V0.5 for different groups of neurons. No significant differences were seen (statistical comparisons as in Fig. 2). Star symbols indicate C- and Aδ-fibre unidentified nociceptor-type neurons. For more on statistics and abbreviations see Methods and Fig. 2 legend. In C, D and E, grey lines illustrate published V0.5 values for the channels and conditions indicated, the vertical arrows indicate the published V0.5 ranges for HCN2 from no cAMP to high cAMP, and for HCN1+HCN2 heteromeric channels from no cAMP to high cAMP. Thus top of arrows indicate high cAMP. D, plot of V0.5 against fast τ. Grey lines and arrows as for C, vertical grey bands from published fast τ values as in Fig. 3. E as for D, but for slow τ values; vertical grey bands show published τ values (see Fig. 2).
In vivo Ih measurement
After AP recording and identification of sensory properties, discontinuous single electrode voltage clamp (dSEVC) was performed to record somatic Ih, after balancing the bridge, and neutralizing electrode capacitance in discontinuous current clamp (DCC) mode. Neurons were held at resting Em if this was between −50 and −60 mV; otherwise they were held at −60 mV. To elicit Ih, neurons were hyperpolarised for 1 s from holding potential in steps of −10 mV to reach −130 mV (Fig. 1A), with a 5 s interval between test pulses. Another inward current that could also be evoked by these hyperpolarizing voltage steps is the inward rectifier K+ current, but this current is unlikely to have contributed to the recorded current because the inward rectifier K+ current is a) blocked by sodium pentobarbitone (Gibbons et al. 1996), the anaesthetic used here; b) has fast, almost instantaneous activation kinetics so it will be a component of the voltage-independent leak ‘pedestal’ current and c) is found only in <15% of somata of small and large DRG neurons (Scroggs et al. 1994).
Figure 1. Ih measurement and characterisation.
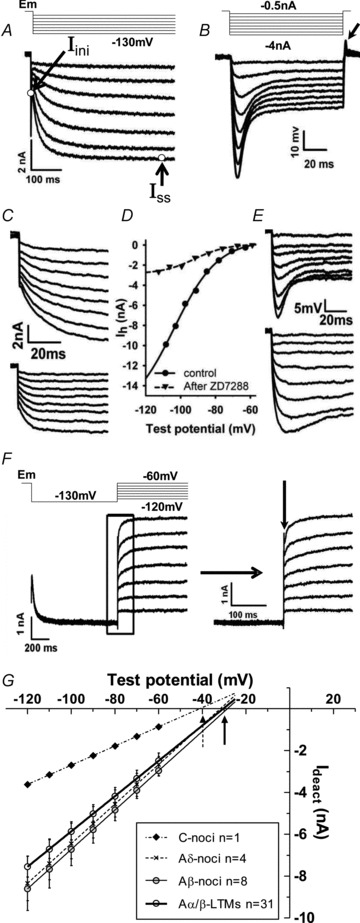
A, in voltage-clamp mode Ih in an Aα/β-HTM neuron recorded in vivo, and activated by hyperpolarisation steps from Em (−50 to −60 mV; in this case −55 mV) to −130 mV for 1 s. Open circles in the lowest Ih trace indicates the initial (Iini) and steady state (Iss) of Ih at −130 mV. Ih amplitude at −130 mV was the difference between Iss and Iini. B, in current-clamp mode, a series of hyperpolarising current injections (100 ms duration, step −0.5 nA) evoked a hyperpolarisation followed by a set of Ih-induced depolarising voltage sags. The arrow shows a rebound overshoot at the end of the current injection. C, Ih traces from an MSA before (upper) and after (lower) ∼8 min administration of ZD7288. D, Boltzmann fits for Ih traces in C; approximately 90% of Ih at −100 mV was blocked. E, in the same cell, Ih-induced depolarisation (sag) (upper) was also partially blocked by ZD7288 (lower). F, top: Vrev measurement protocol and below: example records of the deactivated Ih current (Ideact) for I–V curve plotting. Within an enlargement of the rectangle shown to the right, the vertical arrow indicates the point at which Ideact was measured to generate the I–V plot. G, I–V plots of Ideact against test potential voltages for 4 types of DRG neuron with different CV and sensory properties. Vrev is the intersection of the I–V line with the X-axis (arrows). For all neurons together (n= 44), Vrev was −31.5 ± 1.1 mV (mean ± SEM, normally distributed).
The Axoclamp 2A amplifier with X0.1L headstage had a switching frequency of 8 kHz; data were recorded by the CED 1401 at 20 kHz, and filtered at 1 kHz. Neither Ih amplitude nor Ih density differed between holding potentials of −50 and −60 mV when measured at −100 mV test potentials in six neurons (paired t test; P > 0.2, data not shown). The recorded current had the characteristics of Ih (see Biel et al. 2009); it was hyperpolarisation activated, showed a voltage sag in response to step hyperpolarising currents (time-dependent rectification), was blocked with ZD7288 (see below) and had appropriate reversal potentials (see Results).
Ih, cell capacitance and Ih density
For each testing potential an initial (instantaneous) inward current (Iini) was measured 12–15 ms after the start of each voltage command to avoid the influence of capacitative artifacts (Rodrigues & Oertel, 2006) and a steady state current (Iss: Fig. 1A) was measured when the current was fully activated, i.e. during the last 0.2 s of each 1 s voltage step. Ih was measured as in Fig. 1A.
Under DCC mode, a series of negative current injections (−0.5 to −4 nA with a step of −0.5 nA, 100 ms duration) was applied (see Fig. 1B). The input resistance (Ri) for the neuron was calculated from the injected current and the maximum change in potential. The section from 20% to 80% of the onset of the potential change was fitted by a single exponential function to yield the membrane time constant (τm). Cell capacitance (Ci) for each neuron was calculated from τm divided by Ri, and then averaged for all test currents. Ih density was calculated by dividing Ih (at −100 mV) by Ci.
The time constants for Ih activation (τ values) current traces (example in Fig. 1A) were fitted offline to determine τ values for test potentials of −100 ± 5 mV using Prism 5 (Graphpad, San Diego, CA, USA). In each case the first 500 ms after the onset of Ih was fitted with both a single and a double (least square error) exponential equation. The resulting single and double fits were compared and the best fit chosen (the null hypothesis was single exponential fit is better, P < 0.0001). In the majority of neurons (56/59), r2 was >0.95 with a significantly better fit with a double exponential. Because the temperature of our recorded neurons was 28.5–32°C (mostly 29.5–30.5°C), we adjusted fast and slow τ values using a Q10 of 3 (see below) to correct to 30°C. All patterns reported below were similar if the raw data were used, although the latter resulted in slightly more scatter.
Comparison with published τ values at −100 mV for HCN isoforms
Fast and slow τ values vary considerably with voltage and temperature. Our data are at ∼30°C, while most studies on HCN isoforms were at room temperature. We therefore derived estimates of fast and slow τ ranges at −100 mV from published data for heterologously expressed HCN channels (Ishii et al. 1999; Ulens & Tytgat, 2001; Chen et al. 2001) to compare with our 30°C data in Figs 3 and 4.
Figure 3. Ih activation fast and slow time constants (τ values).
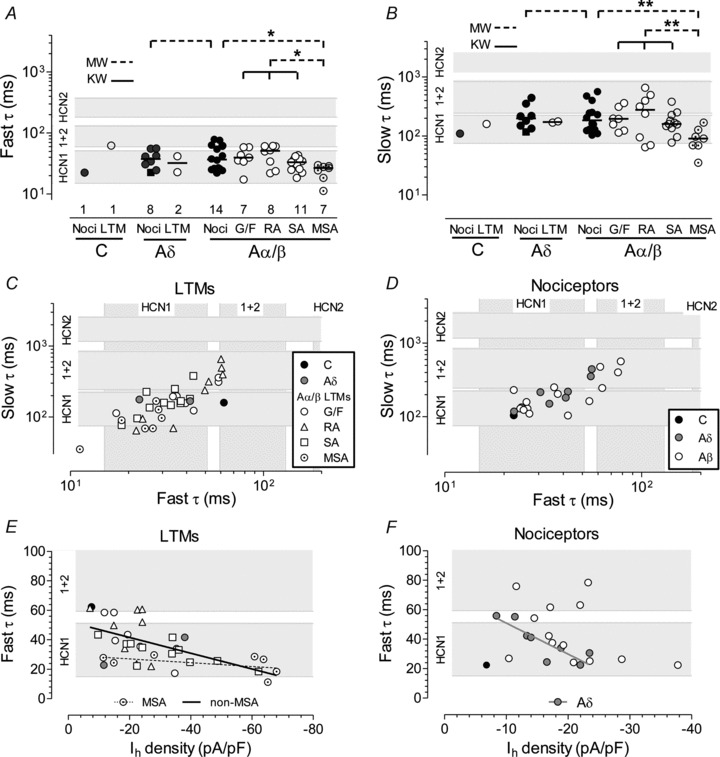
Fast and slow τ values for each neuron were obtained from the onset of each trace of Ih (see Fig. 1A), from Iini to Iss (about 0.5 s) measured at ∼−100 mV test potential at 30°C and fitted by a double exponential equation. A and B, scatterplots showing fast (A) and slow (B) τ values plotted against sensory receptor types. The grey bands shown behind the data are to enable comparison with published fast τ (A) and slow τ (B) values for heterologously expressed HCN channels measured at −100 mV, and recorded at room temperature. They include the likely ranges of expected values converted to 30°C (see Methods). Lowest grey band: HCN1; top grey band HCN2; intermediate band: HCN1+HCN2 (HCN1 co-assembled with HCN2) channels. For HCN3 and HCN4, the fast τ ranges, derived from (Ishii et al. 1999; Steiber et al. 2005) and converted to 30°C are 430–554 ms for HCN3 and ∼570 to ∼2635 ms for HCN4; they fall above the Y-axis range. The square symbol in A, B and D is an Aδ-mechanocold unit. Statistics and abbreviations as Methods and Fig. 2. In C and D, the fast τ values are plotted against the slow τ values for individual identified neurons for LTMs (C) and nociceptors (D). The grey bands indicate the ranges (derived as above) for fast and slow τ values from the X- and Y-axis respectively. C, for all LTMs the slow τ values are linearly correlated with the fast τ values (P < 0.0001, r2= 0.59) and for all cutaneous Aα/β LTM groups separately, RAs (P < 0.01, r2= 0.79), SA, G/F (P < 0.05 for all, r2= 0.44 and 0.68, respectively). D, similarly, for all nociceptors slow τ values (continued at the bottom of page 9) are linearly correlated with fast τ values (P < 0.0001, r2= 0.68) and for Aδ-nociceptors (P < 0.01, r2= 0.81), and Aα/β (P < 0.001, r2= 0.64). In A–D, τ axes are on a log scale so regression lines not shown. In E and F, symbols are as in C and D, respectively. In E, in all non-MSA LTMs there is a highly significant linear correlation between fast τ values and Ih densities (P < 0.001, r2= 0.23) while for MSAs these are not significantly correlated. In F, there is no overall correlation for all nociceptors, but Aδ-nociceptors alone do show a strong correlation (P < 0.01, r2= 0.74). Many (8/13) Aβ-nociceptors fall near the same line.
The Q10 values of 3 for Ih in large sensory neurons (Pena et al. 2006) and 4.5 in whole CNS neurons (Magee, 1998) were both used. Q10 values of 3 and 4 have also been used for Ih in transfected heterologous cells (Santoro & Tibbs, 1999). By using the range of Q10 (3–4.5) we provide a full range of likely values for both fast and slow τ values. We made the assumption that (a) activation energy is unchanged over the 20–30°C range and (b) that Ih Q10 falls between 3 and 4.5 in different neuronal groups.
Effect of ZD7288
In the last functionally identified neuron of three experiments, the effect of Ih blockade by ZD7288 was investigated. Ih and voltage sag were recorded (Fig. 1C and E), then ZD7288 (6 mg kg−1, i.v., 5 mg ml−1 in 0.9% saline i.v. at 35°C) was immediately administered, and Ih and voltage sag were recorded again ∼8 min later; both were substantially reduced see Fig. 1C–E and Results.
I–V relationship and reversal potential (Vrev)
Ih was fully activated by a prepulse to −130 mV for 1 s and then deactivated by a series of 1 s depolarization steps from −120 to −60 mV, at −10 mV increments (see Fig. 1F). The remaining Ih current immediately after the instantaneous current step in response to depolarisation (arrow Fig. 1F) was plotted against Em. Vrev was the intersection of the line with the X-axis (Fig. 1G).
Half-activation potential (V0.5)
Instantaneous tail currents (Fig. 4A) were generated by switching to −130 mV after 1 s hyperpolarising prepulses of voltages between −50 and −130 mV, at 10 mV increments (e.g. double headed arrow, Fig. 4A). They were normalized to the maximum value obtained with the −130 mV prepulse and plotted against the corresponding prepulse voltages to yield activation curves (see Fig. 4B). V0.5 values were obtained by fitting the curve with a Boltzmann equation.
Statistics
All statistical comparison of subgroups of neurons were non-parametric due to (a) small numbers per group and/or (b) data for one or more groups failing the normality test. Where all neurons are grouped together, means ± SEM are shown where these data were normally distributed. Thus comparison of medians of data in scatterplots (Figs 2–4) were with the Kruskal–Wallis test for three or more groups (continuous lines indicate groups tested), with Dunn's post hoc test between all combinations of tested groups. The Mann–Whitney test (dashed lines) was used for comparison between medians of two groups. Correlations were examined with linear regression analysis with r2 values; significant regression lines are on graphs (Figs 1G, 3E and F and 4D and E). In Fig. 3C and D, lines were not shown because these were double log plots. Non-parametric Spearman correlations (with Spearman's correlation coefficient, rs, where significant) were tested for data on Fig. 2C and D. All tests were performed with Prism 5 (GraphPad Software, La Jolla, CA, USA). Tests were two-tailed and P < 0.05 was considered statistically significant.
Results
Identification of Ih
The recorded current had the following characteristics confirming its identity as Ih: (a) it was activated by hyperpolarisation from Em (∼−50 to −60 mV), see Fig. 1A; (b) in neurons with Ih amplitude ≥−0.5 nA (at a – 100 mV test potential), responses to hyperpolarising current injection showed Ih-induced depolarisation (voltage sag: Fig. 1B); (c) for all tested neurons with Ih≥−0.5 nA, the median reversal potential (Vrev) of −31 mV, and mean V0.5 of −81 mV (described below) were similar to those previously reported for Ih in dissociated/cultured DRG neurons (Vrev−22 to −29 mV, V0.5−72 to −94 mV) (Scroggs et al. 1994; Wang et al. 1997; Yao et al. 2003; Chaplan et al. 2003; Tu et al. 2004); and (d) 8 min after administration of the Ih blocker ZD7288 (6 mg kg−1 i.v.), the current was reduced (by >80%) with suppression of the voltage sag in the two MSAs and the one Aα/β LTM SA neuron tested (Fig. 1C–E). Thus in neurons with Ih≥−0.5 nA we are confident that the current is Ih, with little or no contamination with other currents.
However, with the dSEVC method, there are higher noise levels than with whole cell patch recordings. In neurons with a measured current ≤−0.5 nA the signal to noise levels were sometimes too low to be able to exclude any contamination with currents other than Ih (see Methods). Thus, although we report currents smaller than −0.5 nA, all the more exacting analyses of Ih properties (including activation rates and V0.5) were limited to neurons with Ih≥−0.5 nA.
Ih reversal potential (Vrev)
I–V plots were generated in 44 Ih-expressing neurons (Fig. 1F and G). Vrev did not differ significantly between the A-fibre neuron groups compared. Median values were as follows: MSAs −31.7 mV, Aα/β cutaneous LTMs −30.0 mV, Aβ-nociceptors −30.0 mV, Aδ-nociceptors −36.0 mV, and the C-neuron −41.0 mV. For all neurons together, the median Vrev was −30.5 mV.
Ih expression in functionally identified DRG neurons
In 40 rats, dSEVC was performed on 117 neurons with clearly identified sensory properties. Numbers of different types of neurons are shown in Fig. 2A. Of the Aα/β-nociceptors, 11 were moderate pressure receptors, but in none of the measures in this paper did they show differences from other Aβ-nociceptors.
Ih and Ih density
Ih and Ih density (Ih/Ci expressed as pA pF−1) of DRG neurons at −100 mV (Fig. 1A, B and Methods) are plotted in Fig. 2A and B. Median Ih and Ih densities show similar distributions and similar patterns of significance between groups (Fig. 2, Table 1). Ih magnitude was at least −0.5 nA (dotted line, Fig. 2A) in 31% of C-neurons, 78% of Aδ-neurons and 97% Aα/β-neurons, consistent with reported percentages for small, medium-sized and large neurons (Tu et al. 2004). This percentage for Aα/β-neurons was significantly higher than for C-neurons (P < 0.05, χ2 test). Median Ih and Ih density were significantly greater in Aα/β-neurons than in Aδ-neurons, or all C-neurons (Fig. 2, medians in Table 1).
Table 1.
Summary for neuronal subgroups of medians values for Ih, Ih density, V0.5 and Ih activation τ values
| Ihτ values at −100 mV | ||||||||
|---|---|---|---|---|---|---|---|---|
| n | Ih (nA) | Ih density (pA pF−1) | n | V0.5 (mV) | n | fast | slow | |
| C noci | 8 | 0.26 | 5.0 | 2 | 82.4 | 1 | 22.4 | 109.9 |
| C LTM | 5 | 0.42 | 7.6 | 1 | 86.2 | 1 | 62.3 | 159.4 |
| Aδ-noci | 13 | 1.33 | 13.3 | 5 | 82.5 | 8 | 34.1 | 197.9 |
| Aδ LTM | 4 | 1.31 | 14.1 | 2 | 32.2 | 172.5 | ||
| Aβ noci | 26 | 2.57 | 20.9 | 9 | 81.5 | 14 | 36.7 | 180.3 |
| Aα/β LTMs | 61 | 2.35 | 21.3 | 26 | 84.9 | 36 | 33.9 | 156.8 |
| Aα/β cut LTM | 48 | 2.22 | 20.4 | 23 | 86 | 26 | 34.1 | 174.4 |
| Aα/β SA | 15 | 3.0 | 22.4 | 13 | 86 | 11 | 33.2 | 160 |
| Aα/β RA | 15 | 1.98 | 20.4 | 4 | 84 | 8 | 50.9 | 277 |
| Aα/β G/F | 18 | 1.98 | 17.3 | 6 | 87.1 | 7 | 39.5 | 194.6 |
| Aα/β MSA | 13 | 4.6 | 32.5 | 3 | 79.1 | 7 | 26.7 | 90.2 |
Numbers of neurons (n) relate to columns to their right. Ih was recorded at ∼30°C and ∼−100 mV.
C-nociceptor-type neurons had the lowest Ih and Ih density of any group. C-nociceptors (n= 4) had low and similar Ih and Ih density (−0.11 nA, −2.1 pA pF−1) to the C-silent units (−0.3 nA, −6.1 pA pF−1). The neuron with the highest values (−1.15 nA, −14.4 pA pF−1) was a borderline C/Aδ neuron (CV = 1.04 m s−1). The overall Ih and Ih density for all these neurons was −0.26 nA and −5 pA pF−1. Aδ-nociceptors had similar Ih and Ih density to Aδ LTMs, and intermediate between C- and Aα/β-neurons. Aα/β-nociceptors had Ih and Ih density similar to Aα/β-cutaneous LTMs. There was no significant difference in Ih magnitude or Ih density (Fig. 2A and B) between nociceptive and non-nociceptive neurons in any of the three CV groups (P > 0.1 in all cases). The median Ih magnitude in the 11 moderate pressure nociceptors did not differ from that of other Aβ-nociceptors (data not shown); they were therefore included within the Aβ-nociceptor group throughout. MSA neurons had the highest Ih and Ih density significantly greater than cutaneous Aα/β-LTMs (−4.6 nA and 32.5 pA pF−1, Fig. 2) and than all other Aα/β-neurons. MSAs also had the highest median Ih and Ih density, highly significantly greater than for all other neurons recorded (P < 0.0001 for both, Mann–Whitney test). Only one C-cooling unit was tested for Ih; it showed no Ih (0 nA) and is not included in graphs or analyses.
The low median Ih density of C-nociceptors (5 pA pF−1) was similar to that of acutely isolated small DRG neurons (3.6 pA pF−1) (Kouranova et al. 2008). Interestingly, the Ih density for Kouranova et al.'s very large (>55 μm diameter) acutely dissociated neurons (33 pA pF−1) was closer to our median value for MSAs (32.5 pA pF−1) than to that for non-MSA Aα/β LTMs (17 pA pF−1); this is consistent with some of the largest DRG neurons being MSAs (Dobretsov et al. 2003; Parekh et al. 2010).
Ih versus CV
Ih (absolute values) and Ih density were both positively correlated (Spearman's correlation) with CV in all neurons, and in both nociceptors and LTMs, as well as in subgroups of these, such as Ih in MSAs (Fig. 2C and D). MSAs (open symbols with dots) show the greatest Ih and Ih density and are some of the fastest conducting neurons (Fig. 2C and D). However, it is worth noting that in MSAs the Ih is greater than might be expected from their generally faster CVs.
This raises the question of whether Ih expression is phenotypically associated with CV in A-fibre neurons or whether Ih per se influences CV. CV depends not only on fibre diameter but also on the AP rate of rise. AP rise time was correlated with Ih magnitude in Aδ nociceptors (n= 13, rs=−0.6, P < 0.05) and Aα/β LTMs (n= 70, rs=−0.35, P < 0.01) (data not shown). Ih blockade by ZD7288 decreases total AP duration in vitro by a maximum of 10% (Tu et al. 2004). Furthermore, Hogan & Poroli (2008) showed in ZD7288 studies that Ih blockade did not alter CVs in Aδ- or Aα/β-neurons, which suggests little or no influence of Ih on CV in A-neurons.
Properties of Ih in vivo in identified neurons
Time constants of Ih activation (τ values) were measured at ∼30°C and a test potential of ∼−100 mV in 59 neurons with Ih of at least −0.5 nA. The Ih activation curve for all but three neurons was fitted significantly better (see Methods) by two exponentials providing fast and slow τ values. Numbers of neurons in each group are shown on Fig. 3A. Since most C-neurons had Ih < −0.5 nA, those included are atypical of the group. For comparison with literature, grey bands on the graphs show published values measured at −100 mV, converted to 30°C (see legend for details).
The fast τ values range from 12 to 90 ms, with a median for all 59 neurons of 34.1 ms (Fig. 3A). The slow τ values ranged from 35 to >655 ms (Fig. 3B). The only significant difference between groups of neurons was that the MSAs had a lower median τ than all other neurons, and than all non-MSA Aα/β neurons, both nociceptors and cutaneous LTMs. All these significances were P < 0.05 for fast τ values and P < 0.01 for slow τ values. For all MSAs and SAs, and for most other neurons, the fast τ values fell within the expected range for HCN1, and the rest fell within the expected range for τ values for HCN1+HCN2 (values derived from heterologously co-expressed channels, thought to form functional heteromers; see Methods). Note that the fast τ values for HCN3 and HCN4 are longer (slower) than for HCN2 (converted values in legend for Fig. 3), and thus much longer than fast τ values for any of the neurons in this study. The pattern was similar for slow τ values, but with a few more RA and A-nociceptors in the HCN1+2 range. The C-fibre nociceptor showed relatively short fast and slow τ values, but this neuron was atypical of the majority of C-nociceptors in having an Ih of ≥−0.5 nA, and thus the τ values may also be atypical.
Note that the fast τ values in this study fell within the range of fast τ values in acutely dissociated DRG neurons (Kouranova et al. 2008) and of τ values obtained at −120 mV with a single exponential fit of Ih in neurons of acutely excised DRGs (Villiere & McLachlan, 1996), in both cases converted to 30°C.
There was a strong linear correlation between the fast and slow τ values, both for LTMs (Fig. 3C) and nociceptors (Fig. 3D). For all the neuronal groups with enough values to test, there were also strong linear correlations, for Aα/β LTMs: SA, RA, G/F and for Aδ-nociceptors. Furthermore the majority of the neurons had fast and slow τ values which fell in the expected fast and slow τ range, respectively, for HCN1; similarly for some neurons both τ values fell in the expected range for HCN1+2. Thus, the slow τ showed a strong dependence on the fast τ. The slope (Δτ slow/Δτ fast) for all LTMs was 7.1 ± 1.0 and for all nociceptors was 6.2 ± 0.9. Thus slow τ values were ∼6–7 times longer than the fast τ values, Fig. 3C and D.
We next examined the fast τ in relation to Ih density for different neuronal subtypes (Fig. 3E and F). We chose the fast τ because the fast component of Ih accounts for >80% of the current at −100 mV (Chen et al. 2001) and we chose Ih density because this is independent of neuronal size. For the non-MSA units, the fast τ values showed a significant negative correlation with Ih density despite a considerable scatter of fast τ values at low Ih densities. In contrast the only LTM groups in which fast τ values were not related to Ih density was the MSAs with similar fast τ values across all Ih densities; their fast τ values were consistent with fast τ values for HCN1+HCN2 and much faster than for HCN3 or HCN4. The only LTM units with fast τ values above the range for HCN1 (and consistent with HCN1+HCN2 fast τ values) were non-MSA neurons with relatively low Ih densities. The nociceptors show a different pattern to that of the LTMs. There was no overall correlation between fast τ values and Ih density. However the fast τ values were strongly negatively correlated with Ih density for Aδ nociceptors, with larger fast τ values in neurons with relatively lower Ih densities. Although the Aβ nociceptors showed no significant correlation overall, two-thirds of them (8/13) follow a similar pattern to the Aδ neurons.
There was no correlation between τ values (fast or slow) and CV for all neurons or for all nociceptors (not shown). For all LTMs, there was a weak linear correlation (P < 0.05, r2= 0.13).
The τ plots (Fig. 3) indicate a predominance of cells with Ihτ values typical of HCN1. The wide range of τ values, with a few being higher than for HCN1, suggests that HCN2 also contributes either as HCN2 channels or as HCN1+2 channels. The −100 mV voltage used here (and typically in the literature) to measure Ih overestimates the HCN1 contribution because a higher proportion of HCN1 than of HCN2 is activated at this voltage (e.g. Chen et al. 2001). To assess whether HCN2 contributes to the Ih, we next examined the V0.5 values.
Ih half-activation potential (V0.5)
V0.5 was calculated (protocol in Fig. 4A) in 43 DRG neurons with Ih greater than −0.5 nA (thenumber of units in each group shown in Fig. 4C). The curves for different neuronal groups are very similar to each other (Fig. 4B), despite differences between published curves for heterologously expressed HCN1 and HCN2 (Santoro et al. 2000; Chen et al. 2001; Ulens & Tytgat, 2001), providing no evidence for groups of neurons in which Ih derives from only one of the two isoforms. For all neurons, V0.5 value and slope factors were −83.8 ± 0.7 mV and −7.0 ± 0.2 respectively (mean ± SEM, normally distributed; Fig. 4B). The activation curves in Fig. 4B show that ∼3–7% of Ih would be activated at an Em of −60 mV, and 2–4% at an Em of −55 mV. The neurons in this study had Em values of −63 ± 1.2 mV (mean ± SEM), so on average Ih would contribute to resting Em.
Since Ih values derived from HCN1 and HCN2 channels have rather different half-activation potential (V0.5), we examined V0.5 for different sensory subgroups. Median V0.5 values for all neuronal subgroups are shown in Table 1 and Fig. 4B. The medians did not differ significantly between neurons with different sensory properties, perhaps because of the large range of V0.5 values within the groups. Nonetheless, the medians were (non-significantly) more depolarised for the A-nociceptors and MSAs than for Aα/β cutaneous LTMs.
For comparison of these V0.5 values for these identified neurons with published values for HCN1 and HCN2, labelled grey lines have been added to show published values for HCN1, HCN2 and HCN1+HCN2, with or without added cAMP (Ulens & Tytgat, 2001) (for effects of cAMP on HCN2 see Discussion). Grey bands show (a) the range of values for HCN2 without cAMP (lower end of thick arrow) to high (forskolin-induced) cAMP (top of arrow), and (b) a similar range from low to high cAMP for HCN1+HCN2 heteromer channels (thin arrow). The darker grey band is the overlap between (a) and (b). Most (74%) Aα/β cutaneous LTM V0.5 values fell in the HCN2 band within a region associated with the presence of cAMP (Fig. 4C). Interestingly for several other groups, including Aδ and Aβ nociceptors and MSAs, the medians are close to the V0.5 values for HCN1+2. Notably, none of the V0.5 values approached that for HCN1 (Fig. 4C).
Because both τ values and V0.5 differ for different isoforms, and because cAMP shortens HCN2 τ values and depolarises HCN2 V0.5 values, plotting V0.5 against τ values may provide further information about the likely isoforms underlying Ih in the different neurons. The pattern for fast and slow τ values was remarkably similar (Fig. 4D and E). There was no correlation with V0.5 for nociceptors, while for LTMs there was a negative correlation between V0.5 and both fast and slow τ values, such that Ih with longer τ values (slower activation) had more hyperpolarised V0.5 values.
Overall, the above findings can be summarised as follows. The group (cutaneous LTMs) with not only HCN1-like but also the slower (HCN1+2-like) τ values tended more to HCN2-like V0.5 values than other groups. MSAs and nociceptors showed a trend towards HCN1-like τ values, and HCN1+2-like V0.5 values. This may suggest a greater HCN1 influence on Ih in MSAs and nociceptors and a greater HCN2 influence on Ih in Aα/β-cutaneous LTMs.
Discussion
By making intracellular recordings from DRG neurons in vivo, which allows identification of their sensory properties and CVs, we have determined the relationship of Ih and its kinetics to these properties for the first time. We found positive correlations of Ih and Ih density with CV. Our findings include (a) a similar Ih magnitude in LTMs and nociceptors with similar CVs, and thus high Ih in Aβ-nociceptors; (b) higher median Ih in MSAs than in all other neuronal subgroups; (c) Ih density and fast τ were negatively correlated for all non-MSA LTMs and Aδ nociceptors; and (d) V0.5 with fast and slow τ values were also negatively correlated with fast and slow τ values for all LTMs. Ih properties suggest which isoforms underlie Ih: generally, activation kinetics support HCN1 involvement while voltage-dependent activation suggests HCN2 contributions. Thus a combination of HCN1 and HCN2 contributions to Ih is likely.
Ih in vivo compared with in vitro
Most studies on heterologously expressed HCN isoforms underlying Ih were in vitro at room termperature; our in vivo study examines Ih in neurons in a physiologically preserved environment at 30°C. To enable comparisons with published studies we adjusted in vitro activation time constants to 30°C. The effects of anaesthetic in vivo are minimal (see Methods), supported by the present in vivo Ih magnitudes being similar to those recorded in acutely dissociated DRG neurons (Kouranova et al. 2008). However, values recorded from neurons in culture for longer than a few hours were lower, e.g. the maximum Ih density of 1.2 pA pF−1 recorded in large neurons (>42 μm diameter) 6–48 h after dissociation (Chaplan et al. 2003) was much lower than for our Aα/β-neuron median (−21 pA pF−1). This suggests a loss of Ih in large neurons in culture over time, perhaps due to a trophic factor dependence of HCN channel expression. Finally, intracellular modulation may differ in the more physiological in vivo environment.
Ih activation time constants (τ values) and V0.5
The strong linear correlations between slow and fast τ for both LTMs and nociceptors suggest that the slow τ values are the slow components of the same channels that are responsible for the fast τ values. The ranges of fast and slow τ values may thus both relate to different contributions to Ih of different channel isoforms. Because of this and because of the high contribution (>80%) of the rapidly activating component to Ih for heterologously expressed HCN1 and HCN2 channels (Chen et al. 2001), we limit the following discussion to fast τ values.
The τ values for different pure isoforms are in ascending order HCN1<HCN2<HCN3<HCN4 (Moosmang et al. 2001; Stieber et al. 2005). In the present study, Ih in most A-fibre DRG neurons had τ values consistent with published values for HCN1. In a minority of neurons the τ values fell between the HCN1 and HCN2 ranges, much closer to HCN1 values. While this may suggest a greater contribution to Ih of HCN1 than HCN2, it is also consistent with Ih resulting from co-assembly of HCN1 and HCN2 to form HCN1+HCN2 channels (Chen et al. 2001) since these have τ values between those of HCN1 and HCN2 alone, and closer to the HCN1 values (Ulens & Tytgat, 2001; Chen et al. 2001). There is a precedent in neurons for functional co-assembled HCN1+HCN2 channels (Ulens & Tytgat, 2001).
While the τ values suggest a major contribution to Ih from HCN1, the V0.5 values strongly indicate some contribution from HCN2. This is probably explained by HCN2 having a greater influence on V0.5 than on τ values, because at V0.5 HCN2 is more highly activated than HCN1. In contrast a higher proportion of HCN1 than of HCN2 is activated at −100 mV, the test voltage for the τ values. However, to explore the possible role of HCN2, we need to describe the modulatory role of cAMP on HCN2 (but not HCN1) function. cAMP acting on HCN2 increases Ih magnitude, accelerates Ih activation and shifts activation towards more depolarised potentials (Kusch et al. 2010, 2012). In co-assembled HCN1+HCN2 channels, V0.5 and cAMP-dependent depolarisation of V0.5 were intermediate between values for these two channels but closer to HCN2 values (Ulens & Tytgat, 2001; Chen et al. 2001). Importantly, cAMP is likely to be present in all neurons in vivo but its levels may vary between groups or amongst individual neurons, depending on e.g. their level of activity. Such variable cAMP levels may profoundly affect HCN2-related Ih magnitude, V0.5 and activation kinetics and may partly explain the range of values we obtained.
The V0.5 values from −91 mV to −77 mV (most Aα/β-cutaneous LTMs) are consistent with contributions from HCN2 in the presence of variable cAMP. Values of ∼−82 mV (nociceptors and MSAs) can be accounted for by HCN1+HCN2 heteromeric channels in the absence (or low) cAMP or by HCN2 with high cAMP. There are no values suggestive of HCN1 alone. This raises the question of whether HCN2 alone can account for the Ih observed or whether HCN1 is also likely to contribute. From τ values (above) it is clear that HCN1 contributes to Ih.
Functional significance of Ih
The 2–7% activation of Ih at Em (see Results) suggests some influence on resting membrane properties, but whether Ih has excitatory or inhibitory effects in sensory neurons is not shown directly by our data. However, Ih blockade reduces the number of action potentials evoked by a depolarising current pulse in Aα/β-neurons in normal whole DRGs in vitro (Hogan & Poroli, 2008). Similarly Ih blockade shows that even low Ih magnitudes (<0.5 nA) in C-neurons can be pro-excitatory in acute inflammation (Momin et al. 2008; Emery et al. 2011). Furthermore, Ih blockade decreased CFA-evoked spontaneous firing in C-nociceptors in vivo (Weng et al. 2012). The above pro-excitatory role of Ih remains to be established for different neuronal subgroups normally and in pathological pain models.
The extent of any Ih influence on excitability will depend on the Em, Ih magnitude, contributions of HCN1 and HCN2, depth of afterhyperpolarisation (AHP), and factors including cAMP levels. For example, a modest Ih at Em would increase greatly during AHPs. HCN1 V0.5 is more depolarised (−67 mV). Thus, normal AHP should activate a substantial proportion of HCN1. The proportion of HCN2 that is activated would increase with even greater AHP depth and with more cAMP, since the V0.5 for HCN2 alone (−91.4 mV) depolarises to ∼−76 mV with greater cAMP. Elevated Ih during the AHP would accelerate the repolarisation, enabling faster firing. Although the above measurements relate to soma Ih, influences of Ih on action potential initiation will depend on Em in the fibres, which is unknown.
MSAs
Their high Ih and fast τ values may aid the rapidity of AHP recovery (e.g. Fang et al. 2005), contributing to their ability to fire rapidly and/or in a sustained fashion. The MSAs having the fastest Ih activation τ values may relate to their having the fastest action potentials and AHPs of all groups.
A-Nociceptors
Although it was suggested (Chaplan et al. 2003) that Ih might contribute to pathological pain, this is the first demonstration of high Ih in A-fibre nociceptors. This may well influence their sensitivity, and thus influence the sensations associated with these neurons, including sharp pricking or stabbing pain. The high Ih we found in Aβ-nociceptors may be pro-algesic. Alteration of Ih in nociceptors in chronic or pathological pain states could have profound effects on their firing thresholds or firing rates.
Cold
Ih was implicated in cold sensation in trigeminal sensory neurons (Viana et al. 2002). Three subgroups of DRG neurons responded to cooling in the present study. Aα/β-SA units had moderately high Ih, Aδ D hair units did not have Ih higher than Aδ nociceptors, but the single Aδ mechano-cold unit had Ih that was large and fast for the Aδ group. The single C-cooling unit had undetectable Ih. More data are needed to determine whether Ih contributes to cold sensitivity in specific cooling-sensitive subgroup(s).
Control of Ih
Factors controlling Ih in sensory neurons depend on the underlying HCN isoform expression. HCN1 and HCN2 have both been reported in large diameter DRG neurons (Chaplan et al. 2003), but not in identified subpopulations of DRG neurons. Our present results suggest contributions to Ih of HCN1 and HCN2 in A-fibre neurones. Differences in HCN expression between MSAs, A-fibre nociceptors and Aα/β cutaneous LTMs could explain differences in their Ih properties.
Conclusion
The properties of Ih recorded in A-fibre neurons could not be explained either by HCN1 alone (V0.5) or by HCN2 alone (τ values). Variations in kinetics and voltage dependence suggest a greater influence of HCN2 in Aα/β-cutaneous LTMs and greater influence of HCN1 in A-fibre nociceptors and MSAs. They are also suggestive of both channels contributing to the observed Ih. Accordingly, we suggest that there are contributions of both isoforms to Ih to varying extents in all these neuronal types. The low Ih in C-nociceptors suggests little influence on these neurons normally. The intermediate Ih levels in Aδ-neurons may have intermediate effects on neuronal properties. In contrast, the very high Ih magnitudes in MSAs, and high Ih magnitudes in cutaneous LTMs and A-fibre nociceptors suggest that membrane functions of neurons in these groups may be strongly influenced by Ih.
Acknowledgments
This work was supported by the Wellcome Trust UK, LG was supported by Overseas Research Scholarship, China Scholarship Council and a postgraduate scholarship from The University of Bristol. Thanks to Dr Yuanlong Song for writing analysis scripts, to Dr Xin Fang for contribution to early experiments and to Professor Tim Biscoe for constructive comments on the manuscript.
Glossary
- AP
action potential
- CV
conduction velocity
- DRG
dorsal root ganglion
- dSEVC
discontinuous single electrode voltage clamp
- DCC
discontinuous current clamp
- F
field
- G
guard hair
- HCN
hyperpolarization-activated cyclic nucleotide-gated channel
- HTM
high threshold mechanoreceptor
- Ideac
deactivation current
- Ih
hyperpolarisation-activated current
- Iini
initial (instantaneous) inward current
- Iss
steady state current
- LTM
low threshold mechanoreceptor
- MSA
muscle spindle afferent
- NT3
neurotrophin 3
- RA
rapidly adapting
- SA
slowly adapting
Author contributions
All work was carried out at the Department of Physiology and Pharmacology, University of Bristol. Conception and design of experiments: S.N.L., L.G., A.H., S.M. and L.D. Collection, analysis and interpretation of data: L.G., S.M. and S.N.L. Drafting the article or revising it critically for important intellectual content: L.G., S.N.L., C.A., A.H. and L.D.
References
- Bader CR, Bertrand D. Effect of changes in intra- and extracellular sodium on the inward (anomalous) rectification in salamander photoreceptors. J Physiol. 1984;347:611–631. doi: 10.1113/jphysiol.1984.sp015086. [DOI] [PMC free article] [PubMed] [Google Scholar]
- Biel M, Wahl-Schott C, Michalakis S, Zong X. Hyperpolarization-activated cation channels: from genes to function. Physiol Rev. 2009;89:847–885. doi: 10.1152/physrev.00029.2008. [DOI] [PubMed] [Google Scholar]
- Cardenas CG, Mar LP, Vysokanov AV, Arnold PB, Cardenas LM, Surmeier DJ, Scroggs RS. Serotonergic modulation of hyperpolarization-activated current in acutely isolated rat dorsal root ganglion neurons. J Physiol. 1999;518:507–523. doi: 10.1111/j.1469-7793.1999.0507p.x. [DOI] [PMC free article] [PubMed] [Google Scholar]
- Chaplan SR, Guo HQ, Lee DH, Luo L, Liu C, Kuei C, Velumian AA, Butler MP, Brown SM, Dubin AE. Neuronal hyperpolarization-activated pacemaker channels drive neuropathic pain. J Neurosci. 2003;23:1169–1178. doi: 10.1523/JNEUROSCI.23-04-01169.2003. [DOI] [PMC free article] [PubMed] [Google Scholar]
- Chen S, Wang J, Siegelbaum SA. Properties of hyperpolarization-activated pacemaker current defined by coassembly of HCN1 and HCN2 subunits and basal modulation by cyclic nucleotide. J Gen Physiol. 2001;117:491–504. doi: 10.1085/jgp.117.5.491. [DOI] [PMC free article] [PubMed] [Google Scholar]
- Crepel F, Penit-Soria J. Inward rectification and low threshold calcium conductance in rat cerebellar Purkinje cells. An in vitro study. J Physiol. 1986;372:1–23. doi: 10.1113/jphysiol.1986.sp015993. [DOI] [PMC free article] [PubMed] [Google Scholar]
- DiFrancesco D, Ojeda C. Properties of the current if in the sino-atrial node of the rabbit compared with those of the current iK, in Purkinje fibres. J Physiol. 1980;308:353–367. doi: 10.1113/jphysiol.1980.sp013475. [DOI] [PMC free article] [PubMed] [Google Scholar]
- Djouhri L, Bleazard L, Lawson SN. Association of somatic action potential shape with sensory receptive properties in guinea-pig dorsal root ganglion neurones. J Physiol. 1998;513:857–872. doi: 10.1111/j.1469-7793.1998.857ba.x. [DOI] [PMC free article] [PubMed] [Google Scholar]
- Djouhri L, Fang X, Okuse K, Wood JN, Berry CM, Lawson S. The TTX-resistant sodium channel Nav1.8 (SNS/PN3): expression and correlation with membrane properties in rat nociceptive primary afferent neurons. J Physiol. 2003;550:739–752. doi: 10.1113/jphysiol.2003.042127. [DOI] [PMC free article] [PubMed] [Google Scholar]
- Djouhri L, Lawson SN. Differences in the size of the somatic action potential overshoot between nociceptive and non-nociceptive dorsal root ganglion neurones in the guinea-pig. Neuroscience. 2001;108:479–491. doi: 10.1016/s0306-4522(01)00423-7. [DOI] [PubMed] [Google Scholar]
- Djouhri L, Lawson SN. Aβ-Fiber nociceptive primary afferent neurons: a review of incidence and properties in relation to other afferent A-fiber neurons in mammals. Brain Res Brain Res Rev. 2004;46:131–145. doi: 10.1016/j.brainresrev.2004.07.015. [DOI] [PubMed] [Google Scholar]
- Doan TN, Kunze DL. Contribution of the hyperpolarization-activated current to the resting membrane potential of rat nodose sensory neurons. J Physiol. 1999;514:125–138. doi: 10.1111/j.1469-7793.1999.125af.x. [DOI] [PMC free article] [PubMed] [Google Scholar]
- Dobretsov M, Hastings SL, Sims TJ, Stimers JR, Romanovsky D. Stretch receptor-associated expression of alpha 3 isoform of the Na+,K+-ATPase in rat peripheral nervous system. Neuroscience. 2003;116:1069–1080. doi: 10.1016/s0306-4522(02)00922-3. [DOI] [PubMed] [Google Scholar]
- Emery EC, Young GT, Berrocoso EM, Chen L, McNaughton PA. HCN2 ion channels play a central role in inflammatory and neuropathic pain. Science. 2011;333:1462–1466. doi: 10.1126/science.1206243. [DOI] [PubMed] [Google Scholar]
- Fang X, Djouhri L, Black JA, Dib-Hajj SD, Waxman SG, Lawson SN. The presence and role of the tetrodotoxin-resistant sodium channel Nav1.9 (NaN) in nociceptive primary afferent neurons. J Neurosci. 2002;22:7425–7433. doi: 10.1523/JNEUROSCI.22-17-07425.2002. [DOI] [PMC free article] [PubMed] [Google Scholar]
- Fang X, Djouhri L, McMullan S, Berry C, Okuse K, Waxman SG, Lawson SN. trkA is expressed in nociceptive neurons and influences electrophysiological properties via Nav1.8 expression in rapidly conducting nociceptors. J Neurosci. 2005;25:4868–4878. doi: 10.1523/JNEUROSCI.0249-05.2005. [DOI] [PMC free article] [PubMed] [Google Scholar]
- Fang X, Djouhri L, McMullan S, Berry C, Waxman SG, Okuse K, Lawson SN. Intense isolectin-B4 binding in rat dorsal root ganglion neurons distinguishes C-fiber nociceptors with broad action potentials and high Nav1.9 expression. J Neurosci. 2006;26:7281–7292. doi: 10.1523/JNEUROSCI.1072-06.2006. [DOI] [PMC free article] [PubMed] [Google Scholar]
- Gibbons SJ, Nunez-Hernandez R, Maze G, Harrison NL. Inhibition of a fast inwardly rectifying potassium conductance by barbiturates. Anesth Analg. 1996;82:1242–1246. doi: 10.1097/00000539-199606000-00024. [DOI] [PubMed] [Google Scholar]
- Harper AA, Lawson SN. Conduction velocity is related to morphological cell type in rat dorsal root ganglion neurones. J Physiol. 1985;359:31–46. doi: 10.1113/jphysiol.1985.sp015573. [DOI] [PMC free article] [PubMed] [Google Scholar]
- Hogan QH, Poroli M. Hyperpolarization-activated current (Ih) contributes to excitability of primary sensory neurons in rats. Brain Res. 2008;1207:102–110. doi: 10.1016/j.brainres.2008.02.066. [DOI] [PMC free article] [PubMed] [Google Scholar]
- Ishii TM, Takano M, Xie LH, Noma A, Ohmori H. Molecular characterization of the hyperpolarization-activated cation channel in rabbit heart sinoatrial node. J Biol Chem. 1999;274:12835–12839. doi: 10.1074/jbc.274.18.12835. [DOI] [PubMed] [Google Scholar]
- Kouranova EV, Strassle BW, Ring RH, Bowlby MR, Vasilyev DV. Hyperpolarization-activated cyclic nucleotide-gated channel mRNA and protein expression in large versus small diameter dorsal root ganglion neurons: correlation with hyperpolarization-activated current gating. Neuroscience. 2008;153:1008–1019. doi: 10.1016/j.neuroscience.2008.03.032. [DOI] [PubMed] [Google Scholar]
- Kusch J, Biskup C, Thon S, Schulz E, Nache V, Zimmer T, Schwede F, Benndorf K. Interdependence of receptor activation and ligand binding in HCN2 pacemaker channels. Neuron. 2010;67:75–85. doi: 10.1016/j.neuron.2010.05.022. [DOI] [PubMed] [Google Scholar]
- Kusch J, Thon S, Schulz E, Biskup C, Nache V, Zimmer T, Seifert R, Schwede F, Benndorf K. How subunits cooperate in cAMP-induced activation of homotetrameric HCN2 channels. Nat. Chem. Biol. 2012;8:162–169. doi: 10.1038/nchembio.747. [DOI] [PubMed] [Google Scholar]
- Lawson SN, Crepps BA, Perl ER. Relationship of substance P to afferent characteristics of dorsal root ganglion neurones in guinea-pig. J Physiol. 1997;505:177–191. doi: 10.1111/j.1469-7793.1997.00177.x. [DOI] [PMC free article] [PubMed] [Google Scholar]
- Lawson SN. Phenotype and function of somatic primary afferent nociceptive neurones with C-, Adelta- or Aalpha/beta-fibres. Exp. Physiol. 2002;87:239–244. doi: 10.1113/eph8702350. [DOI] [PubMed] [Google Scholar]
- Maccaferri G, Mangoni M, Lazzari A, DiFrancesco D. Properties of the hyperpolarization-activated current in rat hippocampal CA1 pyramidal cells. J Neurophysiol. 1993;69:2129–2136. doi: 10.1152/jn.1993.69.6.2129. [DOI] [PubMed] [Google Scholar]
- Magee JC. Dendritic hyperpolarization-activated currents modify the integrative properties of hippocampal CA1 pyramidal neurons. J. Neurosci. 1998;18:7613–7624. doi: 10.1523/JNEUROSCI.18-19-07613.1998. [DOI] [PMC free article] [PubMed] [Google Scholar]
- Mayer ML, Westbrook GL. A voltage-clamp analysis of inward (anomalous) rectification in mouse spinal sensory ganglion neurones. J Physiol. 1983;340:19–45. doi: 10.1113/jphysiol.1983.sp014747. [DOI] [PMC free article] [PubMed] [Google Scholar]
- McCormick DA, Pape HC. Properties of a hyperpolarization-activated cation current and its role in rhythmic oscillation in thalamic relay neurones. J Physiol. 1990;431:291–318. doi: 10.1113/jphysiol.1990.sp018331. [DOI] [PMC free article] [PubMed] [Google Scholar]
- Momin A, Cadiou H, Mason A, McNaughton PA. Role of the hyperpolarization-activated current Ih in somatosensory neurons. J. Physiol. 2008;586:5911–5929. doi: 10.1113/jphysiol.2008.163154. [DOI] [PMC free article] [PubMed] [Google Scholar]
- Moosmang S, Stieber J, Zong X, Biel M, Hofmann F, Ludwig A. Cellular expression and functional characterization of four hyperpolarization-activated pacemaker channels in cardiac and neuronal tissues. Eur J Biochem. 2001;268:1646–1652. doi: 10.1046/j.1432-1327.2001.02036.x. [DOI] [PubMed] [Google Scholar]
- Parekh A, Campbell AJ, Djouhri L, Fang X, McMullan S, Berry C, Acosta C, Lawson SN. Immunostaining for the α3 isoform of the Na+/K+-ATPase is selective for functionally identified muscle spindle afferents in vivo. J Physiol. 2010;588:4131–4143. doi: 10.1113/jphysiol.2010.196386. [DOI] [PMC free article] [PubMed] [Google Scholar]
- Pena F, Amuzescu B, Neaga E, Flonta ML. Thermodynamic properties of hyperpolarization-activated current (Ih) in a subgroup of primary sensory neurons. Exp Brain Res. 2006;173:282–290. doi: 10.1007/s00221-006-0473-z. [DOI] [PubMed] [Google Scholar]
- Rodrigues AR, Oertel D. Hyperpolarization-activated currents regulate excitability in stellate cells of the mammalian ventral cochlear nucleus. J Neurophysiol. 2006;95:76–87. doi: 10.1152/jn.00624.2005. [DOI] [PubMed] [Google Scholar]
- Santoro B, Tibbs GR. The HCN gene family: molecular basis of the hyperpolarization-activated pacemaker channels. Ann NY Acad Sci. 1999;868:741–764. doi: 10.1111/j.1749-6632.1999.tb11353.x. [DOI] [PubMed] [Google Scholar]
- Santoro B, Chen S, Luthi A, Pavlidis P, Shumyatsky GP, Tibbs GR, Siegelbaum SA. Molecular and functional heterogeneity of hyperpolarization-activated pacemaker channels in the mouse CNS. J. Neurosci. 2000;20:5264–5275. doi: 10.1523/JNEUROSCI.20-14-05264.2000. [DOI] [PMC free article] [PubMed] [Google Scholar]
- Scroggs RS, Todorovic SM, Anderson EG, Fox AP. Variation in IH, IIR, and ILEAK between acutely isolated adult rat dorsal root ganglion neurons of different size. J Neurophysiol. 1994;71:271–279. doi: 10.1152/jn.1994.71.1.271. [DOI] [PubMed] [Google Scholar]
- Spain WJ, Schwindt PC, Crill WE. Anomalous rectification in neurons from cat sensorimotor cortex in vitro. J Neurophysiol. 1987;57:1555–1576. doi: 10.1152/jn.1987.57.5.1555. [DOI] [PubMed] [Google Scholar]
- Stieber J, Stockl G, Herrmann S, Hassfurth B, Hofmann F. Functional expression of the human HCN3 channel. J. Biol. Chem. 2005;280:34635–34643. doi: 10.1074/jbc.M502508200. [DOI] [PubMed] [Google Scholar]
- Takigawa T, Alzheimer C, Quasthoff S, Grafe P. A special blocker reveals the presence and function of the hyperpolarization-activated cation current IH in peripheral mammalian nerve fibres. Neuroscience. 1998;82:631–634. doi: 10.1016/s0306-4522(97)00383-7. [DOI] [PubMed] [Google Scholar]
- Tu H, Deng L, Sun Q, Yao L, Han JS, Wan Y. Hyperpolarization-activated, cyclic nucleotide-gated cation channels: roles in the differential electrophysiological properties of rat primary afferent neurons. J Neurosci Res. 2004;76:713–722. doi: 10.1002/jnr.20109. [DOI] [PubMed] [Google Scholar]
- Ulens C, Tytgat J. Functional heteromerization of HCN1 and HCN2 pacemaker channels. J Biol Chem. 2001;276:6069–6072. doi: 10.1074/jbc.C000738200. [DOI] [PubMed] [Google Scholar]
- Viana F, De LaPeña E, Belmonte C. Specificity of cold thermotransduction is determined by differential ionic channel expression. Nat Neurosci. 2002;5:254–260. doi: 10.1038/nn809. [DOI] [PubMed] [Google Scholar]
- Villiere V, McLachlan EM. Electrophysiological properties of neurons in intact rat dorsal root ganglia classified by conduction velocity and action potential duration. J Neurophysiol. 1996;76:1924–1941. doi: 10.1152/jn.1996.76.3.1924. [DOI] [PubMed] [Google Scholar]
- Wang Z, van denBerg,RJ, Ypey DL. Hyperpolarization-activated currents in the growth cone and soma of neonatal rat dorsal root ganglion neurons in culture. J. Neurophysiol. 1997;78:177–186. doi: 10.1152/jn.1997.78.1.177. [DOI] [PubMed] [Google Scholar]
- Weng X, Smith T, Sathish J, Djouhri L. Chronic inflammatory pain is associated with increased excitability and hyperpolarization-activated current (Ih) in C- but not Adelta-nociceptors. Pain. 2012;153:900–914. doi: 10.1016/j.pain.2012.01.019. [DOI] [PubMed] [Google Scholar]
- Womble MD, Moises HC. Hyperpolarization-activated currents in neurons of the rat basolateral amygdala. J Neurophysiol. 1993;70:2056–2065. doi: 10.1152/jn.1993.70.5.2056. [DOI] [PubMed] [Google Scholar]
- Yao H, Donnelly DF, Ma C, LaMotte RH. Upregulation of the hyperpolarization-activated cation current after chronic compression of the dorsal root ganglion. J Neurosci. 2003;23:2069–2074. doi: 10.1523/JNEUROSCI.23-06-02069.2003. [DOI] [PMC free article] [PubMed] [Google Scholar]