

Abstract
Despite maximal voluntary effort, the output of human motoneurone pools diminishes during fatigue. To assess motoneurone behaviour, we measured recurrent discharges evoked antidromically by supramaximal nerve stimulation after isometric maximal voluntary contractions (MVCs). They were measured as F-waves in the electromyographic activity (EMG). Supramaximal stimuli to the common peroneal and ulnar nerves evoked F-waves at rest before and after MVCs in tibialis anterior (TA) and abductor digit minimi (ADM), respectively. F-waves were depressed immediately after a sustained MVC. For TA, the size and time course of depression of the F-wave area (26 ± 13%; mean ± SD; P= 0.007) and persistence (∼20%) were similar after a 10-s or 1-min MVC. For ADM, the decline in F-wave area (39.8 ± 19.6%; P < 0.01) was similar after the two contractions but the decline in persistence (probability of occurrence) of the F-wave differed (14.6 ± 10.5% and 32.5 ± 17.1% after 10-s and 1-min MVCs respectively). Comparison of a very long (2-min) with a very short (2-s) MVC in ADM showed that the depression of F-wave area, as well as persistence, was greater after the longer contraction. This suggests, at least for ADM, that the depression is related to the duration of voluntary activity and that the decrease in F-waves could contribute to central fatigue. To examine whether changes in motor axon excitability caused the depression, we measured compound muscle action potentials (M-waves) to submaximal stimulation of the ulnar nerve after a 2-s and 2-min MVC. Submaximal M-waves were not depressed after a 2-s MVC. They were depressed by a 2-min MVC, but the time course of depression of the F- and M-waves differed. Thus, depression of F-waves does not simply reflect reduced excitability of peripheral motor axons. Hence, we propose that activity-dependent changes at the soma or the initial segment depress the recurrent discharge of human motoneurones and that this may contribute to central fatigue.
Key points
During fatiguing contractions, the output of the motoneurone pool decreases despite maximal voluntary drive. The precise mechanism for this reduction is unknown.
To assess whether changes in the intrinsic behaviour of motoneurones due to their repetitive activity during maximal voluntary contractions are responsible for the reduction of motoneurone output, we measured the recurrent motoneurone discharge produced antidromically by supramaximal stimulation of peripheral nerve. These recurrent responses are known as F-waves when measured in the EMG.
Maximal voluntary contractions strongly depressed the probability of occurrence of F-waves and their area when measured at rest after the contractions. The strength and time course of the depression increased with the duration of the contraction for the abductor digiti minimi muscle. Moreover, the observed depression of F-waves could not be explained by altered excitability of the peripheral motor axons.
Hence, we propose that the depression in F-waves is caused by activity-dependent changes at the soma or the initial segment and that this may contribute to central fatigue.
Introduction
During a sustained isometric maximal voluntary contraction (MVC), the firing rates of motoneurones decline progressively (e.g. Bigland-Ritchie et al. 1983) and ‘central’ fatigue develops (e.g. Gandevia, 2001). In addition, the response to stimulation at the cervicomedullary junction (cervicomedullary motor evoked potential, CMEP), which largely depends on the excitability of the spinal motoneurones, also declines when a maximal voluntary contraction is sustained for more than ∼1 min (Butler et al. 2003; Martin et al. 2006). In more recent studies, further evidence of impaired ‘excitability’ of spinal motoneurones was derived from changes in CMEPs during transient disfacilitation of the motoneurone pool by a prior transcranial magnetic stimulus to the motor cortex. During this transient disfacilitation, the CMEP was abolished after ∼20 s of MVC (McNeil et al. 2009, 2011). These changes in motoneurone excitability during an MVC do not appear to be due to altered input from group Ia (McNeil et al. 2011) or group III and IV muscle afferents (Martin et al. 2006). By exclusion, it has been proposed that they reflect changes in the intrinsic properties of the motoneurone. This would fit with some observations in animal preparations. When a constant current is injected into motoneurones, they fire initially at a high rate but slow with time (e.g. Kernell & Monster, 1982; Sawczuk et al. 1997). Such spike frequency adaptation may occur with repetitive firing of human motoneurones.
Various non-invasive techniques have been employed to assess the ‘excitability’ of motoneurones in humans. These include H-reflexes, CMEPs and the recurrent discharge of motoneurones (F-wave). Although H-reflexes can reveal changes in motoneurone behaviour, the size of the reflex response is greatly influenced by presynaptic inhibition of the Ia terminal (e.g. Hultborn et al. 1987; Meunier & Pierrot-Deseilligny, 1998) and activity-dependent changes in the afferent volleys (Burke & Gandevia, 1999). Thus, changes in H-reflex size do not necessarily reflect changes in the excitability of motoneurones. Unlike the H-reflex, the CMEP is not influenced by classical presynaptic inhibition (e.g. Nielsen & Petersen, 1994; Jackson et al. 2006), but it is altered by pre-motoneuronal changes presumably at the corticomotoneuronal synapse (Gandevia et al. 1999; Petersen et al. 2003). On the other hand, F-waves are produced by recurrent discharges of motoneurones following antidromic activation by supramaximal stimulation of a peripheral nerve. Studies on cat lumbosacral motoneurones indicate that only stimulated motoneurones discharge a recurrent volley (Renshaw, 1941; Lloyd, 1943) and that the site of axonal re-excitation can be the initial segment (Coombs et al. 1957a) or first node of Ranvier (Gogan et al. 1984). Thus F-waves should not depend on premotoneuronal factors but depend solely on the behaviour of motoneurones. The behaviour of F-waves has been used to track motoneurone excitability in clinical settings. F-waves increase in size and probability of occurrence (persistence) with voluntary contraction of the target muscle (McComas et al. 1970; Fox & Hitchcock, 1987; Espiritu et al. 2003; Hara et al. 2010) and they are larger and easier to elicit in spasticity (e.g. Eisen & Odusote, 1979; Bischoff et al. 1992; Milanov, 1994; Argyriou et al. 2010). Recent work has highlighted the importance of the axon initial segment (Clark et al. 2009; Grubb & Burrone, 2010; Wimmer et al. 2010; Debanne et al. 2011) and first node of Ranvier (Kole, 2011) in controlling neuronal firing properties over short and long time scales.
Prior studies give some evidence for a reduction in motoneurone excitability after repetitive firing. The mean area of F-waves decreased in the first dorsal interosseus muscle after a 10-s MVC (Giesebrecht et al. 2011) and in abductor digit minimi after a 1-min MVC (Rossi et al. 2010). However, as only one duration of contraction was used in each study, it is not clear whether the depth and duration of the depression depends on the duration of activity and thus may reflect a motoneuronal mechanism which could contribute to human muscle fatigue. Rossi and colleagues (2010) suggested that the post-contraction reduction in F-wave area and persistence and depressions of H-reflexes and responses to transcranial magnetic stimulation are all associated with the known activity-dependent hyperpolarisation of the peripheral motor axon (e.g. Schoepfle & Katholi, 1973; Bostock & Grafe, 1985; Vagg et al. 1998).
The current study was designed to determine whether the depression of F-waves after MVCs is related to the duration of motoneuronal activity. For this purpose, we examined F-waves during relaxation after different duration MVCs in an intrinsic hand muscle (abductor digit minimi, ADM) and the major dorsiflexor of the ankle (tibialis anterior, TA). We hypothesised that F-waves would show activity-dependent changes so that a longer MVC would induce a deeper and longer depression of F-waves. Furthermore, to examine whether activity-dependent changes in motor axons contribute to the depression in F-waves, we also investigated compound muscle action potentials (M-waves) produced by different intensities of ulnar nerve stimulation.
Methods
In two studies, F-waves were examined in a lower leg (tibialis anterior; study 1) and an intrinsic hand muscle (abductor digit minimi; study 2) after 10-s and 1-min maximal voluntary contractions (MVCs). Eight healthy subjects (4 male and 4 female; 31 ± 7 years; mean ± SD) participated in the study. Five of these subjects plus a further three (3 male and 5 female; 34 ± 6 years) participated in the third study which examined the F-waves in abductor digit minimi before and after a very short (2-s) and a very long (2-min) MVC. Three subjects from study 3 plus a further five participated in an additional experiment which examined M-waves after a 2-s and a 2-min MVC. Each subject gave written informed consent to the experimental procedures, and the local human research ethics committee approved the study. The study was conducted according to the Declaration of Helsinki.
Experimental set-up
In study 1, subjects sat upright in a customised chair with knee and ankle flexed at 90 deg. The right foot was strapped to an isometric myograph to record dorsiflexor torque at the ankle joint (Todd et al. 2004). In studies 2, 3 and 4, subjects sat in an adjustable chair with the right forearm and fingers rested on a table and the elbow flexed in a comfortable position. The forearm was pronated and secured by straps. The thumb rested in a midflexed position and the second to fourth fingers were secured by a strap. The little finger was placed firmly into a custom-designed finger splint with an axis of rotation about the metacarpophalangeal joint in a horizontal plane. The splint was connected to a force transducer to measure isometric finger abduction force. Surface EMG was recorded from TA and ADM using Ag/AgCl disk electrodes (6 mm in diameter) filled with conducting gel. The cathode was placed over the motor-point of each muscle and the anode 2 cm distal to the motor-point. The EMG signals were recorded in two ways. The EMG signals were amplified (×1000), band-pass filtered (200–1000 Hz; 2-pole Bessel filter; CED 1902 amplifiers, Cambridge Electronic Design, Cambridge, UK) and sampled at 5 kHz. The high-pass cutoff was set at 200 Hz so that the tail end of the maximal M-wave (Mmax) had returned to baseline by the start of the F-waves (filtered F-wave; Fig. 1B). The EMG signals were also amplified (×300), band-pass filtered (10–1000 Hz; 2-pole Butterworth filter; CED 1902 amplifiers) and sampled at 2 kHz (Fig. 1A). Force data were sampled at 1000 Hz. All signals were stored on a computer (CED 1401 Plus) and Spike2 software (v. 6.13; Cambridge Electronic Design).
Figure 1. Measurement of F-waves.
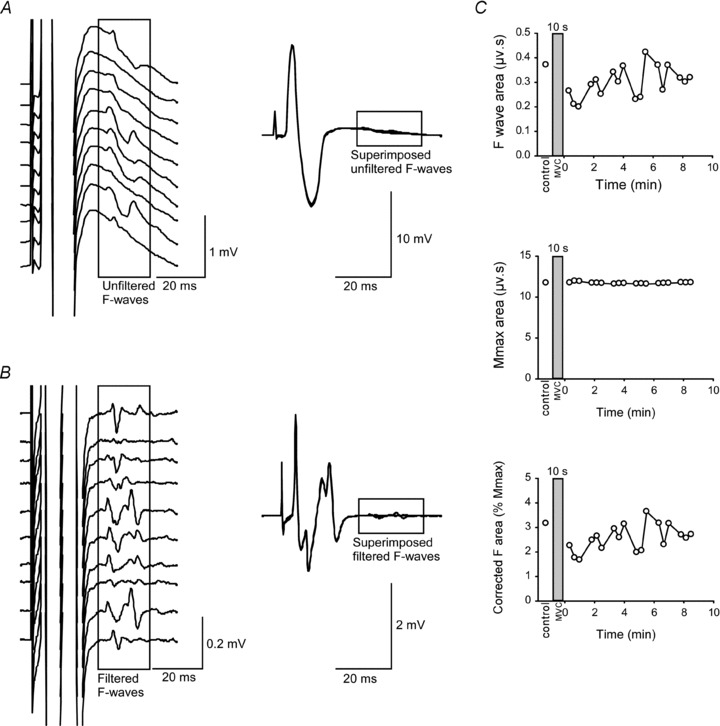
A, left panel shows a raster of 10 consecutive F-waves recorded from ADM with filtering of 10–1000 Hz (unfiltered F-waves). Right panel shows the same 10 superimposed Mmax responses and F-waves. B, left panel shows raster of the same 10 consecutive F-waves heavily high-pass filtered (200–1000 Hz; filtered F-waves). Right panel shows filtered superimposed Mmax responses and F-waves. C, top panel shows absolute area of filtered F-waves before and after a 10-s MVC in one subject. Middle panel shows absolute area of filtered Mmax and bottom panel shows corrected area of the F-wave as a percentage of Mmax. The shaded rectangle denotes a sustained MVC.
Stimulation
Common peroneal nerve stimulation
The common peroneal nerve was stimulated to evoke F-waves at rest in TA. The best location for the cathode was identified by stimulation with a hand-held electrode near the neck of the fibula. Single electrical stimuli (100 μs duration) were delivered by a Digitimer DS7AH constant current stimulator (Digitimer, Welwyn Garden City, UK) through a custom-designed bar electrode (interelectrode distance 4 cm) with the cathode over the best site and the anode anterior. With the subject at rest, the stimulus intensity was gradually increased until the compound muscle action potential (M-wave) failed to increase in peak-to-peak amplitude despite an increase in current. To maintain supramaximal stimulation despite any effect of activity-induced hyperpolarisation of the motor axons during a 10-s or 1-min MVC, the intensity of stimulation was set at 150% of the intensity that evoked Mmax (30–105 mA).
Ulnar nerve stimulation
F-waves were evoked in ADM at rest by electrical stimuli (100 μs duration) applied to the ulnar nerve. A bar electrode (interelectrode distance 4 cm) was positioned over the ulnar nerve on the ulnar side of the forearm with the cathode just proximal to the wrist joint. The size of Mmax was determined for each subject and the intensity of stimulation was set at 150% of the intensity required to produce a maximal M-wave (45–70 mA). For study 4 (see below), three separate stimulators were used and were set to evoke M-waves with an amplitude of 100%, 50% and 25% of Mmax.
Protocol
Study 1: F-waves in TA after a 10-s and a 1-min MVC
We examined F-waves in TA before and after a 10-s and a 1-min maximal voluntary contraction (MVC). The same subjects attended on two days. On the first visit, subjects performed a 10-s MVC and on the second visit, a 1-min MVC. Two control sets of F-waves, separated by 1 min, were collected prior to the MVC (10-s or 1-min MVC). After another 1-min break, subjects performed an isometric MVC of the ankle dorsiflexors. During the maximal contraction, subjects received visual feedback of their performance and were verbally encouraged. Subjects relaxed immediately after the MVC, and six post-MVC sets of F-waves, each separated by 30 s rest, were collected. For each set, subjects were given 30 supramaximal stimuli (150% Mmax) delivered at 0.5 Hz to evoke F-waves with the muscle relaxed.
Study 2: F-waves in ADM after a 10-s and a 1-min MVC
In study 2, we repeated the same protocol to examine whether similar changes occur in F-waves in ADM after a 10-s and a 1-min MVC. The same subjects as in study 1 (n= 8) attended on two more days. F-waves were evoked in ADM at rest by supramaximal electrical stimuli (150% Mmax) to the ulnar nerve given in sets of 30 at 0.5 Hz. Two control sets prior to maximal abduction of the little finger and six post-MVC sets were collected for each subject.
Study 3: F-waves in ADM after a 2-s and a 2-min MVC
Because a 10-s and a 1-min MVC revealed similar activity-dependent changes in F-waves (see Results), we further examined the F-waves in the ADM muscle after a very short (2-s) and a very long (2-min) MVC. Five subjects from studies 1 and 2 plus a further three attended on one day. Using the same protocol as study 2, F-waves were collected before and after a 2-s MVC of ADM. After a rest of 10 min, the protocol was repeated with a 2-min MVC.
Study 4: M-waves in ADM after a 2-s and 2-min MVC
To examine whether activity-dependent changes in the excitability of motor axons contribute to the depression of F-waves, we investigated M-waves, the direct muscle response to electrical stimulation of the motor axons, in ADM after a very short (2-s) and a very long (2-min) MVC. Three subjects from study 3 plus a further five attended on one day. Electrical stimuli (100 μs duration) at intensities set to evoke 100%, 50% and 25% Mmax were delivered in order at 2 s intervals over the ulnar nerve to evoke M-waves in ADM at rest before and after a sustained MVC. Using the same protocol as study 3, M-waves were collected in sets of 30 (10 of each size) before and after a 2-s MVC of ADM and then after a 10 min rest, before and after a 2-min MVC.
Data analysis and statistics
All measurements were made offline using Signal software (v. 3.05; Cambridge Electronic Design). To measure the area and peak-to-peak amplitude of F-waves, responses to 30 supramaximal stimuli were overdrawn on the screen at high gain and the cursors were set at the beginning and the end of the responses that showed a clear deflection from the baseline. M-waves elicited by supramaximal (studies 1, 2 and 3), maximal and submaximal stimuli (study 4; 100, 50 and 25% Mmax) were superimposed, and both the area and peak-to-peak amplitude were measured between cursors that encompassed the evoked responses. Root mean square EMG was calculated over 50 ms immediately before each stimulus. The area and peak-to-peak amplitude of F-waves measured from the heavily filtered EMG showed similar results and area is reported throughout the text. Because of activity-dependent changes in muscle fibre action potentials during maximal efforts, the area of each F-wave was normalised to the area of the corresponding Mmax (also heavily filtered) and then expressed as a percentage of mean control values (mean of control set 1 and 2) obtained prior to the MVC (Fig. 1C) (Taylor et al. 1999). For each subject, the mean area of the 30 F-waves in each set were used for statistical analysis. To illustrate in more detail the time course of changes, figures show the F-wave area averaged for each 10 consecutive stimuli (Espiritu et al. 2003). In addition, as F-waves are not seen after every supramaximal stimulus, we measured the number of F-waves which occurred with each set of 30 consecutive stimuli for both TA and ADM. This value was expressed as a percentage. This measure of the probability of the occurrence of F-waves is known as persistence. Assessment based on 30 trials can be considered sufficient (review Panayiotopoulos & Chroni, 1996). We identified an F-wave as present if a response with an appropriate latency (minimum of 20 ms and 30 ms for ADM and TA, respectively) had an amplitude ≥20 μV.
For studies 1, 2 and 3, F-wave area was analysed with two-way repeated measures analyses of variance (ANOVA) with factors of contraction duration and time. Whenever the ANOVA showed a significant main effect of time or contraction or a significant interaction, post hoc Student–Newman–Keuls tests were used to identify differences between the control and subsequent time points or between contractions. Because data for F-wave persistence were not normally distributed, we rank-transformed the data and performed a two-way parametric repeated measures ANOVA for comparison of contraction duration and time. A post hoc Student–Newman–Keuls test was used to identify differences between the control and subsequent time points or between contractions. For study 4, M-wave area was analysed using one-way repeated measures ANOVA to assess the main effects for time at the three stimulus intensities (100%, 50% and 25% Mmax). These were followed by a post hoc Dunnett's test. When the assumption of sphericity was violated, the P values were corrected using the Greenhouse–Geisser corrections. Data are represented as means ± SD in the text and means ± SEM in the figures. Statistical significance was set at P < 0.05.
Results
Study 1: F-waves at rest after a 10-s and a 1-min MVC in TA
F-waves were evoked in the relaxed TA muscle before and after a 10-s and a 1-min MVC. Figure 2A shows superimposed raw traces for a single subject for both durations of contraction. F-wave area decreased significantly with time (F6,42= 3.492, P= 0.007) but the depression was similar after the two contractions (F1,7= 0.079, P= 0.787), and there was no significant interaction (F6,42= 0.332, P= 0.916) (Fig. 2B). Post hoc testing showed that the depression of 26 ± 13% of the initial control values was significant (P= 0.007) for the first minute after contraction. F-wave persistence was calculated for each set of 30 consecutive stimuli. Baseline F-wave persistence in TA was reproducible in the two sets of 30 stimuli delivered prior to each contraction, and on the two days (72.0–74.5%; Fig. 2C). F-wave persistence declined by 21.9 ± 15.4% and 19.8 ± 21.8% after a 10-s and a 1-min MVC, respectively (Fig. 2C). Two-way ANOVA showed a significant effect of time (F6,42 =5.44, P < 0.001) but no effect for contraction (F1,7= 0.29, P= 0.61) and no significant interaction (F6,42 =0.248, P= 0.96) (Fig. 2C).
Figure 2. F-waves in tibialis anterior (TA) after MVCs of 10 s and 1 min duration.
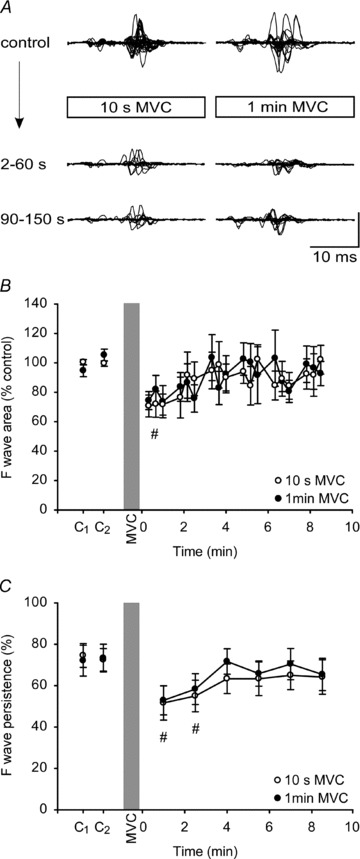
A, F-waves recorded from TA at rest before and after a 10-s (left) and a 1-min (right) sustained MVC for a single subject. In each panel, top traces represent one set of F-waves recorded before the MVC and are shown superimposed. Lower traces show superimposed responses for the first and second sets after the MVC. Each set consisted of 30 F-waves. Vertical calibration: 0.2 mV. B, group data (n= 8; means ± SEM) showing changes in the area of F-waves after a 10-s (open circles) and a 1-min sustained MVC (filled circles). In this and subsequent figures, F-wave area was corrected to the respective Mmax response and then normalised to the mean value of the control sets. For illustration, each circle represents the average area of 10 consecutive F-waves from each subject. For statistical tests, F-waves were grouped into sets of 30. C, group data showing F-wave persistence in the relaxed muscle before and after a 10-s (open circle) and a 1-min (filled circle) MVC. The persistence was calculated from a set of 30 consecutive stimuli. The shaded vertical bar denotes the sustained MVC. There was an overall effect of time on F-wave area and persistence and the hash (#) indicates sets of F-waves for which values are significantly lower than the combined baseline values (P < 0.05; see Results)
Study 2: F-waves at rest after a 10-s and a 1-min MVC in ADM
In study 2, we examined F-waves in ADM after a 10-s and a 1-min MVC to see whether F-waves showed similar changes in an intrinsic hand muscle after contraction. Superimposed F-waves before and after the MVCs from a typical subject are shown in Fig. 3A. As in study 1, significant depression of the F-wave occurred with time (F6,42= 9.826, P < 0.001), but the depression was similar after a 10-s and a 1-min MVC (F1,7= 1.967, P= 0.204) and there was no significant interaction (F6,42= 1.552, P= 0.185) (Fig. 3B). The initial reduction in F-wave area was 39.8 ± 19.6% of the control value, and the depression lasted for ∼6 min (P < 0.01) (Fig. 3B). F-wave persistence was high and reproducible in ADM (baseline persistence between 96.3 and 98.3% for each set of 30 stimuli; Fig. 3C). Two-way ANOVA showed a significant effect for contraction duration (F1,7 =9.91, P= 0.016), and time (F6,42 =13.81, P < 0.001), and an interaction (F6,42 =5.85, P < 0.001). After a 10-s MVC, post hoc tests showed that F-wave persistence declined by 14.6 ± 10.5% and remained significantly decreased for 1 min compared to the mean baseline values (P= 0.002; Fig. 3C). After a 1-min MVC, persistence decreased by 32.5 ± 17.1% and remained reduced for 3 min (P= 0.02; Fig. 3C). Comparison between the contractions showed persistence was more depressed after the 1-min MVC than the 10-s MVC for the first 3 min after contraction (Student–Newman–Keuls; P < 0.002).
Figure 3. F-waves in abductor digit minimi (ADM) after MVCs of 10 s and 1 min duration.
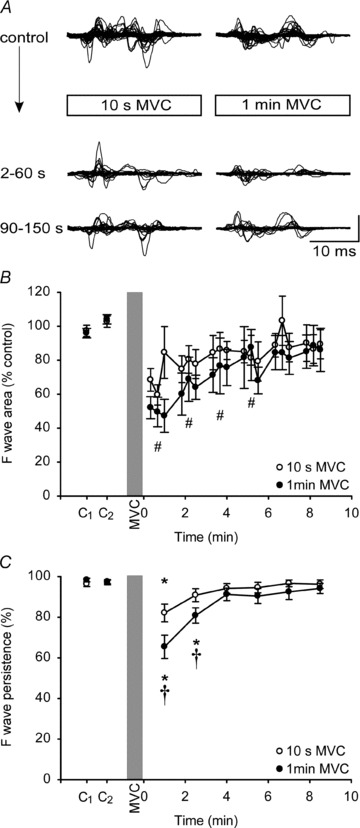
A, F-waves recorded from ADM at rest before and after a 10-s (left) and a 1-min (right) sustained MVC for a single subject. In each panel, top traces represent F-waves recorded before the MVC and are shown superimposed. Lower traces show superimposed responses for the first and second sets after the MVC. Each set consisted of 30 F-waves. Vertical calibration: 0.2 mV. B, group data (n= 8; means ± SEM) showing changes in the area of F-waves after a 10-s (open circles) and a 1-min sustained MVC (filled circles). For illustration, each circle represents the average area of 10 consecutive F-waves from each subject. For statistical tests, F-waves were grouped into sets of 30. There was an overall effect of time on F-wave area and the hash (#) indicates sets that are significantly lower than the combined baseline values (P < 0.05). C, group data showing F-wave persistence in the relaxed muscle before and after a 10-s (open circle) and a 1-min (filled circle) MVC. F-wave persistence decresed (by 14.6 ± 10.5% and 32.5 ± 17.1% after 10-s and 1-min MVCs, respectively). The asterisks (*) indicate data points that are significantly lower than the baseline values for each contraction (P < 0.05).The daggers (†) indicate differences between contractions at specific times (P < 0.002).
Study 3: F-waves at rest after a 2-s and a 2-min MVC in ADM
F-waves were examined during relaxation after a very short, 2-s MVC, and a very long, 2-min MVC. Depression of the area of the F-waves was more prolonged after the 2-min MVC as shown for a typical subject in Fig. 4A. Unlike studies 1 and 2, F-wave area showed a significant effect for contraction duration (F1,7 =12.1, P= 0.01), and time (F6,42 =8.852, P < 0.001), and an interaction (F6,42 =4.073, P= 0.003). Post hoc tests showed that F-wave area compared to the control value was depressed significantly for the first minute after a 2-s MVC (P= 0.005). In this period, F-wave area was reduced by 26.6 ± 17.6% of control value. After a 2-min MVC, depression of F-wave area over the first minute was more pronounced (by 48.2 ± 19.9%), and the responses remained depressed for a further ∼9 min (P < 0.045; Fig. 4B). Comparison of corresponding time points between the contractions revealed differences at 2–8 min (Student–Newman–Keuls; P < 0.016; Fig. 4B). As in study 2, the persistence of the F-wave was high and reproducible prior to contractions (Fig. 4C). Two-way ANOVA showed a significant effect of contraction duration (F1,7 =12.502, P= 0.01), and time (F6,42 =16.01, P < 0.001), and an interaction (F6,42= 2.785, P= 0.023). F-wave persistence declined by 17.7 ± 13.3% of control after a 2-s MVC and on post hoc testing remained significantly decreased for 1 min (P < 0.001; Fig. 4C). After a 2-min MVC, persistence decreased by 34.6 ± 18.0% and remained significantly reduced for 8 min (P < 0.046; Fig. 4C). Comparison of corresponding time points of the two contractions showed significant differences from immediately after the MVCs to ∼4 min and at 7 min post-contraction (Student–Newman–Keuls; P < 0.03).
Figure 4. F-waves in ADM after MVCs of 2 s and 2 min duration.
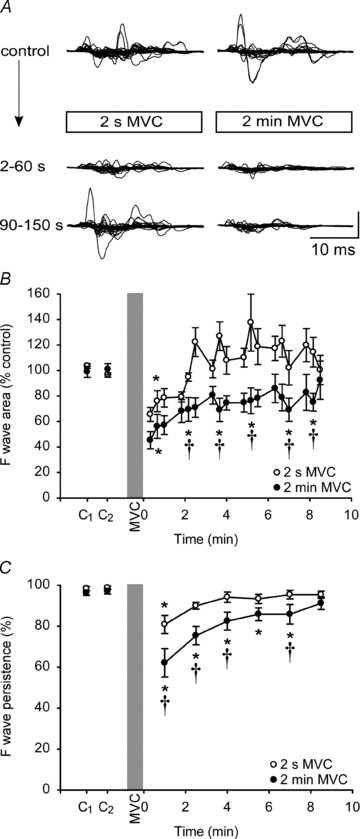
A, F-waves recorded from ADM at rest before and after a 2-s (left) and a 2-min (right) sustained MVC for a single subject. In each panel, top traces represent F-waves recorded before the MVC and are shown superimposed. Lower traces show superimposed responses for the first and second sets after the MVC. Each set consisted of 30 F-waves. Vertical calibration: 0.2 mV. B, group data (n= 8; means ± SEM) showing changes in the area of F-waves after a 2-s (open circles) and a 2-min sustained MVC (filled circles). For illustration, each circle represents the average area of 10 consecutive
Study 4: M-waves at rest after a 2-s and a 2-min MVC in ADM
This study investigated whether changes in motor axonal excitability during a sustained MVC contribute to the observed depression in F-wave area. When examined at rest after a 2-s MVC, submaximal M-waves evoked by ulnar nerve stimulation behaved differently from F-waves. The area of the M-wave evoked by the previously defined maximal stimulus intensity increased by 4.9 ± 2.74% of control after a 2-s MVC (F1.5,10.7= 6.8, P= 0.02) and remained elevated for another ∼6 min (P < 0.01; Fig. 5A). However, M-waves did not show significant changes after a 2-s MVC when examined at two submaximal stimulus intensities to produce 50% Mmax (F1.6,11.2= 1.55, P= 0.25) and 25% Mmax (F1.9,13.2= 1.51, P= 0.26) (Fig. 5A). After a 2-min MVC, maximal M-wave area increased by 22.81 ± 19.97% of control (F1.5,10.2= 0.03; Fig. 5B) and on post hoc testing remained significantly elevated for 1 min (P= 0.013). In contrast, when tested at submaximal intensities, M-waves were significantly depressed by ∼50% of control for the first minute after a 2-min MVC (F2.2,15.6= 3.96, P= 0.03 and F1.5,10.4= 2.42, P= 0.043 for 50 and 25% Mmax, respectively).
Figure 5. Maximal and submaximal M-waves in ADM after MVCs of 2 s and 2 min duration.
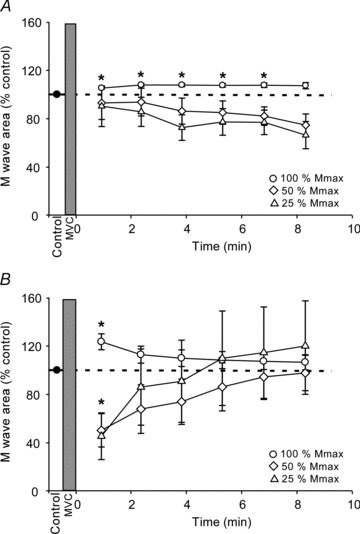
Pooled data (n= 8; means ± SEM) showing changes in the area of M-waves in ADM at rest after a 2-s (A) and a 2-min (B) sustained MVC. Electrical stimuli were delivered in sequence to the ulnar nerve at regular intervals to evoke M-waves of 100% (circles), 50% (diamonds) and 25% (triangles) of Mmax in ADM. Each data point represents the average area of 10 M-waves. M-wave area was normalised to the mean value of the control sets. The dotted line represents the mean value of the control sets before MVC. The shaded vertical bar denotes the MVC. Asterisks (*) indicate significant changes from the baseline values for each contraction (P < 0.05).
Discussion
This study provides the first evidence that volitional activity produces a graded reduction in the susceptibility of human motoneurones to discharge a recurrent action potential. When measured at rest immediately after a sustained MVC, the mean area and probability of occurrence of F-waves (F persistence) are decreased in both ADM and TA. When F-waves in ADM were examined after a very short, 2-s MVC and a very long, 2-min MVC, the magnitude and time course of the depression of mean area and persistence were significantly greater after the longer contraction. Although the depression of area was similar after a 10-s or a 1-min MVC, for ADM the reduction in persistence of the F-wave was greater after the longer contraction. These differences suggest that, at least for ADM, the depression of the F-wave, which is seen as a decrease in persistence and mean area, is related to the duration of the voluntary activity and that it may represent a decrease in motoneuronal excitability which could contribute to fatigue. In contrast, for TA, a relationship between the depression of the F-wave after an MVC and the duration of activity is not clear. Submaximal M-waves evoked in ADM were also depressed by a 2-min MVC but not by a 2-s MVC. The different time course for development of F-wave and M-wave depression combined with the supramaximal stimuli used to evoke F-waves suggest that sites other than the site of stimulation are responsible for the observed depression of F-waves after an MVC.
F-waves were first described in humans by Magladery & McDougal (1950). When a supramaximal electrical stimulus is applied to a motor nerve, impulses propagate in both directions, orthodromically towards the muscle and antidromically towards the cell bodies of the motoneurones. Antidromic excitation causes backfiring of a proportion of motoneurones (e.g. Renshaw, 1941; Lloyd, 1943), and the subsequent orthodromic potentials which can be recorded from a target muscle are known as F-waves (e.g. Dawson & Merton, 1956; Thorne, 1965; Mayer & Feldman, 1967). There are a number of potential sites at which alterations in function might decrease the size and/or persistence of F-waves after an MVC. First, F-waves will decrease if the same electrical stimulus activates a smaller number of axons at the site of stimulation after activity. Second, changes at the axon initial segment (or first node of Ranvier) might contribute to the decrease in F-waves either by blocking the antidromic potential due to local hyperpolarisation or by blocking the recurrent orthodromic potential (i.e. recurrent wave) and re-depolarisation of the axon. Finally, altered motoneuronal excitability at the soma might contribute to the observed decrease in F-waves after activity. In each of these cases, decreases in area and persistence of the F-wave would both reflect a reduction in the average number of motoneurones that generated recurrent potentials in response to each stimulus. In the following sections, we will discuss these possibilities.
A reduction in the number of axons activated by stimulation after activity is unlikely in the current study. We used supramaximal stimulation (150% of the intensity to elicit Mmax) to evoke F-waves to overcome any activity-dependent changes in axonal excitability at the site of stimulation, and our results show that maximal M-waves were not depressed after the sustained maximal contraction (Fig. 5A and B). However, there are known changes in axonal threshold with voluntary activity (e.g. Vagg et al. 1998) and such changes were confirmed here by the depression of submaximal M-waves (Fig. 5A and B). Although the changes in the current study were not as long lasting as those described for the median-innervated thenar muscles (Vagg et al. 1998), various differences in excitability parameters between motor axons in the ulnar and median nerves have been reported (Bae et al. 2009; Murray & Jankelowitz, 2011). The changes in axonal threshold reflect activity-dependent hyperpolarisation of the peripheral motor axons as a consequence of activation of the electrogenic Na+–K+ pump (e.g. Schoepfle & Katholi, 1973; Bostock & Grafe, 1985). The hyperpolarisation usually has little effect on normal action potential propagation, with only a small slowing of conduction velocity, except at regions where the safety margin for conduction is low (e.g. Kuwabara et al. 2002; Noto et al. 2011). However, in demyelinated axons, activity can cause conduction block (Bostock & Grafe, 1985; Cappelen-Smith et al. 2000). For antidromic action potentials, the junction of the myelinated axon with the unmyelinated axon initial segment is a region of low safety margin (Coombs et al. 1957a) so that axonal activity-dependent hyperpolarisation might depress F-waves by block at this site. However, in the present study, the changes in submaximal M-waves did not match the time course of the depression of F-wave area as there was no apparent depression of axonal excitability with a 2-s MVC. This mismatch suggests that the F-wave depression is not simply the result of the same activity-dependent changes which occur in the peripheral motor axons, although a similar mechanism affecting the axon initial segment with a different time course cannot be ruled out.
Action potentials are initiated and modulated at the axon initial segment and their rapid propagation occurs along the axon via the nodes of Ranvier in myelinated axons (e.g. Araki & Otani, 1955; Coombs et al. 1957b; Kole & Stuart, 2008; Clark et al. 2009; Kress & Mennerick, 2009). The axon initial segment and the nodes of Ranvier of the motor axon are distinct specialised axonal domains and their complement and distribution of channels differ. The axon initial segment is enriched with voltage-gated sodium (Nav1.1, Nav1.2, Nav1.6), potassium (Kv1.1, Kv1.2) and calcium (Cav2.1, Cav2.2, Cav3) channels (Westenbroek et al. 1989; Van Wart et al. 2007; Duflocq et al. 2008, 2011; Lorincz & Nusser, 2008; Ogawa & Rasband, 2008; Bender & Trussell, 2009; Hu et al. 2009; Debanne et al. 2011), whereas Nav1.6 is the major sodium channel at mature nodes of Ranvier (Caldwell et al. 2000; Boiko et al. 2001). Moreover, there is a differential distribution of sodium and potassium channels within the initial segment. Nav1.6, Kv1.1 and Kv1.2 are predominantly localised distally at the likely site of action potential generation, with Nav1.2 and Nav1.1 in the proximal part of the initial segment (Boiko et al. 2003; Inda et al. 2006; Van Wart et al. 2007; Hu et al. 2009; Duflocq et al. 2011). Nav1.6 channels have a low threshold and contribute to action potential initiation, while the proximal Nav1.2 channels have a higher threshold and promote back-propagation (Hu et al. 2009). Furthermore, calcium influx produced by activity at the axon initial segment is also likely to affect spike initiation (Bender & Trussell, 2009). Because of the different distribution of ion channels in the initial segment and the nodes, it is likely that these regions respond differently to repetitive activity. However, no studies have yet investigated the excitability of the axon initial segment during repetitive firing in motoneurones. Therefore, it is not possible to speculate further on whether the depression of F-waves after as little as 2 s of voluntary activity represents altered function of this important region.
In humans, findings such as the depression of cervicomedullary motor evoked potentials (CMEPs) during a sustained MVC suggest a decrease in motoneurone excitability with contractions of ∼10 s (McNeil et al. 2009, 2011). However, there is no evidence in humans for depression of motoneurone excitability after only 2 s of contraction. In animals, repetitive activation has been shown to reduce the responsiveness of motoneurones. During sustained activation of motoneurones by intracellular or extracellular stimulation, many cells which initially fired repetitively stop firing or reduce their firing rate (Kernell & Monster, 1982; Spielmann et al. 1993; Sawczuk et al. 1997; see also Peters & Fuglevand, 1999). This spike frequency adaptation has early and late phases. It can continue throughout the duration of firing which may be several minutes and is more prominent in the larger more fatigable motor units (Kernell & Monster, 1982; Spielmann et al. 1993). Motoneurones recover within 1–2 min after the cessation of stimulation. The first few hundred milliseconds of this process reflects slow inactivation of sodium channels, while the mechanism of late adaptation remains uncertain (Miles et al. 2005; Brownstone, 2006). Thus, depression of F-waves after a sustained maximal contraction may be due to decreased excitability of the motoneurones, which makes the soma harder to excite through antidromic invasion.
Although F-wave area and persistence were reduced after 10-s and 60-s MVCs in both the intrinsic hand muscle (ADM) and in the ankle dorsiflexor muscle (TA), the depression was somewhat different in the two muscles. In TA, depression of both area and persistenceof F-wave were identical after the two contractions, whereas in ADM, persistence differed significantly although area did not. Thus, while it seems likely that the depression of the F-wave in TA and ADM after MVCs occur through similar activity-dependent mechanisms, the change in the F-wave in TA was not altered by a sixfold increase in duration of activity whereas that in ADM was. We can only speculate that this difference represents a difference in the properties of the motoneurones in the two pools. Differences in the behaviour of responses to corticospinal tract stimulation after MVCs has been reported for TA compared to another intrinsic hand muscle (first dorsal interosseous; Giesebrecht et al. 2011) as have differences in activity-dependent hyperpolarisation of the motor axons in the peroneal (lower limb) and median (upper limb) nerves (Kuwabara et al. 2002).
Although the depression of F-waves provides evidence of changes intrinsic to the motoneurones following repetitive voluntary activity, the functional significance of the finding is not clear. It may depend on the precise site of impairment. If the F-wave depression reflects decreased excitability primarily at the soma, then the motoneurones would also have reduced responses to synaptic input, i.e. their gain is reduced. This is consistent with the view that human motoneurones require progressively increasing synaptic drive to maintain a constant firing rate in a sustained voluntary contraction (Johnson et al. 2004). If the axon initial segment is altered, then the mechanism could affect action potential initiation, which could also alter the input–output function of the motoneurones. Alternatively change at the axon initial segment may only affect antidromic action potentials with no impairment of orthodromic potentials. Such a change could still affect physiologically back-propagating action potentials, which could influence overall excitability as well as synaptic efficacy of the motoneurones. As the first node of Ranvier is important for high-frequency bursts in some neurones (Kole, 2011) a decrease in generation or transmission of recurrent potentials may affect the generation of doublets. However, the role of the first node is not clear in motoneurones. There are instances in which the firing rate of the motoneurone soma does not match that of the axon (see Gogan et al. 1984)
In summary, we found a strong depression of F-waves at rest after brief and sustained maximal voluntary contractions. The magnitude and the time course of the depression depended on the duration of the activity for ADM muscle, which suggests that the reduction of F-waves could be associated with the central fatigue accompanying voluntary exercise. The changes in F-waves cannot simply be explained by altered excitability of the peripheral motor axons. Thus, we propose that activity-dependent changes intrinsic to the motoneurones, occurring at the axon initial segment or soma, are responsible for the depression. If these changes affect the gain of the motoneurone pool, then our results highlight the need for compensation by descending and reflex inputs in order to maintain motoneuronal output.
Acknowledgments
This work was supported by the National Health and Medical Research Council of Australia.
Glossary
- ADM
abductor digit minimi
- CMEP
cervicomedullary motor evoked potential
- EMG
electromyographic activity
- Mmax
maximal compound muscle action potential
- MEP
motor evoked potential
- MVC
maximal voluntary contraction
- TA
tibialis anterior
Note added in proof
Similar changes in F waves with voluntary activity have been reported by Rossi et al. Rossi A, Rossi S & Ginanneschi F. (2012). Activity dependent changes in intrinsic excitability of human spinal motoneurones produced by natural activity. J Neurophysiol (in press).
Author contributions
All authors contributed to all aspect of the study and all approved the final version of the manuscript. All experiments were performed at Neuroscience Research Australia in Sydney, Australia.
References
- Araki T, Otani T. Response of single motoneurons to direct stimulation in toad's spinal cord. J Neurophysiol. 1955;18:472–485. doi: 10.1152/jn.1955.18.5.472. [DOI] [PubMed] [Google Scholar]
- Argyriou AA, Karanasios P, Makridou A, Makris N. F-wave characteristics as surrogate markers of spasticity in patients with secondary progressive multiple sclerosis. J Clin Neurophysiol. 2010;27:120–125. doi: 10.1097/WNP.0b013e3181d64c94. [DOI] [PubMed] [Google Scholar]
- Bae JS, Sawai S, Misawa S, Kanai K, Isose S, Kuwabara S. Differences in excitability properties of FDI and ADM motor axons. Muscle Nerve. 2009;39:350–354. doi: 10.1002/mus.21107. [DOI] [PubMed] [Google Scholar]
- Bender KJ, Trussell LO. Axon initial segment Ca2+ channels influence action potential generation and timing. Neuron. 2009;61:259–271. doi: 10.1016/j.neuron.2008.12.004. [DOI] [PMC free article] [PubMed] [Google Scholar]
- Bigland-Ritchie B, Johansson R, Lippold OC, Smith S, Woods JJ. Changes in motoneurone firing rates during sustained maximal voluntary contractions. J Physiol. 1983;340:335–346. doi: 10.1113/jphysiol.1983.sp014765. [DOI] [PMC free article] [PubMed] [Google Scholar]
- Bischoff C, Schoenle PW, Conrad B. Increased F-wave duration in patients with spasticity. Electromyogr Clin Neurophysiol. 1992;32:449–453. [PubMed] [Google Scholar]
- Boiko T, Rasband MN, Levinson SR, Caldwell JH, Mandel G, Trimmer JS, Matthews G. Compact myelin dictates the differential targeting of two sodium channel isoforms in the same axon. Neuron. 2001;30:91–104. doi: 10.1016/s0896-6273(01)00265-3. [DOI] [PubMed] [Google Scholar]
- Boiko T, Van Wart A, Caldwell JH, Levinson SR, Trimmer JS, Matthews G. Functional specialization of the axon initial segment by isoform-specific sodium channel targeting. J Neurosci. 2003;23:2306–2313. doi: 10.1523/JNEUROSCI.23-06-02306.2003. [DOI] [PMC free article] [PubMed] [Google Scholar]
- Bostock H, Grafe P. Activity-dependent excitability changes in normal and demyelinated rat spinal root axons. J Physiol. 1985;365:239–257. doi: 10.1113/jphysiol.1985.sp015769. [DOI] [PMC free article] [PubMed] [Google Scholar]
- Brownstone RM. Beginning at the end: repetitive firing properties in the final common pathway. Prog Neurobiol. 2006;78:156–172. doi: 10.1016/j.pneurobio.2006.04.002. [DOI] [PMC free article] [PubMed] [Google Scholar]
- Burke D, Gandevia SC. Properties of human peripheral nerves: implications for studies of human motor control. Prog Brain Res. 1999;123:427–435. doi: 10.1016/s0079-6123(08)62878-2. [DOI] [PubMed] [Google Scholar]
- Butler JE, Taylor JL, Gandevia SC. Responses of human motoneurons to corticospinal stimulation during maximal voluntary contractions and ischemia. J Neurosci. 2003;23:10224–10230. doi: 10.1523/JNEUROSCI.23-32-10224.2003. [DOI] [PMC free article] [PubMed] [Google Scholar]
- Caldwell JH, Schaller KL, Lasher RS, Peles E, Levinson SR. Sodium channel Nav1.6 is localized at nodes of ranvier, dendrites, and synapses. Proc Natl Acad Sci U S A. 2000;97:5616–5620. doi: 10.1073/pnas.090034797. [DOI] [PMC free article] [PubMed] [Google Scholar]
- Cappelen-Smith C, Kuwabara S, Lin CS, Mogyoros I, Burke D. Activity-dependent hyperpolarization and conduction block in chronic inflammatory demyelinating polyneuropathy. Ann Neurol. 2000;48:826–832. [PubMed] [Google Scholar]
- Clark BD, Goldberg EM, Rudy B. Electrogenic tuning of the axon initial segment. Neuroscientist. 2009;15:651–668. doi: 10.1177/1073858409341973. [DOI] [PMC free article] [PubMed] [Google Scholar]
- Coombs JS, Curtis DR, Eccles JC. The interpretation of spike potentials of motoneurones. J Physiol. 1957a;139:198–231. doi: 10.1113/jphysiol.1957.sp005887. [DOI] [PMC free article] [PubMed] [Google Scholar]
- Coombs JS, Curtis DR, Eccles JC. The generation of impulses in motoneurones. J Physiol. 1957b;139:232–249. doi: 10.1113/jphysiol.1957.sp005888. [DOI] [PMC free article] [PubMed] [Google Scholar]
- Dawson GD, Merton PA. 2nd Intern Congress of Physiol Sci. Brussels: 1956. Recurrent discharges from motoneurons; pp. 221–222. [Google Scholar]
- Debanne D, Campanac E, Bialowas A, Carlier E, Alcaraz G. Axon physiology. Physiol Rev. 2011;91:555–602. doi: 10.1152/physrev.00048.2009. [DOI] [PubMed] [Google Scholar]
- Duflocq A, Chareyre F, Giovannini M, Couraud F, Davenne M. Characterization of the axon initial segment (AIS) of motor neurons and identification of a para-AIS and a juxtapara-AIS, organized by protein 4.1B. BMC Biol. 2011;9:66. doi: 10.1186/1741-7007-9-66. [DOI] [PMC free article] [PubMed] [Google Scholar]
- Duflocq A, Le Bras B, Bullier E, Couraud F, Davenne M. Nav1.1 is predominantly expressed in nodes of Ranvier and axon initial segments. Mol Cell Neurosci. 2008;39:180–192. doi: 10.1016/j.mcn.2008.06.008. [DOI] [PubMed] [Google Scholar]
- Eisen A, Odusote K. Amplitude of the F wave: a potential means of documenting spasticity. Neurology. 1979;29:1306–1309. doi: 10.1212/wnl.29.9_part_1.1306. [DOI] [PubMed] [Google Scholar]
- Espiritu MG, Lin CS, Burke D. Motoneuron excitability and the F wave. Muscle Nerve. 2003;27:720–727. doi: 10.1002/mus.10388. [DOI] [PubMed] [Google Scholar]
- Fox JE, Hitchcock ER. F wave size as a monitor of motor neuron excitability: the effect of deafferentation. J Neurol Neurosurg Psychiatry. 1987;50:453–459. doi: 10.1136/jnnp.50.4.453. [DOI] [PMC free article] [PubMed] [Google Scholar]
- Gandevia SC. Spinal and supraspinal factors in human muscle fatigue. Physiol Rev. 2001;81:1725–1789. doi: 10.1152/physrev.2001.81.4.1725. [DOI] [PubMed] [Google Scholar]
- Gandevia SC, Petersen N, Butler JE, Taylor JL. Impaired response of human motoneurones to corticospinal stimulation after voluntary exercise. J Physiol. 1999;521:749–759. doi: 10.1111/j.1469-7793.1999.00749.x. [DOI] [PMC free article] [PubMed] [Google Scholar]
- Giesebrecht S, Martin PG, Gandevia SC, Taylor JL. Altered corticospinal transmission to the hand after maximum voluntary efforts. Muscle Nerve. 2011;43:679–687. doi: 10.1002/mus.21938. [DOI] [PubMed] [Google Scholar]
- Gogan P, Gustafsson B, Jankowska E, Tyc-Dumont S. On re-excitation of feline motoneurones: its mechanism and consequences. J Physiol. 1984;350:81–91. doi: 10.1113/jphysiol.1984.sp015189. [DOI] [PMC free article] [PubMed] [Google Scholar]
- Grubb MS, Burrone J. Building and maintaining the axon initial segment. Curr Opin Neurobiol. 2010;20:481–488. doi: 10.1016/j.conb.2010.04.012. [DOI] [PMC free article] [PubMed] [Google Scholar]
- Hara M, Kimura J, Walker DD, Taniguchi S, Ichikawa H, Fujisawa R, Shimizu H, Abe T, Yamada T, Kayamori R, Mizutani T. Effect of motor imagery and voluntary muscle contraction on the F wave. Muscle Nerve. 2010;42:208–212. doi: 10.1002/mus.21667. [DOI] [PubMed] [Google Scholar]
- Hu W, Tian C, Li T, Yang M, Hou H, Shu Y. Distinct contributions of Nav1.6 and Nav1.2 in action potential initiation and backpropagation. Nat Neurosci. 2009;12:996–1002. doi: 10.1038/nn.2359. [DOI] [PubMed] [Google Scholar]
- Hultborn H, Meunier S, Pierrot-Deseilligny E, Shindo M. Changes in presynaptic inhibition of Ia fibres at the onset of voluntary contraction in man. J Physiol. 1987;389:757–772. doi: 10.1113/jphysiol.1987.sp016681. [DOI] [PMC free article] [PubMed] [Google Scholar]
- Inda MC, DeFelipe J, Munoz A. Voltage-gated ion channels in the axon initial segment of human cortical pyramidal cells and their relationship with chandelier cells. Proc Natl Acad Sci U S A. 2006;103:2920–2925. doi: 10.1073/pnas.0511197103. [DOI] [PMC free article] [PubMed] [Google Scholar]
- Jackson A, Baker SN, Fetz EE. Tests for presynaptic modulation of corticospinal terminals from peripheral afferents and pyramidal tract in the macaque. J Physiol. 2006;573:107–120. doi: 10.1113/jphysiol.2005.100537. [DOI] [PMC free article] [PubMed] [Google Scholar]
- Johnson KV, Edwards SC, Van Tongeren C, Bawa P. Properties of human motor units after prolonged activity at a constant firing rate. Exp Brain Res. 2004;154:479–487. doi: 10.1007/s00221-003-1678-z. [DOI] [PubMed] [Google Scholar]
- Kernell D, Monster AW. Time course and properties of late adaptation in spinal motoneurones of the cat. Exp Brain Res. 1982;46:191–196. doi: 10.1007/BF00237176. [DOI] [PubMed] [Google Scholar]
- Kole MH. First node of Ranvier facilitates high-frequency burst encoding. Neuron. 2011;71:671–682. doi: 10.1016/j.neuron.2011.06.024. [DOI] [PubMed] [Google Scholar]
- Kole MH, Stuart GJ. Is action potential threshold lowest in the axon. Nat Neurosci. 2008;11:1253–1255. doi: 10.1038/nn.2203. [DOI] [PubMed] [Google Scholar]
- Kress GJ, Mennerick S. Action potential initiation and propagation: upstream influences on neurotransmission. Neuroscience. 2009;158:211–222. doi: 10.1016/j.neuroscience.2008.03.021. [DOI] [PMC free article] [PubMed] [Google Scholar]
- Kuwabara S, Cappelen-Smith C, Lin CS, Mogyoros I, Burke D. Effects of voluntary activity on the excitability of motor axons in the peroneal nerve. Muscle Nerve. 2002;25:176–184. doi: 10.1002/mus.10030. [DOI] [PubMed] [Google Scholar]
- Lloyd DPC. The interaction of antidromic and orthodromic volleys in a segmental spinal motor nuclues. J Neurophysiol. 1943;6:143–151. [Google Scholar]
- Lorincz A, Nusser Z. Cell-type-dependent molecular composition of the axon initial segment. J Neurosci. 2008;28:14329–14340. doi: 10.1523/JNEUROSCI.4833-08.2008. [DOI] [PMC free article] [PubMed] [Google Scholar]
- Magladery JW, McDougal DB. Electrophysiological studies of nerve and reflex activity in normal man. Bull John Hopkins Hosp. 1950;86:265–290. [PubMed] [Google Scholar]
- Martin PG, Gandevia SC, Taylor JL. Output of human motoneuron pools to corticospinal inputs during voluntary contractions. J Neurophysiol. 2006;95:3512–3518. doi: 10.1152/jn.01230.2005. [DOI] [PubMed] [Google Scholar]
- Mayer RF, Feldman RG. Observations on the nature of the F wave in man. Neurology. 1967;17:147–156. doi: 10.1212/wnl.17.2.147. [DOI] [PubMed] [Google Scholar]
- McComas AJ, Sica RE, Upton AR. Excitability of human motoneurones during effort. J Physiol. 1970;210:145P–146P. [PubMed] [Google Scholar]
- McNeil CJ, Giesebrecht S, Khan SI, Gandevia SC, Taylor JL. The reduction in human motoneurone responsiveness during muscle fatigue is not prevented by increased muscle spindle discharge. J physiol. 2011;589:3731–3738. doi: 10.1113/jphysiol.2011.210252. [DOI] [PMC free article] [PubMed] [Google Scholar]
- McNeil CJ, Martin PG, Gandevia SC, Taylor JL. The response to paired motor cortical stimuli is abolished at a spinal level during human muscle fatigue. J Physiol. 2009;587:5601–5612. doi: 10.1113/jphysiol.2009.180968. [DOI] [PMC free article] [PubMed] [Google Scholar]
- Meunier S, Pierrot-Deseilligny E. Cortical control of presynaptic inhibition of Ia afferents in humans. Exp Brain Res. 1998;119:415–426. doi: 10.1007/s002210050357. [DOI] [PubMed] [Google Scholar]
- Milanov I. Examination of the segmental pathophysiological mechanisms of spasticity. Electromyogr Clin Neurophysiol. 1994;34:73–79. [PubMed] [Google Scholar]
- Miles GB, Dai Y, Brownstone RM. Mechanisms underlying the early phase of spike frequency adaptation in mouse spinal motoneurones. J Physiol. 2005;566:519–532. doi: 10.1113/jphysiol.2005.086033. [DOI] [PMC free article] [PubMed] [Google Scholar]
- Murray JE, Jankelowitz SK. A comparison of the excitability of motor axons innervating the APB and ADM muscles. Clin Neurophysiol. 2011;122:2290–2293. doi: 10.1016/j.clinph.2011.04.007. [DOI] [PubMed] [Google Scholar]
- Nielsen J, Petersen N. Is presynaptic inhibition distributed to corticospinal fibres in man. J Physiol. 1994;477:47–58. doi: 10.1113/jphysiol.1994.sp020170. [DOI] [PMC free article] [PubMed] [Google Scholar]
- Noto Y, Misawa S, Kanai K, Sato Y, Shibuya K, Isose S, Nasu S, Sekiguchi Y, Fujimaki Y, Ohmori S, Nakagawa M, Kuwabara S. Activity-dependent changes in impulse conduction of single human motor axons: a stimulated single fibre electromyography study. Clin Neurophysiol. 2011;122:2512–2517. doi: 10.1016/j.clinph.2011.05.005. [DOI] [PubMed] [Google Scholar]
- Ogawa Y, Rasband MN. The functional organization and assembly of the axon initial segment. Curr Opin Neurobiol. 2008;18:307–313. doi: 10.1016/j.conb.2008.08.008. [DOI] [PubMed] [Google Scholar]
- Panayiotopoulos CP, Chroni E. F-waves in clinical neurophysiology: a review, methodological issues and overall value in peripheral neuropathies. Electroencephalogr Clin Neurophysiol. 1996;101:365–374. [PubMed] [Google Scholar]
- Peters EJ, Fuglevand AJ. Cessation of human motor unit discharge during sustained maximal voluntary contraction. Neurosci Lett. 1999;274:66–70. doi: 10.1016/s0304-3940(99)00666-7. [DOI] [PubMed] [Google Scholar]
- Petersen NT, Taylor JL, Butler JE, Gandevia SC. Depression of activity in the corticospinal pathway during human motor behaviour after strong voluntary contractions. J Neurosci. 2003;23:7974–7980. doi: 10.1523/JNEUROSCI.23-22-07974.2003. [DOI] [PMC free article] [PubMed] [Google Scholar]
- Renshaw B. Influence of discharge of motoneurons upon excitation of neighboring motoneurons. J Neurophysiol. 1941;4:167–183. [Google Scholar]
- Rossi A, Biasella A, Scarselli C, Piu P, Ginanneschi F. Influence of activity-induced axonal hypoexcitability on transmission of descending and segmental signals. Brain Res. 2010;1320:47–59. doi: 10.1016/j.brainres.2009.12.023. [DOI] [PubMed] [Google Scholar]
- Sawczuk A, Powers RK, Binder MD. Contribution of outward currents to spike-frequency adaptation in hypoglossal motoneurons of the rat. J Neurophysiol. 1997;78:2246–2253. doi: 10.1152/jn.1997.78.5.2246. [DOI] [PubMed] [Google Scholar]
- Schoepfle GM, Katholi CR. Posttetanic changes in membrane potential of single medullated nerve fibers. Am J Physiol. 1973;225:1501–1507. doi: 10.1152/ajplegacy.1973.225.6.1501. [DOI] [PubMed] [Google Scholar]
- Spielmann JM, Laouris Y, Nordstrom MA, Robinson GA, Reinking RM, Stuart DG. Adaptation of cat motoneurons to sustained and intermittent extracellular activation. J Physiol. 1993;464:75–120. doi: 10.1113/jphysiol.1993.sp019625. [DOI] [PMC free article] [PubMed] [Google Scholar]
- Taylor JL, Butler JE, Gandevia SC. Altered responses of human elbow flexors to peripheral-nerve and cortical stimulation during a sustained maximal voluntary contraction. Exp Brain Res. 1999;127:108–115. doi: 10.1007/s002210050779. [DOI] [PubMed] [Google Scholar]
- Thorne J. Central responses to electrical activation of the peripheral nerves supplying the intrinsic hand muscles. J Neurol Neurosurg Psychiatry. 1965;28:482–495. doi: 10.1136/jnnp.28.6.482. [DOI] [PMC free article] [PubMed] [Google Scholar]
- Todd G, Gorman RB, Gandevia SC. Measurement and reproducibility of strength and voluntary activation of lower-limb muscles. Muscle Nerve. 2004;29:834–842. doi: 10.1002/mus.20027. [DOI] [PubMed] [Google Scholar]
- Vagg R, Mogyoros I, Kiernan MC, Burke D. Activity-dependent hyperpolarization of human motor axons produced by natural activity. J Physiol. 1998;507:919–925. doi: 10.1111/j.1469-7793.1998.919bs.x. [DOI] [PMC free article] [PubMed] [Google Scholar]
- Van Wart A, Trimmer JS, Matthews G. Polarized distribution of ion channels within microdomains of the axon initial segment. J Comp Neurol. 2007;500:339–352. doi: 10.1002/cne.21173. [DOI] [PubMed] [Google Scholar]
- Westenbroek RE, Merrick DK, Catterall WA. Differential subcellular localization of the RI and RII Na+ channel subtypes in central neurons. Neuron. 1989;3:695–704. doi: 10.1016/0896-6273(89)90238-9. [DOI] [PubMed] [Google Scholar]
- Wimmer VC, Reid CA, So EY, Berkovic SF, Petrou S. Axon initial segment dysfunction in epilepsy. J Physiol. 2010;588:1829–1840. doi: 10.1113/jphysiol.2010.188417. [DOI] [PMC free article] [PubMed] [Google Scholar]