

Abstract
Objectives
The objective of this study was to determine whether, in patients with prostate cancer (PCa) bone metastases receiving chemotherapy, early post-treatment changes on CT are reproducible and associated with clinical outcomes.
Methods
Blinded to outcomes, two radiologists with 1 year and 5 years of experience independently reviewed CTs obtained before and 3 months after chemotherapy initiation in 38 patients with bone metastases from castration-resistant PCa, recording the size, matrix and attenuation of ≤5 lesions; presence of new lesions, extraosseous components, periosteal reactions and cortical thickening; and overall CT assessment (improved, no change or worse). Kappa statistics were used to assess inter-reader agreement; the Kruskal–Wallis test and Cox regression model were used to evaluate associations.
Results
Inter-reader agreement was low/fair for size change (concordance correlation coefficient=0.013), overall assessment and extraosseous involvement (κ=0.3), moderate for periosteal reaction and cortical thickening (κ=0.4–0.5), and substantial for CT attenuation (κ=0.7). Most metastases were blastic (Reader 1, 58%; Reader 2, 67%) or mixed lytic–blastic (Reader 1, 42%; Reader 2, 34%). No individual CT features correlated with survival. Readers 1 and 2 called the disease improved in 26% and 5% of patients, unchanged in 11% and 21%, and worse in 63% and 74%, respectively, with 64% interreader agreement. Overall CT assessment did not correlate with percentage change in prostate-specific antigen level. For the more experienced reader (Reader 2), patients with improved or unchanged disease had significantly longer median survival (p=0.036).
Conclusions
In PCa bone metastases, interreader agreement is low in overall CT post-treatment assessment and varies widely for individual CT features. Improved or stable disease identified by an experienced reader is statistically associated with longer survival.
Metastatic prostate cancer (PCa) is characterised by its frequent predilection for bone. As such, it takes a significant toll on the male population in both morbidity and mortality. Bone metastases inflict cord compression, pain, fracture and blood dyscrasias, and metastatic prostate cancer is the second leading cause of cancer-related deaths in American men. In 2011, it is anticipated that 33 720 men will die of this disease, nearly all of them from bony complications [1].
Advances in non-invasive imaging such as MRI, CT and positron emission tomography (PET)/CT have facilitated the diagnosis and monitoring of changes in bone metastases in individual patients. However, standardised imaging criteria for assessing PCa bone metastases during and after systemic therapy have not been established.
Response assessment criteria developed by the International Union Against Cancer (UICC) [2] and World Health Organization (WHO) [3] rely on data from plain radiography and bone scan, but these imaging modalities usually require a long interval period—up to 6 months—to reliably detect changes within bone metastases. The response evaluation criteria in solid tumours (RECIST) [4], which are broadly used in assessing oncologic therapy response based on largest-diameter measurement on CT, specifically note that bone metastases are non-measurable lesions, except if an identifiable 10-mm or larger soft tissue component of a lytic or mixed lytic–blastic bone metastasis can be measured [5]. Blastic bone metastases, as typically seen in PCa, are specifically stated to be non-measurable with RECIST.
CT has been routinely used in assessing the overall burden of metastases in visceral organs because of its high spatial resolution and soft-tissue contrast, and has been shown to detect therapy-related changes in bone earlier than radiography [6]. Hamaoka et al [7] attempted to classify bone metastases from breast cancer based on imaging by including advanced imaging modalities such as CT and MRI. They introduced morphological changes, such as the appearance of a sclerotic rim or partial fill-in or sclerosis of a lytic lesion, as imaging features of favourable post-treatment changes. However, CT criteria for defining such post-treatment changes in bone metastases as a “response” have not been prospectively validated or clinically qualified in patients with prostate cancer. Given these uncertainties, the Prostate Cancer Clinical Trials Working Group 2 (PCWG2) proposed that post-treatment bone scan changes be reported as improved, stable or worse [8].
The aims of this study were to determine whether assessments of CT features of PCa bone metastases by two readers are reproducible, and whether any CT features correlate with patient survival.
Methods and materials
The institutional review board approved this retrospective study and waived the requirement for informed consent; the study was conducted in compliance with the Health Insurance Portability and Accountability Act.
Patient population
The study included 38 patients who had castration-resistant PCa with bone metastases verified by biopsy or determined on imaging and who were enrolled in the same taxane-based chemotherapy protocol between 1999 and 2007. The patients underwent torso (chest, abdomen, pelvis) CT imaging before (as a baseline) and 12 weeks after the initiation of systemic therapy (for treatment response assessment). The mean patient age was 69.4±8.5 years (range 52–82 years). All patients had expired at the time of this retrospective study. Clinical follow-up for the patients was based on prostate-specific antigen (PSA) levels. The percentage change in PSA was defined as (PSA at follow-up–baseline PSA)/baseline PSA×100%. Patients were categorised on the basis of PSA as having had a post-treatment rise or a decline in PSA, without using a threshold. Overall survival time was defined as the time period between the date of the follow-up scan and the time of death. There were 19 patients with a post-treatment decline in PSA and 19 patients with a post-treatment rise in PSA. The mean age of those with a decline was 70.9±7.5 years (range 57–81 years) and their mean overall survival time was 17.2±6.7 months (range 6.1–35.5 months). The mean age of those with a rise in PSA was 68±9.4 years (range 52–82 years) and their mean overall survival time was 13.3±13.1 months (range 0.2–57.7 months).
Scanning technique
CT examinations were performed using multidetector CT scanners (GE Medical Systems, Milwaukee, WI). Images of the torso were obtained in 5.0- or 7.5-mm-thick sections, and the slice thickness was the same on both examinations (baseline and therapy assessment at 12 weeks) in all but one case. All examinations were performed following the administration of intravenous contrast.
Image evaluation
Two radiologists (Reader 1 with 1 year and Reader 2 with 5 years of experience reading CT scans), who were blinded to clinical outcomes, independently reviewed the baseline and follow-up CT scans in temporal sequence. Based on the number of lesions at baseline CT, patients were categorised into one of five groups: 1 lesion; 2–4 lesions; 5–9 lesions; 10–20 lesions; or more than 20 lesions. Location of bone metastases (axial, appendicular or both) was noted. On the baseline CT, up to five measurable target lesions were chosen by one reader (Reader 1) as the target lesions for this study, to represent the predominant matrix type of the bone metastases (lytic, blastic or mixed). The presence of any new lesions, changes in periosteal reaction or cortical thickening was noted, as was the presence of extraosseous soft-tissue masses accompanying target and non-target lesions. The mean attenuation of target lesions and their standard deviations measured in Hounsfield units were assessed by placing a circular region of interest covering approximately 75% of the area of each target lesion, avoiding the lesion margin. The difference (percentage change) in attenuation of each target lesion between the two scans was calculated.
Based on changes in CT features and the presence of new lesions, each patient's bone disease was classified into one of three groups by each reader: improved, no change or worse. Bone metastases were determined to be “improved” when the target, extraosseous mass or periosteal reaction had decreased in size in the absence of new bone lesions. Bone metastases were determined to be “worse” when the target lesions had increased in size and/or there were new lesions, increased lysis, increased periosteal reaction and/or enlargement of extraosseous mass. Bone metastases were considered stable (“no change”) when there were no changes in any of the above features and no new bone lesions.
Statistical analysis
We evaluated interreader agreement on the overall assessment of the response of bone metastases to systemic therapy (improved, no change or worse) and features on CT using the kappa statistic or, when there were more than two categories, the weighted kappa statistic with quadratic weights.
Agreement on the change in size was assessed using the concordance correlation coefficient [9]. The association between percentage changes in PSA and overall CT assessment by each reader was examined using the Kruskal–Wallis rank-sum test. For each reader, the association between the change of tumour size and the overall CT assessment was evaluated using generalised estimating equations with an independent correlation matrix and a robust covariance matrix to take into account the multiple lesions per patient. p-values were then calculated based on score statistics.
The log-rank test was used to compare overall survival between the patients with a decline in PSA and those with a rise in PSA. The log-rank test was also used to compare overall survival between patients with different CT features, and between patients with different overall assessments at CT. When the number of events in a subgroup was fewer than five, the permutation log-rank test [10] was used. A Cox regression, with robust covariance estimates to take into account the multiple lesions per patient, was used to evaluate the association between percentage change in CT attenuation and overall survival [11]. These analyses were done separately for each reader.
A test of difference or an association with a p-value <0.05 was considered statistically significant. All analyses were conducted in SAS v. 9.2 (SAS Institute, Cary, NC).
Results
In total, 155 bone metastases were evaluated in the 38 patients. 28 patients (74%) had 10 or more lesions per scan. 25 patients had five measurable target lesions, and 13 patients had 1–4 measurable target lesions. The mean largest diameter measurement of the baseline lesions was 16±8 mm for both readers. The mean size measurements of the lesions did not differ significantly between the two readers at either scan (p=0.83 and p=0.58 for baseline and treatment assessment scans, respectively).
Metastases were classified as blastic (Figure 1a) in 22 patients (58%) by Reader 1 and 25 patients (66%) by Reader 2, and as mixed lytic–blastic (Figure 1b) in 16 patients (42%) by Reader 1 and 13 patients (34%) by Reader 2. Interreader agreement in the measurement of CT attenuation was substantial (κ=0.7). New lesions were identified on the treatment assessment CT examination in 16 patients (42%) by Reader 1 and 9 patients (24%) by Reader 2, with moderate interreader agreement (κ=0.6).
Figure 1.

Examples of predominant types of bone metastases on baseline CT scans. (a) Blastic metastases in a 67-year-old male. Axial CT image of the pelvis shows multiple blastic metastases in L5 (arrow) and iliac bones (arrowheads). (b) Mixed lytic and blastic metastases in an 81-year-old male. Axial CT image of the chest shows lytic metastases in the right humeral head and T2 vertebral body (arrows). There were blastic metastases at other sites (not shown) in this patient.
Periosteal reaction (Figure 2) was noted in 14 patients by Reader 1 and in 22 patients by Reader 2. Reader 1 and Reader 2 found cortical thickening in 8 and 4 patients and extraosseous masses associated with bone lesions (Figure 3) in 4 and 11 patients, respectively. The two readers displayed moderate agreement on periosteal reaction (κ=0.5) and on cortical thickening (κ=0.4), and fair agreement on extraosseous involvement (κ=0.3).
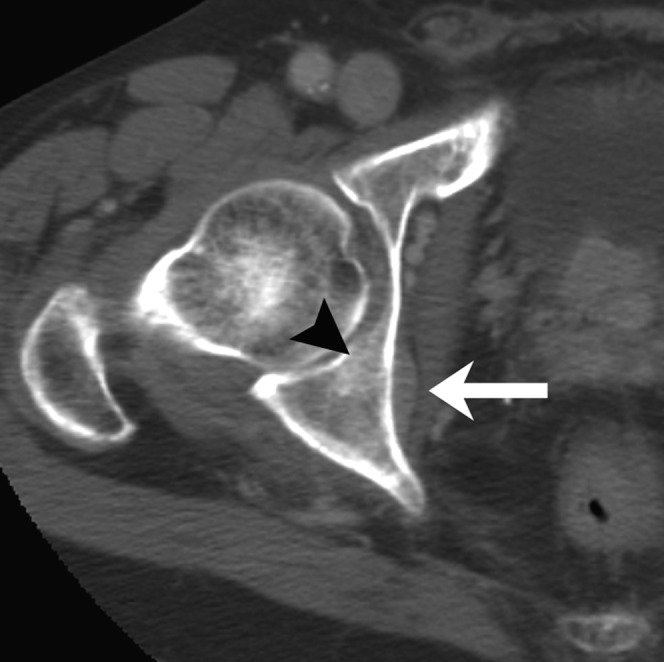
Figure 2.
Example of periosteal reaction of bone metastasis in an 82-year-old male. Axial CT image of the pelvis at baseline shows periosteal reaction (arrow) in the left medial acetabular wall. There is an osteoblastic metastasis in the left posterior acetabulum (arrowhead).
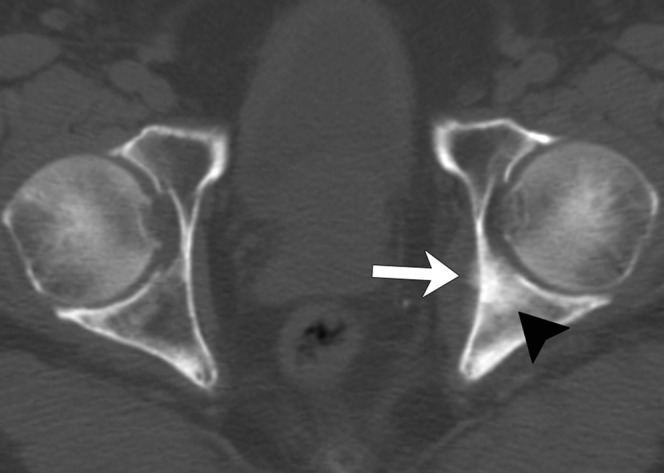
Figure 3.
Example of extraosseous mass of bone metastasis in an 82-year-old male. Axial CT image of the pelvis at baseline shows an extraosseous mass (arrow) of a subtle blastic metastasis (arrowhead) in the right acetabulum.
The change in lesion size (the difference in the longest diameter between treatment assessment and baseline CT examinations) ranged from −7 to 30 mm (with a median of 0) for Reader 1, and from −3 to 46 mm (with a median of 0) for Reader 2 (Figure 4). Changes in lesion size showed low concordance between readers (concordance correlation coefficient=0.013). The range of size changes was largest in the “worse” response assessment category. 12 weeks after initiation of chemotherapy, Reader 1 reported that 10 patients (26%) had improved bone disease, 4 (11%) had no change and 24 (63%) had worse disease (Table 1). Reader 2 reported that 2 patients (5%) had improved bone disease, 8 (21%) had no change and 28 (74%) had worse bone disease (Table 1). Overall, the percentage of agreement between the two readers was 64%, with a κ=0.3, indicating fair agreement.
Figure 4.

Changes in tumour size measured in millimetres for patients deemed to have improved bone disease, no change or worse bone disease by (a) Reader 1 and (b) Reader 2. Note that for both readers, the range of size changes is widest in the “worse” assessment category. The interreader concordance correlation coefficient is low (0.013).
Table 1. Overall post-treatment assessment on CT by two readers.
| Reader 2 |
||||
| Reader 1 | Improved | No change | Worse | κ |
| Improved | 1 | 4 | 5 | |
| No change | 0 | 2 | 2 | 0.3 |
| Worse | 1 | 2 | 21 | |
Percentage change in PSA did not correlate with overall CT response assessment for either reader (Table 2). The median percentage changes in PSA in the improved, no change and worse categories were –46%, –67% and 9%, respectively, for Reader 1 (p=0.608) and −17%, 21% and 9%, respectively, for Reader 2 (p=0.558).
Table 2. CT overall post-treatment assessment and percentage change of PSA.
| Reader | % PSA change | CT overall response assessment |
Kruskal–Wallis test p-value | ||
| Improved | No change | Worse | |||
| 1 | Mean±SD | 72±165 | −20±110 | 34±129 | 0.608 |
| Median (range) | −46 (−93, 420) | −67 (−90, 142) | 9 (−99, 346) | ||
| 2 | Mean±SD | −17±115 | 61±169 | 36±131 | 0.558 |
| Median (range) | −17 (−99, 64) | 21 (−84, 420) | 9 (−96, 346) | ||
PSA, prostate-specific antigen; SD, standard deviation.
The mean increase in CT attenuation ranged from 16% to 40%. The percentage change in CT attenuation as assessed by either reader was not found to be associated with overall survival time. A 1% increase in CT attenuation change corresponded to a hazard ratio of 1.07 [95% confidence interval (CI) 0.71–1.60, p=0.752] for Reader 1 and a hazard ratio of 0.61 (95% CI 0.35–1.05, p=0.075) for Reader 2.
Median overall survival time was 10.2 months (95% CI 7.6–20.7 months) for those whose PSA rose and 15.5 months (95% CI 14.1–23.2 months) for those whose PSA declined on treatment, with a log-rank test p-value of 0.252, indicating a non-significant difference (Figure 5a). For both readers, patients deemed to have improved bone metastases or no change had longer median overall survival times than patients deemed to have worsening bone metastases (Figure 5b,c); the difference in survival time was statistically significant for Reader 2 (p=0.036) but not for Reader 1 (p=0.622).
Figure 5.

(a) Overall survival for patients with a post-treatment decline in prostate-specific antigen (PSA) and those with a post-treatment rise in PSA. (b, c) Overall survival for patients deemed to have improved bone disease, no change or worse bone disease on CT by Reader 1 (b) and Reader 2 (c).
Overall survival time was not significantly affected by the presence of new lesions (p=0.996 for Reader 1 and p=0.182 for Reader 2) or extraosseous involvement (p=0.987 for Reader 1 and p=0.123 for Reader 2) on the post-treatment CT (Table 3). Survival time was significantly associated with periosteal reaction (p=0.044) for Reader 2 and cortical thickening (p=0.043) for Reader 1.
Table 3. CT features and survival.
| Image features | Reader 1 |
Reader 2 |
||
| Median overall survival (95% CI) in months | Log-rank test p-value | Median overall survival (95% CI) in months | Log-rank test p-value | |
| New lesions | ||||
| No | 13.8 (8.2–15.9) | 0.996 | 15.5 (8.2–20.7) | 0.182 |
| Yes | 15.2 (0.2–22.2) | 12.8 (10.2–15.2) | ||
| Periosteal reaction | ||||
| No | 14.2 (8.2–20.7) | 0.228 | 15.5 (8.2–23.2) | 0.044 |
| Yes | 13.9 (10.2–16.6) | 13.8 (8.2–15.9) | ||
| Cortical thickening | ||||
| No | 15.4 (10.8–20.1) | 0.043 | 14.5 (10.8–18.8) | 0.221 |
| Yes | 12.9 (4.1–15.2) | 12.1 (4.1–15.9) | ||
| Extraosseous involvement | ||||
| No | 13.9 (10.2–15.9) | 0.987 | 15.2 (10.2–19.9) | 0.123 |
| Yes | 15.1 (3.8–23.5) | 13.7 (4.1–16.6) | ||
CI, confidence interval.
Discussion
The reported diagnostic sensitivity of CT in the detection of bone metastases ranges from 71% to 100% [7]. CT has been found to be superior to bone scintigraphy in detecting bone metastases from breast cancer [12-13] and other cancers, including PCa [14].
Sclerosis of a lytic part of a bone metastasis can represent a favourable response to treatment [13], whereas new lysis within an osteoblastic or mixed lesion or an increase in the size of an originally blastic lesion may represent progression of disease [15]. The UICC and WHO have published criteria for assessing post-treatment changes in bone metastases with bone scintigraphy and radiographic studies but not with CT. In 2004, a group from MD Anderson proposed criteria for assessing such changes in bone metastases from breast cancer based on CT, MRI, plain radiography and skeletal scintigraphy [7]. Their proposed criteria included four categories of response: complete response, partial response, no change and progressive disease. On CT, complete response was defined as sclerosis of a lytic lesion or normalisation of an osteoblastic lesion; partial response was defined by the appearance of a sclerotic rim around any initially lytic lesion, sclerosis of a lesion previously undetected on CT or radiography, partial sclerosis of a lytic lesion or a decrease in size of a blastic lesion [7]. In our study, no patient's post-treatment assessment CT showed the disappearance of all metastases visible on the baseline CT, and we divided our results into three categories: improved, no change and worse [8].
Among the CT features we analysed, CT attenuation change had the highest interreader agreement, but it was not associated with overall survival time. We postulate a few possible causes. The majority of patients in our study (58% for Reader 1; 67% for Reader 2) had blastic metastases, and the rest had mixed lytic–blastic metastases. Therefore, decreases in CT attenuation may have resulted from lysis in lytic–blastic metastases or decreased osteoblastic activity, while increases in CT attenuation may have been due to increased osteoblastic activity or healing of bone metastases (“osteoblastic response”). Because they overlap, distinguishing these different causes based on only one CT scan obtained 3 months into treatment is challenging. In particular, an increase in CT attenuation as a healing response is a well-documented phenomenon in a variety of cancers, including cancers of the prostate, lung and breast [14,15], and is the CT equivalent of the flare phenomenon seen on bone scans. A recent study [16] applied the revised MD Anderson response criteria (omitting the MRI criteria) in 41 patients with bone-only breast cancer metastases; the study found that the criteria were not able to distinguish responders from non-responders in terms of overall survival, and the attenuation change on the initial follow-up CT was not helpful in predicting therapy response associated with longer survival.
In our study, interreader agreement was only fair to moderate for other CT features such as lesion size change, number, periosteal reaction, cortical thickening and extraosseous components. It is interesting that survival time was significantly associated with periosteal reaction (for Reader 2) and cortical thickening (for Reader 1). These features are often considered signs of early cortical involvement by various pathological processes, and although they are not frequently seen in bone metastases, their emergence in follow-up scans could reflect early extraosseous tumour extension in some patients. The relatively low levels of agreement on these and most other individual CT features were probably partly due to the difficulty of defining target lesions in patients with extensive bone metastases. The majority of our patients had multiple bone lesions (74% had more than 10 lesions), and many lesions coalesced with each other or obscured the borders of target lesions and adjacent bones as they grew, limiting the assessment of lesion size and new lesions. In fact, only 25 patients had five measurable target lesions.
At 64% (κ=0.3), the percentage of agreement between the two readers in overall CT assessment was fair. This was probably largely because of the difference in the readers' experience levels and the large numbers of lesions present, both of which could have influenced the detection of target lesions and new bone lesions. For example, more “new” lesions were identified by the less experienced reader, probably because subtle lesions on the baseline scans were overlooked by that reader but detected by the more experienced reader. Although CT is used by many physicians to assess PCa metastasis response, some may not appreciate the considerable interreader variability that exists, or the importance of reader experience. Our results underscore that the performance of an individual radiologist has a substantial impact on the final result of a CT examination, even for such a seemingly simple task as determining whether a bone metastasis is present.
Our study found no statistically significant difference in survival time between those whose PSA increased and those whose PSA declined on treatment; this result is in alignment with those of other oncology trials showing that PSA change is poorly associated with clinical benefit and is not an optimal surrogate for tumour response [17]. However, for both readers, patients with overall CT assessments of improved or no change had longer survival times than patients with worsening bone metastases; this difference in overall survival time was statistically significant for the more experienced reader. It is of course not surprising that patients do better when their bone metastases are seen to be improving than if they are worsening; but it was interesting to find that patients whose bone metastases appeared unchanged on CT also had longer survival. Although this is a promising result, a larger-scale study involving more readers is needed to confirm the utility of CT in the assessment of therapy response in bone metastases from PCa. The evaluation of advanced osteoblastic bone metastases is particularly challenging on CT because the lesions are often not measurable, and CT attenuation change is not a reliable parameter in the early stages of therapy owing to osteoblastic response. Assessment of treatment effects will probably benefit from the employment of other advanced imaging modalities such as MRI or PET/CT imaging [7,18]. Also, computer-assisted diagnosis systems have the potential to minimise interobserver variability for certain key interpretive tasks, such as lesion detection and measurement of maximum lesion diameter.
Our retrospective study had several limitations. Only two readers participated in the study; they had different levels of experience, which probably increased interobserver variability. However, our intention was to evaluate CT features that radiologists of different experience levels would evaluate on a daily basis, so the finding of substantial interobserver variability in these seemingly simple assessments is notable. The CT target lesions for which changes were evaluated were chosen by one reader so that interobserver variability in the measurement of lesion attenuation and size could be assessed. Finally, our study included many patients with advanced blastic bone metastases, which probably made it more difficult to measure individual target lesions and detect new lesions.
Conclusions
In PCa bone metastases, the value of CT for early assessment of the effects of systemic chemotherapy is limited by a lack of reproducible CT features that correlate with longer survival time. Interobserver variability is probably related to level of reader experience, which could be enhanced with specific training in oncological imaging. In this study, improved or stable disease, as defined in the proposal of the PCWG2, was significantly associated with improved survival when identified by an experienced reader.
References
- 1.American Cancer Society Cancer facts and figures 2011. Atlanta, GA: American Cancer Society; 2011 [Google Scholar]
- 2.Hayward JL, Carbone PP, Heusen JC, Kumaoka S, Segaloff A, Rubens RD, et al. Assessment of response to therapy in advanced breast cancer. Br J Cancer 1977;35:292–8 [DOI] [PMC free article] [PubMed] [Google Scholar]
- 3.World Health Organization World Health Organization handbook for reporting results of cancer treatment. WHO offset publication no. 48. Geneva, Switzerland: World Health Organization; 1979 [Google Scholar]
- 4.Therasse P, Arbuck SG, Eisenhauer EA, Wanders J, Kaplan RS, Rubinstein L, et al. New guidelines to evaluate the response to treatment in solid tumors. European Organization for Research and Treatment of Cancer, National Cancer Institute of the United States, National Cancer Center of Canada. J Natl Cancer Inst 2000;92:205–16 [DOI] [PubMed] [Google Scholar]
- 5.Eisenhauer EA, Therasse P, Bogaerts J, Schwartz LH, Sargent D, Ford R, et al. New response evaluation criteria in solid tumours: revised RECIST guideline (version 1.1). Eur J Cancer 2009;45:228–47 [DOI] [PubMed] [Google Scholar]
- 6.Bauerle T, Semmler W. Imaging response to systemic therapy for bone metastases. Eur Radiol 2009;19:2495–507 [DOI] [PubMed] [Google Scholar]
- 7.Hamaoka T, Madewell JE, Podoloff DA, Hortobagyi GN, Ueno NT. Bone imaging in metastatic breast cancer. J Clin Oncol 2004;22:2942–53 [DOI] [PubMed] [Google Scholar]
- 8.Scher HI, Halabi S, Tannock I, Morris M, Sternberg CN, Carducci MA, et al. Design and end points of clinical trials for patients with progressive prostate cancer and castrate levels of testosterone: recommendations of the Prostate Cancer Clinical Trials Working Group. J Clin Oncol 2008;26:1148–59 [DOI] [PMC free article] [PubMed] [Google Scholar]
- 9.Lin LI. A concordance correlation coefficient to evaluate reproducibility. Biometrics 1989;45:255–68 [PubMed] [Google Scholar]
- 10.Heller G, Venkatraman ES. Resampling procedures to compare two survival distributions in the presence of right-censored data. Biometrics 1996;52:1204–13 [Google Scholar]
- 11.Lee EW, Wei IJ, Amato DA. Cox-type regression analysis for large numbers of small groups of correlated failure time observations. Klein JP, Goel PK, eds. Survival analysis: state of the art. Dordrecht, Netherlands: Kluwer; 1992. pp. 237–47 [Google Scholar]
- 12.Muindi J, Coombes RC, Golding S, Powles TJ, Khan O, Husband J. The role of computed tomography in the detection of bone metastases in breast cancer patients. Br J Radiol 1983;56:233–6 [DOI] [PubMed] [Google Scholar]
- 13.Bellamy EA, Nicholas D, Ward M, Coombes RC, Powles TJ, Husband JE. Comparison of computed tomography and conventional radiology in the assessment of treatment response of lytic bony metastases in patients with carcinoma of the breast. Clin Radiol 1987;38:351–5 [DOI] [PubMed] [Google Scholar]
- 14.Quattrocchi C, Santini D, Dell'aia P, Piciucchi S, Leoncini E, Vincenzi B, et al. A prospective analysis of CT attenuation measurements of bone metastases after treatment with zoledronic acid. Skeletal Radiol 2007;36:1121–7 [DOI] [PubMed] [Google Scholar]
- 15.Coleman RE. Assessment of response to treatment. London, UK: Springer Verlag; 1991 [Google Scholar]
- 16.Hamaoka T, Costelloe CM, Madewell JE, Liu P, Berry DA, Islam R, et al. Tumour response interpretation with new tumour response criteria vs the World Health Organization criteria in patients with bone-only metastatic breast cancer. Br J Cancer 2010;102:651–7 [DOI] [PMC free article] [PubMed] [Google Scholar]
- 17.Bubley GJ, Carducci M, Dahut W, Dawson N, Daliani D, Eisenberger M, et al. Eligibility and response guidelines for phase II clinical trials in androgen-independent prostate cancer: recommendations from the Prostate-Specific Antigen Working Group. J Clin Oncol 1999;17:3461–7 [DOI] [PubMed] [Google Scholar]
- 18.Stattaus J, Hahn S, Gauler T, Eberhardt W, Mueller SP, Forsting M, et al. Osteoblastic response as a healing reaction to chemotherapy mimicking progressive disease in patients with small cell lung cancer. Eur Radiol 2009;19:193–200 [DOI] [PubMed] [Google Scholar]