Abstract
Objectives
The objective of this study was to evaluate the imaging capabilities of chest digital tomosynthesis (DT) as a screening method for the detection of artificial pulmonary nodules, and to compare its efficiency with that of CT.
Methods
DT and CT were used to detect artificial pulmonary nodules (5 mm and 8 mm in diameter, ground-glass opacities) placed in a chest phantom. Using a three-dimensional filtered back-projection algorithm at acquisition angles of 8°, 20°, 30° and 40°, DT images of the desired layer thicknesses were reconstructed from the image data acquired during a single tomographic scan. Both standard and sharp CT reconstruction kernels were used, and the detectability index (DI) valves computed for both the DT scan acquisition angles and CT reconstruction kernel types were considered. For the observer study, we examined 50 samples of artificial pulmonary nodules using both DT and CT imaging. On the basis of evaluations made by five thoracic radiologists, a jackknife free-response receiver operating characteristic (JAFROC) study was performed to compare and assess the differences in detection accuracy between CT and DT imaging.
Results
For each increased acquisition angle, DI obtained by DT imaging was similar to that obtained by CT imaging. The difference in the observer-averaged JAFROC figure of merit for the five readings was 0.0363 (95% confidence interval: −0.18, 0.26; F=0.101; p=0.75).
Conclusion
With the advantages of a decreased radiation dose and the practical accessibility of examination, DT may be a useful alternative to CT for the detection of artificial pulmonary nodules.
Detecting and characterising pulmonary nodules is one of the most challenging tasks in thoracic imaging; even experienced chest radiologists may miss up to 30% of such lesions on conventional chest radiographs [1]. Nodules are often only retrospectively visible while reviewing previous images of patients with a known history of nodules [2], and identifying them prospectively remains a difficult task. Because of its high sensitivity, normal-dose helical CT is currently considered as the standard method for the diagnosis of lung cancer. Early reports indicate that low-dose helical CT has the potential to detect lung cancer in the initial stage, thus decreasing morbidity [3]. In addition, CT solves the problem of impaired visibility caused by overlapping anatomical structures, which leads to lower detection rates.
X-ray CT has progressed over the last three decades, and it now constitutes a powerful tool for medical diagnosis. The use of CT as a non-invasive imaging technique has become essential, especially since the advent of spiral CT in the 1990s, which led to shorter scan times and improved three-dimensional (3D) spatial resolution. Although CT provides high resolution in the tomographic plane, it has limited axial resolution. Therefore, the partial-volume effect (PVE) may make it difficult to evaluate structures that are not oriented in the direction of the CT tomographic plane.
CT—particularly high-resolution CT (HRCT)—has greatly improved our ability to evaluate pulmonary lesions; moreover, it has largely replaced conventional tomography [4-7]. HRCT reveals a detailed configuration of localised and diffuse parenchymal abnormalities and facilitates recognition of their anatomical distribution. However, because of PVE, this modality continues to encounter difficulties when used in pulmonary imaging; for example, while demonstrating or permitting the recognition of lesions, in addition to related bronchovascular structures in longitudinal sections, and while demonstrating small calcifications.
Digital tomosynthesis (DT), which enhances the existing advantages of conventional tomography (such as low radiation dose, short examination time and easy and low-cost availability of longitudinal tomographs that do not include PVE), also provides the additional benefits of digital imaging [8-13]. The effective dose of a chest examination with DT is about twice that of a conventional two-view examination [14]. In addition, DT provides some of the tomographic benefits of CT at a reduced radiation dose and cost, with an approach that is easily implemented in conjunction with chest radiography. This technique was developed by improving the older technique of geometric tomography, which has largely fallen out of favour in chest imaging owing to positioning difficulty, high radiation dose and residual blur caused by out-of-plane structures. DT overcomes these difficulties by permitting the reconstruction of numerous image slices from a single low-dose acquisition of image data.
DT reconstructs longitudinal planes within a patient from a set of projection images taken over a limited angle range. The majority of misdiagnosis in projection radiography results from anatomical noise caused by overlying structures. DT increases the detectability of abnormalities by eliminating the overlying anatomical structures and improving the conspicuity of in-plane structures [15]. Although this technique has been around for many decades, it has only recently become clinically practical as a result of the many advances in digital detector technology.
In this study, we performed two experiments to measure the detection capabilities of the DT imaging system for use as an effective screening method and compared the results with those of CT imaging.
Methods and materials
Digital tomosynthesis and CT systems
The DT system (SonialVision Safire II; Shimadzu Co., Kyoto, Japan) comprises an X-ray tube with a 0.4-mm focal spot and a 432×432 mm amorphous selenium digital flat-panel detector with a detector element size of 150×150 μm. Tomography was performed with a linear tomographic movement, a total acquisition time of 6.4 s and acquisition angles of 8°, 20°, 30° and 40°. Table 1 provides a comparison of each effective dose. We calculated the effective dose with Monte Carlo-based software (PCXMCv. 2.0; Radiation and Nuclear Safety Authority, Helsinki, Finland) for DT [16] and a CT dosimetry calculator (ImPACT v. 1.0.4; ImPACT, London, UK) [17]. The projection images were sampled during a single tomographic pass (74 projections) using a matrix size of 2880×2880 by 12 bits, and were used to reconstruct tomograms of a desired height. Each projection image was acquired at a tube potential of 120 kVp, 200 mA with a 5 ms exposure time for X-rays. The reconstruction images were obtained with a 5 mm slice thickness at 5 mm reconstruction intervals. An antiscatter grid was used (focused type, grid ratio 12:1). The DT images were reconstructed using filtered back-projection [18].
Table 1. Comparison of dosimetry of digital tomosynthesis.
| Parameter | Tomosynthesis |
CT | |||
| 8° | 20° | 30° | 40° | ||
| Surface dose | 7.03 mGy | 6.16 mGy | 6.22 mGy | 6.00 mGy | — |
| DLP | — | — | — | — | 194 mGy.cm |
| CTDIW | — | — | — | — | 3.9 mGy |
| CTDIVol | — | — | — | — | 4.8 mGy |
| Effective dose (ICRP 60) | 1.75 mSv | 1.53 mSv | 1.54 mSv | 1.49 mSv | 3.5 mSv |
| Effective dose (ICRP 103) | 2.23 mSv | 1.95 mSv | 1.97 mSv | 1.90 mSv | 4.1 mSv |
CTDIVol, volumetric CT dose index; CTDIW, weighted CT dose index; DLP, dose–length product; ICRP 60/103, International Commission on Radiological Protection tissue weighting factors.
The entrance surface doses quoted are according to the surface of the phantom by glass dosemeter. Each entrance surface dose value was calculated by integration of all projections per acquisition. CTDIW, CTDIVol, DLP and effective dose calculation used ImPACT CT dosimetry calculator.
CT scanning was performed on a multi-slice CT scanner (64-slice SOMATOM Definition scanner; Siemens Medical Systems, Forchheim, Germany) with a tube potential of 120 kVp, a current of 110 mA, 0.6 mm×64 collimation and 0.5 s gantry rotation time at a beam pitch of 0.8. The clinical task was to assess the lung. A slice thickness of 5 mm is routinely used in clinical practice. In this study, we applied the slice thickness used during the screenings; therefore, the axial reconstructed images were obtained with a 5 mm slice thickness at 5 mm reconstruction intervals. Both standard and sharp reconstruction kernels were used (B35f, standard kernel; B60f, sharp kernel).
Specifications of phantom and artificial pulmonary nodules
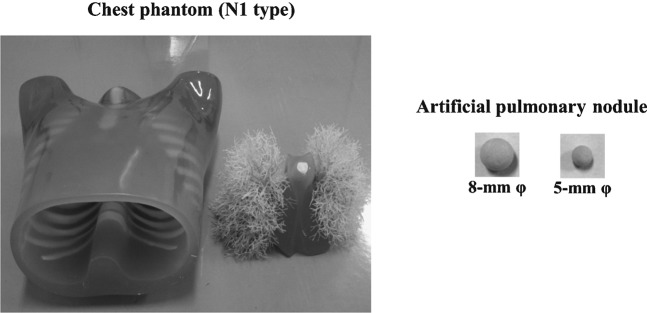
The Chest Phantom N1 (Kyoto Kagaku Co., Tokyo, Japan; materials: soft tissue and vessels are constructed of synthetic materials—i.e. polyurethane, epoxy resin and calcium carbonate). The artificial pulmonary nodules were the ground-glass opacity type (5 mm and 8 mm in diameter, urethane foam) with a homogeneous composition (Figure 1). These were arranged in each lung region, and those that were adjacent to the edges of the lungs or mixed with the blood vessels were used for the observer study. The target contrast (ΔCT) values of the artificial pulmonary nodules (ΔCT=200 HU) were determined on the basis of the artificial background lung parenchyma.
Figure 1.
Illustration of the Chest Phantom N1 and artificial pulmonary nodules.
Overview of the detectability index
The detectability index (DI) provides a figure of merit (FOM) that incorporates the basic system performance and imaging task and offers an objective function for system optimisation and design:
 |
(1) |
where d' is DI, u and v are the spatial frequencies, MTF(u, v) denotes the modulation transfer function [19] and NPS(u, v) denotes the noise power spectrum [19]. MTF was obtained by two-dimensional (2D) Fourier transformation of the line spread function (DT, copper wire images; CT, tungsten microsphere images). NPS was obtained using the fast Fourier transform of a 2D noise pattern of an exposure image. The measured NPS in terms of pixel value was converted to that in terms of relative X-ray intensity by using the system response characteristic curve. The trend correction used a quadratic polynomial approximation. 2D integration was performed over the Nyquist region. The term WTask(u, v) denotes the task function, a frequency-domain representation of the imaging task [19]. The task function was derived from the Fourier transform of the difference between the two hypotheses:
| (2) |
where F denotes the Fourier transform and h1(x, y) and h2(x, y) denote the functions that describe the signal in the spatial domain for the two hypotheses. DI hypothesised a background and a spherical image. Therefore, h1(x, y)= 0 and h2(x, y) corresponded to the 2D image profile of a sphere derived from the attenuated signal through a 5-mm-diameter sphere. Attenuation data were used to model a solid-type lesion (ΔCT=370; materials: polyurethane and hydroxyapatite). In this form, DI can also be understood as a weighted sum of the task function with the noise-equivalent quanta. The resulting DI has been used in a variety of applications as an FOM for system optimisation [20]. DI was then evaluated to compare the effectiveness of chest DT imaging (acquisition angles: 8°, 20°, 30° and 40°; 2D images) with that of CT imaging (2D images) for detecting artificial pulmonary nodules.
Observer study
Five thoracic radiologists—two with 20 years and three with 12 years of experience in chest radiology—evaluated the images for the presence of artificial pulmonary nodules using the free-response receiver operating characteristic (FROC) paradigm. The images were evaluated using ViewDEX 2.0 software (Södra Älvsborgs Sjukhus; Sahlgrenska University and University of Gothenburg, Gothenburg, Sweden) [21], which is designed for the purpose of displaying images. We examined 50 samples of artificial pulmonary nodules (5 and 8 mm in diameter) using both DT (acquisition angle: 40°, 2D images) and CT (standard kernel, 2D images) imaging. The artificial pulmonary nodules were placed at various locations in the chest phantom, following which the CT and DT images were acquired. The radiologists were presented with both the CT and DT images at different times, and were not allowed to change the window width or levels, nor use the pan or zoom functions. We standardised the gradation specifications of each image, as this prevents the creation of a difference of indication. The observers were told that there was a 38:25 ratio of nodule to non-nodule cases and that there could be multiple nodules per case (one nodule per image, 12 cases; two nodules per image, 13 cases; no nodules per image, 25 cases; total 50 samples of each modality). Before each session, five educational cases that were not included in the study were shown. Each observer was instructed to detect any artificial pulmonary nodules on the DT and CT images, and to describe the presence of each nodule on a scale of 1 to 4, where 4 represented the highest degree of confidence (definitely a nodule) and 1 represented the lowest degree of confidence (probably not a nodule). Observers were requested to search for nodules in the entire field of the chest phantom; therefore, they had to repeat the search with 100 individual images in which nodules of different sizes were placed at different locations in the phantom. The given marks, along with ratings and locations, were extracted from the logfile produced by the ViewDEX 2.0 software and compared with the true locations. Each mark was thus classified as a lesion or non-lesion localisation. The time frame between image interpretations was 1–2 weeks. Because of the large difference in appearance between the DT and CT images, this procedure was considered sufficient to avoid recall bias.
Statistical analysis for the observer study
The FROC data were analysed using the jackknife FROC (JAFROC) method [22], implemented in the JAFROC software v. 2.3a (Chakraborty DP; University of Pittsburgh, Pittsburgh, PA) [23,24]. This software computes an FOM, which is defined as the probability of a lesion localisation rating exceeding all non-lesion localisation ratings in a normal case. Thus, only the highest non-lesion localisation ratings in normal cases were included in the analysis. Computation of FOM is identical to calculation of the Wilcoxon test statistic for two samples [22]. JAFROC v. 2.3a calculates the mean FOM of each modality and determines the difference between the means with 95% confidence intervals (CI). In general, the importance of a nodule can be considered in the statistical analysis by giving each nodule a weighting factor. However, the importance of the artificial nodules was not analysed in this study; as a result, the weighting factors were identical for all nodules in the same sample.
Results
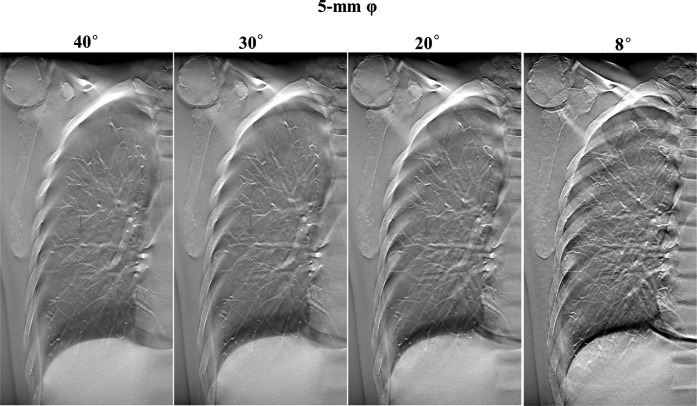
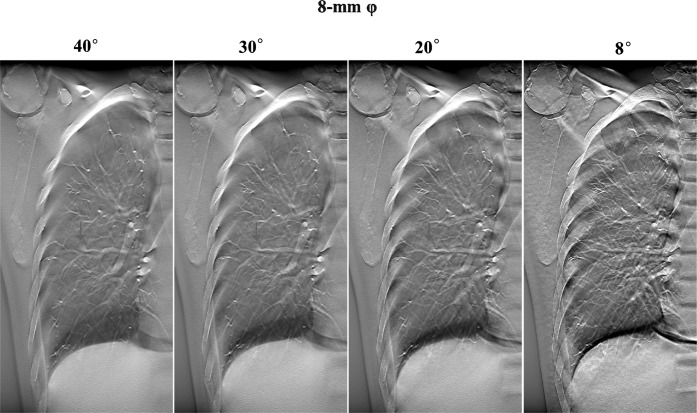
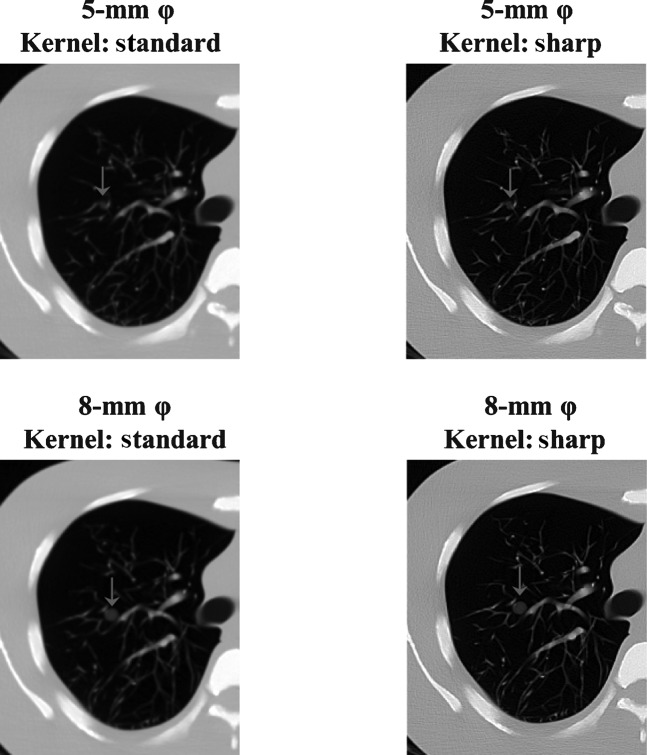
The contrast was greater when DT imaging produced an increase in the acquisition angle of images from the same location (Figures 2 and 3). In DT imaging, contrast was higher in images with large-sized nodules; a similar tendency was demonstrated by CT imaging (Figures 2–4).
Figure 3.
Digital tomosynthesis image with different acquisition angles of the same slice, demonstrating the content of the artificial pulmonary nodules (5 mm in diameter, ground-glass opacity type).
Figure 2.
Digital tomosynthesis image with different acquisition angles of the same slice, demonstrating the content of the artificial pulmonary nodules (8 mm in diameter, ground-glass opacity type).
Figure 4.
CT images from different reconstruction kernels of the same slice, demonstrating the content of the artificial pulmonary nodules (ground-glass opacity type).
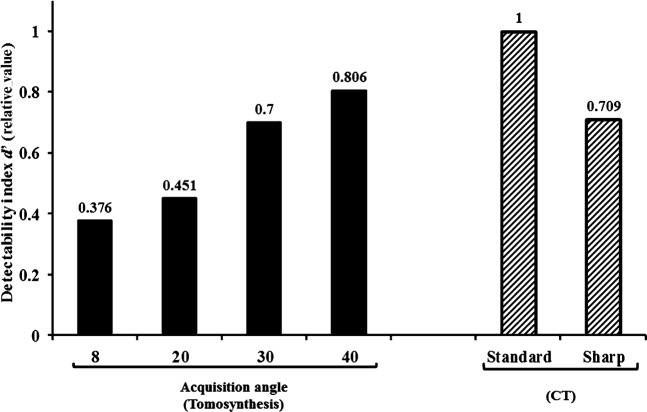
For each increased acquisition angle, DI obtained by DT imaging was similar to that obtained by CT imaging (Figure 5). We statistically compared CT and DT (Student's two-sided t-test; Excel; Microsoft, Redmond, WA) in terms of DI and found that there was no statistically significant difference (significance level of 0.05; test statistic=−1.528, difference: 2; p=0.265).
Figure 5.
Digital tomosynthesis (DT) and CT images demonstrating the detectability index (DI). At the 40° acquisition angle, the high-detectability phantom case demonstrated clear detectability by DT imaging, which produced an increase in DI values for identical planes.
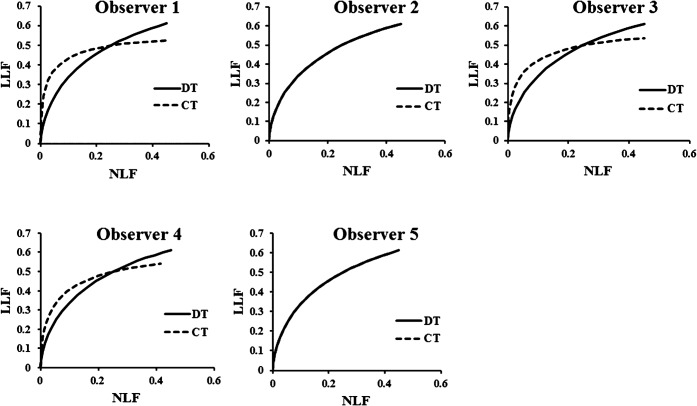
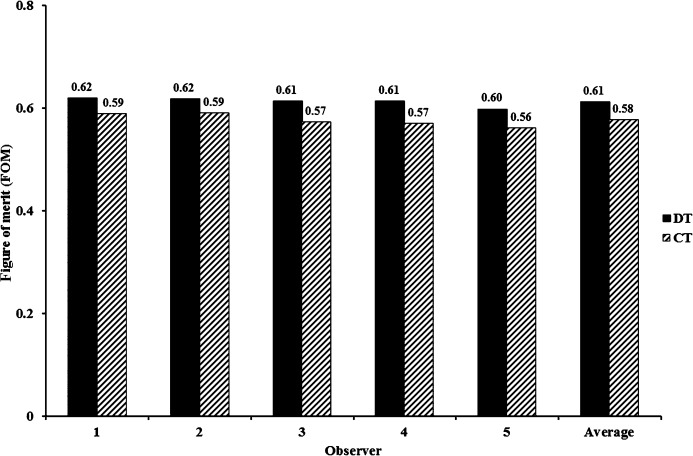
Figure 6 demonstrates the FROC curves according to the readings given by the five observers. The detectability difference between DT and CT was not statistically significant (Figure 7). The observer-averaged JAFROC FOM was 0.617 (95% CI: 0.49, 0.72) for DT and 0.5765 (95% CI: 0.46, 0.68) for CT; this difference was not statistically significant (difference: 0.0363; 95% CI: −0.18, 0.26; F=0.101; p=0.75). JAFROC analysis had sufficient sensitivity to judge the ability of DT and CT to detect the artificial pulmonary nodules. In Figure 5, the FROC curves for the three observers demonstrate that at the lower threshold of the non-lesion localisation fraction (NLF; <0.2), CT clearly outperforms DT, while at the upper threshold of NLF (>0.2) DT clearly outperforms CT. In the observer experiment, the detectability rates of DT and CT were approximately equivalent.
Figure 6.
Operating points for digital tomosynthesis and CT observations made by the five observers participating in the detection study with the corresponding free-response receiver operating characteristic curves. DT, digital tomosynthesis; LLF, lesion localisation fraction; NLF, non-lesion localisation.
Figure 7.
Jackknife free-response receiver operating characteristic figure of merit for digital tomosynthesis and CT for observers. Uncertainty bars represent 95% confidence intervals. DT, digital tomosynthesis.
Discussion
As our study demonstrates, DT provides many of the tomographic benefits provided by CT, albeit at a reduced radiation dose and cost, as well as with an approach that can be easily implemented in conjunction with chest radiography. DT overcomes the difficulties of geometric tomography by permitting reconstruction of numerous image slices from a single low-dose acquisition of image data. Although advanced methods for detecting pulmonary nodules are increasingly being emphasised for the application of DT, it also has potential for use in other areas of the thorax.
One of the unique characteristics of DT is the capability of reconstructing tomographs from multiple layers of the object under study by utilising the image data obtained during a single tomographic exposure. It also lowers the radiation dose, significantly shortens examination time and provides multiple contiguous tomographs. This facilitates identification and enables roentgenographic findings to be followed on the tomographs to gain a better understanding of their 3D distribution. In comparison with CT, DT utilises an area detector system and a flat-panel detector, enabling acquisition of a set of tomographic image data from the entire field of view in a short exposure time. It would be necessary to use statistical analysis, however, to compare DT and CT images with respect to their capability of showing the various roentgenographic manifestations of lung disease. This would clearly indicate its usefulness and ability of complementing CT, which is an already established modality in chest imaging. In addition, although we performed CT scanning on artificial pulmonary nodules in this study, we used a phantom to provide a valid statistical evaluation.
Ideally, structures in a given plane of interest should be clearly displayed in the corresponding DT reconstruction plane, whereas those located outside that plane should not be visible. Essentially, the limited angular range of the DT image acquisition geometry dictates that spatial resolution is limited in the dimension perpendicular to the detector plane. As a result, out-of-plane structures cannot be completely removed from the reconstruction plane and are always present in such planes. However, most of these structures are not visible because various low-amplitude structures from projections overlap in the reconstruction plane, causing the image to appear blurred. On the other hand, out-of-plane structures from high-attenuation features cannot be blurred and appear as multiple replicates in each reconstruction plane, except for that plane in which the actual high-attenuation feature (dorsal rib) is located. At one projection angle, these ghosting features are distributed along the line made by the X-ray source and the actual feature.
There are some limitations concerning the DT system. For example, patients undergoing this procedure are required to stand still and hold their breath firmly. In addition, DT has a limited depth resolution, which may explain the difficulty in detecting pathologies in the subpleural region and the occurrence of artefacts from medical devices [25]. Recently, low-dose CT has been acquired with less than 1 mSv [26]. Further study for comparison of low-dose DT with low-dose CT acquired at less than 1 mSv would be desirable.
With respect to images of similar-sized nodules, the contrast was greater when DT imaging was used for processing than when radiography was used [27-29]. In the observer study, there was no statistically significant difference between DT and CT; moreover, with regard to DI, CT and DT were similar. We are therefore of the opinion that the DT system has a resolution potential that is equivalent to that of CT.
There were some potential limitations in our observer study. As a result of the learning effect, the frequency with which artificial pulmonary nodules were detected by the observers increased with each reading session. This was expected, considering that the phantom model remained the same while the artificial pulmonary nodules changed in each configuration. However, this factor was corrected in the observer study design and statistical analysis model.
The observers were forewarned that the objective of the test was to detect artificial pulmonary nodules and that half the cases were normal. The study did not assess other thoracic abnormalities encountered in clinical practice, where diagnostic decisions are more complex than the mere detection of pulmonary nodules. A more stringent criterion should be investigated, especially one that would greatly lower the number of false-positive ratings and increase the sensitivity estimates. Because of the artificial nature of our study, it is necessary to compare its results with those observed in actual clinical settings. Therefore, the performance of the observers was probably optimised when compared with a physician's performance in routine clinical practice. However, this effect should not have led to bias in reporting the results of this study in favour of or against either of the systems used.
In conclusion, the advantages of DT over CT are its decreased radiation dose and the practical accessibility of examination. As a result, DT may be a useful alternative to CT as a screening method for the detection of pulmonary nodules. The results of our phantom study were probably corrected in the observer study design and statistical analysis model to facilitate use in a real clinical setting. Therefore, we hope that the DT system becomes available for clinical use in the near future.
References
- 1.Stitik FP, Tockman MS. Radiographic screening in the early detection of lung cancer. Radiol Clin N Am 1978;16:347–66 [PubMed] [Google Scholar]
- 2.Muhm JR, Miller WE, Fontana RS, Sanderson DR, Uhlenhopp MA. Lung cancer detected during a screening program using four-month chest radiographs. Radiology 1983;148:609–15 [DOI] [PubMed] [Google Scholar]
- 3.Yankelevitz DF, Reeves AP, Kostis WJ, Zhao B, Henschke CI. Small pulmonary nodules: volumetrically determined growth rates based on CT evaluation. Radiology 2000;217:251–6 [DOI] [PubMed] [Google Scholar]
- 4.Siegelman SS, Khouri NF, Leo FP, Fishman EK, Braverman RM, Zerhouni EA. Solitary pulmonary nodules: CT assessment. Radiology 1986;160:307–12 [DOI] [PubMed] [Google Scholar]
- 5.Zwirewich CV, Vedal S, Miller RR, Müller NL. Solitary pulmonary nodules: high resolution CT and radiologic-pathologic correlation. Radiology 1991;179:469–76 [DOI] [PubMed] [Google Scholar]
- 6.Murata K, Itoh H, Todo G, Kanaoka M, Noma S, Itoh T, et al. Centrilobular lesions of the lung: Demonstration by high-resolution CT and pathologic correlation. Radiology 1986;161:641–5 [DOI] [PubMed] [Google Scholar]
- 7.Webb WR. High resolution lung computed tomography. Normal anatomic and pathologic findings. Radiol Clin North Am 1991;29:1051–63 [PubMed] [Google Scholar]
- 8.Miller ER, McCurry EM, Hruska B. An infinite number of laminagrams from a finite number of radiographs. Radiology 1971;98:249–55 [DOI] [PubMed] [Google Scholar]
- 9.Grant DG. Tomosynthesis: A three-dimensional radiographic imaging technique. IEEE Trans Biomed Eng 1972;19:20–8 [DOI] [PubMed] [Google Scholar]
- 10.Baily NA, Lasser EC, Crepeau RL. Electrofluoro-plangigraphy. Radiology 1973;107:669–71 [DOI] [PubMed] [Google Scholar]
- 11.Kruger RA, Nelson JA, Ghosh-Royo D, Miller FJ, Anderson RE, Liu PY. Dynamic tomographic digital subtraction angiography using temporal filtration. Radiology 1983;147:863–7 [DOI] [PubMed] [Google Scholar]
- 12.Sone S, Kasuga T, Sakai F, Aoki J, Izuno I, Tanizaki Y, et al. Development of a high-resolution digital tomosynthesis system and its clinical application. Radiographics 1991;11:807–22 [DOI] [PubMed] [Google Scholar]
- 13.Sone S, Kasuga T, Sakai F, Kawai T, Oguchi K, Hirano H, et al. Image processing in the digital tomosynthesis for pulmonary imaging. Eur Radiol 1995;5:96–101 [Google Scholar]
- 14.Sabol JM. A Monte Carlo estimation of effective dose in chest tomosynthesis. Med Phys 2009;36:5480–7 [DOI] [PubMed] [Google Scholar]
- 15.Dobbins JT, III, Godfrey DJ. Digital X-ray tomosynthesis: current state of the art and clinical potential. Phys Med Biol 2003;48:R65–106 [DOI] [PubMed] [Google Scholar]
- 16.Tapiovaara M, Siiskonen T. A Monte Carlo program for calculating patient doses in medical x-ray examinations. 2nd edn. Report no. STUK-A231 Helsinki, Finland: STUK; 2008 [Google Scholar]
- 17.ImPACT ImPACT's CT dosimetry tool: CT dosimetry version 1.0.4 London, UK: St George's Healthcare NHS Trust [cited 1 April 2008] Available from: http://www.impactscan.org/ctdosimetry.htm [Google Scholar]
- 18.Gomi T, Hirano H. Clinical potential of digital linear tomosynthesis imaging of total joint arthroplasty. J Digit Imaging 2008;21:312–22 [DOI] [PMC free article] [PubMed] [Google Scholar]
- 19.Internal Commission on Radiation Units and Measurements (ICRU) Medical imaging: the assessment of image quality. ICRU report no. 54 Bethesda, MD: ICRU; 1996 [Google Scholar]
- 20.Richard S, Siewerdsen JH, Jaffray DA, Moseley DJ, Bakhtiar B. Generalized DQE analysis of radiographic and dual-energy imaging using flat-panel detectors. Med Phys 2005;32:1397–413 [DOI] [PubMed] [Google Scholar]
- 21.Södra Älvsborgs Sjukhus. ViewDEX 2.0. [cited] 2009; 5 October 2009. Available from http://sas.vgregion.se/sas/vieiod.ex. [Google Scholar]
- 22.Ruschin M, Timberg P, Bath M, Hemdal B, Svahn T, Saunders RS, et al. Dose dependence of mass and microcalcification detection in digital mammography: free response human observer studies. Med Phys 2007;34:400–7 [DOI] [PMC free article] [PubMed] [Google Scholar]
- 23.Chakraborty DP. Analysis of location specific observer performance data: validated extensions of the jackknife free-response (JAFROC) method. Acad Radiol 2006;13:1187–93 [DOI] [PubMed] [Google Scholar]
- 24.Chakraborty DP. JAFROC software 2.3a [cited 17 April 2008]. Available from: http://www.devchakraborty.com. [Google Scholar]
- 25.Johnsson AA, Vikgren J, Svalkvist A, Zachrisson S, Flinck A, Boijsen M, et al. Overview of two years of clinical experience of chest tomosynthesis at Sahlgrenska University Hospital. Radiat Prot Dosimetry 2010;139:124–9 [DOI] [PubMed] [Google Scholar]
- 26.Veronesi G, Bellomi M, Mulshine JL, Pelosi G, Scangatta P, Paganelli G, et al. Lung cancer screening with low-dose computed tomography: A non-invasive diagnostic protocol for baseline lung nodules. Lung Cancer 2008;61:340–9 [DOI] [PubMed] [Google Scholar]
- 27.Vikgren J, Zachrisson S, Svalkvist A, Johnsson AA, Boijsen M, Flinck A, et al. Comparison of chest tomosynthesis and chest radiography for detection of pulmonary nodules: human observer study of clinical cases. Radiology 2008;249:1034–41 [DOI] [PubMed] [Google Scholar]
- 28.Zachrisson S, Vikgren J, Svalkvist A, Johnsson AA, Boijsen M, Flinck A, et al. Effect of clinical experience of chest tomosynthesis on detection of pulmonary nodules. Acta Radiol 2009;50:884–91 [DOI] [PubMed] [Google Scholar]
- 29.Dobbins JT, III, Mcadams HP, Song JW, Li CM, Godfrey DJ, Delong DM, et al. Digital tomosynthesis of the chest for lung nodule detection: interim sensitivity results from an ongoing NIH-sponsored trial. Med Phys 2008;35:2554–7 [DOI] [PMC free article] [PubMed] [Google Scholar]


