Abstract
Objective
The quantitative parameters in the contrast-enhanced ultrasonography time–intensity curve of hepatocellular carcinoma (HCC) were studied to explore their possible implication for histological grading of HCC.
Methods
A total of 130 HCC patients (115 males and 15 females; age: 48.13±11.00 years) were studied using contrast-enhanced ultrasonography time–intensity curve and histological pathology. The quantification software Sonoliver® (TomTec Imaging Systems, Unterschleissheim, Germany) was applied to derive time–intensity curves of regions of interest in the interior of HCCs and in reference. Quantitative parameters of 115 patients were successfully obtained, including maximum of intensity (IMAX), rise time (RT), time to peak (TTP), rise slope (RS) and washout time (WT). Histological grading of HCC was performed using haematoxylin–eosin staining, and monoclonal antibodies specific for smooth muscle actin were used to observe unpaired arteries (UAs).
Results
There were significant differences among WTs in the three differentiated HCC groups (p<0.05). However, there were no significant differences among RT, TTP, RS and IMAX in the differentiated HCC groups. Moreover, the number of UAs in the differentiated HCC groups showed no statistical significance.
Conclusion
WT plays an important role in predicting well, moderately and poorly differentiated HCC.
The majority of hepatocellular carcinomas (HCCs) develop through multistep hepatocarcinogenesis [1]. Various types of hepatocellular nodules are seen in cirrhotic livers. The International Working Party of the World Congress of Gastroenterology classifies hepatocellular nodules into six types: regenerative nodules, low-grade dysplastic nodules, high-grade dysplastic nodules, well-differentiated HCC, moderately differentiated HCC and poorly differentiated HCC. The histopathological grades and types constitute well-established prognostic factors [2]. Thus, early diagnosis and confirmation of the type of hepatocellular nodules present and cellular differentiation before treatment are important.
Although definite differentiation among HCC by imaging is usually impossible, the relationship between tumour cellular differentiation and image findings has been studied using contrast-enhanced (CE) CT, CEMRI and CE ultrasonography (CEUS). Tumour pathological differentiation correlates well with image findings [,3−8].
Dynamic CEUS during the past decade has noticeably improved the detection and characterisation of focal liver lesions [9]. A previous study showed that CEUS and spiral CT provided a similar diagnostic accuracy in the characterisation of focal liver lesion [10]. The appearance of HCC on CEUS has also been described well. Current low-mechanical-index techniques for CEUS using second-generation microbubble agents have advantages in characterising HCC, including real-time demonstration of continuous haemodynamic changes in both the liver and hepatocellular nodules. Some studies postulated that variations of enhancement patterns may be related to the pathological function of HCC [,5−8]. Moderately differentiated HCCs generally show classic enhancement features, with presence of hypervascularity in the arterial phase and washout during the portal phase, whereas well and poorly differentiated tumours account for most atypical variations in the arterial phase and portal venous phase [7].
Reports assessing hepatocellular nodules have been based on visual analysis, despite the disadvantages of interobserver variability and low reproducibility of results. Although quantitative analysis CEUS perfusion provides more objective, reliable and reproducible results [11], the time–intensity curve (TIC) of CEUS has been obtained by quantification software for offline analysis [,12−14], from which a series of semi-quantitative perfusion parameters is extracted and analysed. An analysis of the parameters of TIC in HCC has proven the correlation of CEUS with unpaired arteries (UAs) in HCC [14]. In the present study, we compare the quantitative parameters in CEUS and UAs in different pathological gradings of HCCs to explore their possible implication for histological grading of HCC.
Methods and materials
Patients
The study of CEUS was approved by our institutional ethics committee, and all subjects gave informed written consent. Between April 2005 and July 2009, 130 patients (115 males and 15 females; age range 15–75 years, mean ± standard deviation 48.13±11.00 years) were included in this study. The patients underwent CECT or CEMRI and CEUS, AFP, liver function test and so on within 7 days, and full discussions by our multidisciplinary treatment team, which included radiologists, surgeons, hepatologists and oncologists. The patients were classified according to the Chinese staging proposed by the Chinese Society of Liver Cancer (CSLC) [15]. Among them, 80 patients were Stage I (Ia: 30 patients; Ib: 50 patients) and 50 patients were Stage II (IIa: 43 patients; IIb: 7 patients). All patients underwent hepatic resection based on guidelines of diagnosis and therapy for liver cancer drawn up by the CSLC [16] and were confirmed pathologically to have HCC at our hospital.
Our inclusion criteria were: (1) patients with single nodule treated with liver resection and confirmed to have HCC histologically; and (2) no contra-indication for CEUS. We excluded three patients with two or more nodules and six patients who underwent chemotherapy, interventional therapy or local treatment that might affect the quantitative parameters. We also excluded six patients with heavy respiratory motions that led to a mismatch between the raw data and CEUS TIC. Therefore, a total of 115 HCC patients were enrolled in the present study with the maximum dimension ranging from 1.0 to 14.0 cm (mean ± standard deviation 5.15±2.53 cm).
Ultrasonography protocol, contrast agent and injection technique
Patients were examined using a Sequoia scanner (Siemens-Acuson, Mountain View, CA) with a curved 4C1 transducer (between 1.0 and 4.0 MHz) and Cadence contrast pulse sequencing software (Siemens-Acuson). An intravenous bolus injection of 2.4 ml of SonoVue® (Bracco, Milan, Italy) was used, followed by a flush of 5 ml of saline. First, baseline ultrasound was performed to scan the whole liver and determine the optimum scanning section. The lesion characteristics were clearly shown with the baseline ultrasound, and the size, echogenicity, shape and boundary of lesions were recorded. Real-time CEUS using low mechanical index (between 0.17 and 0.19) was initiated as soon as the bolus injection of contrast agent was injected; afterwards, this was terminated when the contrast disappeared approximately 5−7 min after injection. The probe was kept stable to maintain the lesion in the area of examination throughout the first 80 s after injection. A breath-hold was obtained during the arterial phase (0–30 s after contrast injection) to avoid the strong motion of lesions. The whole tumour was scanned intermittently every 15 s until the contrast agent disappeared, for diagnosis of liver nodules. Images and clips were stored in DICOM (Digital Imaging and Communications in Medicine) format on a hard disk for offline analysis [14].
Quantitative analysis in contrast-enhanced ultrasonography
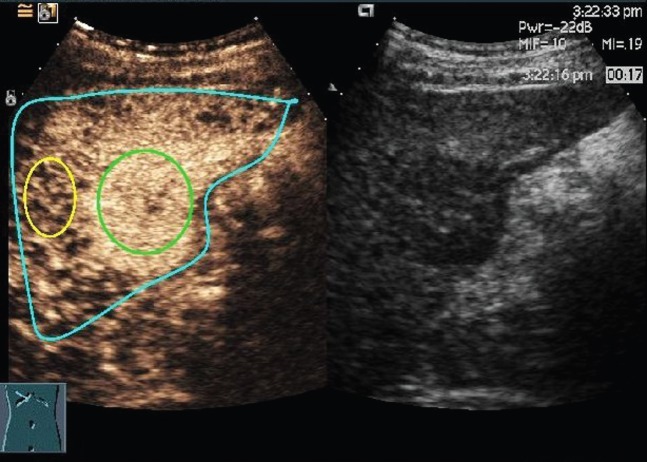
Retrospectively, Sonoliver® quantification software (TomTec Imaging Systems, Unterschleissheim, Germany) was applied to derive the enhancement curves of different patients. This software is designed for real-time evaluation of tissue perfusion obtained by CEUS examination. The software also provides an objective quantification of perfusion parameters. Regions of interest (ROIs) were defined in the interior of HCCs corresponding to no less than 20% of the whole mass from the frame corresponding to the best identification of the lesion during arterial phase; doing so helped to avoid large vessels, necroses and the edge of HCC nodules (Figure 1). The ROIs in reference tissues were defined as the peripheral parenchyma near the same depth as those of the nodules, and all ROIs were drawn more than 100 pixels. All considered signals were derived from echo-power values that were estimated following log-compressed video images used for best-fit quantification, and echo-signal quantification was initiated as soon as microbubbles were visualised by eliminating the baseline frames, after which the signals were smoothed with a parametric model for bolus kinetics. A modified log-normal distribution was used for best-fit optimisation [14]. The respiratory motions were corrected by automatic motion compensation of the software.
Figure 1.
Screenshot of Sonoliver® (TomTec Imaging Systems, Unterschleissheim, Germany) and the native sequence of contrast-enhanced ultrasonography image in the arterial phase of hepatocellular carcinoma in segment 6. Three regions of interest (ROIs) are drawn: a blue ROI delimiting the region where motion compensation is applied, a reference ROI (yellow) and an analysis ROI (green).
The parameters obtained in this study included: maximum intensity (IMAX), which was the percentage ratio of intensity of ROIs in HCCs and ROIs in reference tissues at the highest point of the perfusion process; rise time (RT), 10% to 90% of IMAX; time to peak (TTP); rise slope (RS); quality of fit between the raw data and theoretical curve; and washout time (WT), the duration between IMAX and the point of TICs in HCCs meeting with that in references (Figure 2).
Figure 2.
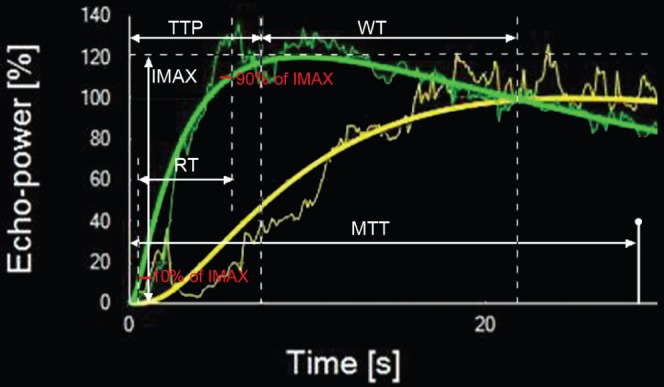
Quantitative parameters are defined. The output time–intensity curves hepatocellular carcinoma of (HCC) (in green) and peripheral parenchyma (in yellow) are nearly of the same depth as those of HCC. Slim curves correspond to raw video signal intensity, and heavy curves are smoothed using the bolus parametric model. IMAX, maximum intensity; MTT, mean transit time; RT, rise time; TTP, time to peak; WT, washout time.
Histopathology analysis
Formalin-fixed, paraffin-embedded tissues (encompassing carcinoma and adjacent liver tissue) were sectioned to a thickness of 5 μm and processed for immunohistochemistry and haematoxylin–eosin staining. After undergoing incubation overnight at 4 °C with mouse monoclonal antibodies against smooth muscle actin (SMA; ZSGB-BIO, Beijing, China; 1:100 dilution), immunostaining was performed using the Envision System with diaminobenzidine. A negative control was obtained by replacing the primary antibody with normal mouse immunoglobin G.
A liver pathologist (MYC) performed the histological grading and immunohistochemistry analysis. Histological grading was performed from haematoxylin–eosin staining, and HCCs were classified into three histological degrees: well differentiated, moderately differentiated and poorly differentiated.
The number of UAs was also evaluated. UAs were identified as thick-walled vessels that stained positively for SMA in their thick tunica media. They exhibited a greater than 1:10 ratio of medial layer thickness to external diameter, excluding venous structures located in the tumour parenchyma, and were not accompanied by fibrous tissue or bile ducts [17]. UAs were counted in five fields of view at high magnification (×200) within hot spots (the most SMA-stained areas).
Statistical analysis
Statistical analyses were performed using SPSS® v. 13.0 (SPSS Inc., Chicago, IL). All data were described as mean±standard deviation. A paired t-test was used both in the comparison of quantitative parameters in ROIs of HCC and in peripheral reference tissue. Statistical significance was evaluated using one-way analysis of variation (ANOVA) for the comparison of parameters of the different histological gradings of HCCs. A least-significant difference test was used if equal variances were assumed, and Dunnett's T3 test was used if equal variances were not assumed. A value of p<0.05 indicated statistical significance.
Results
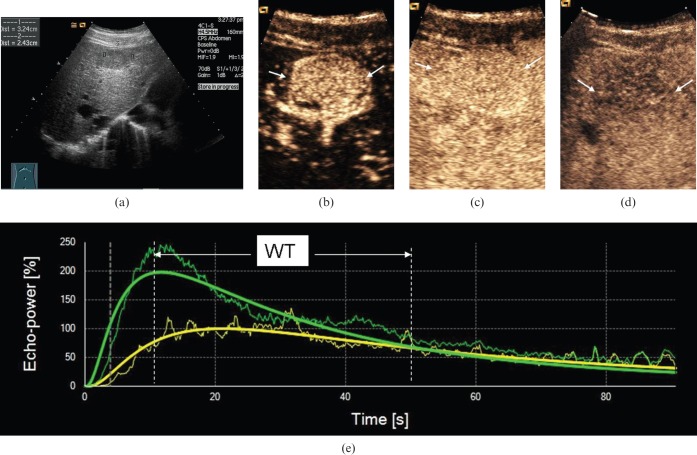
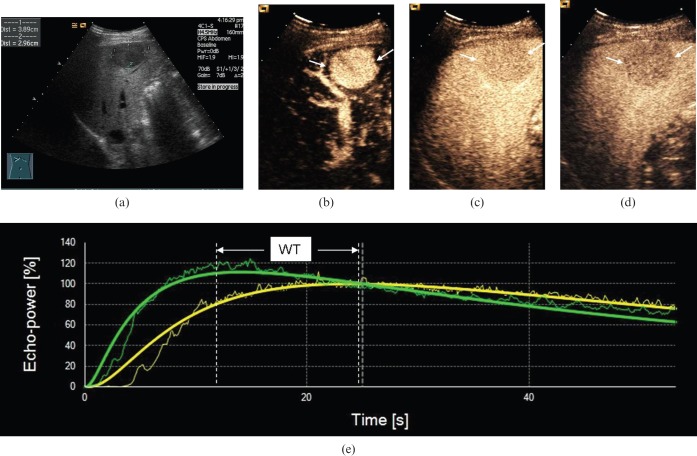
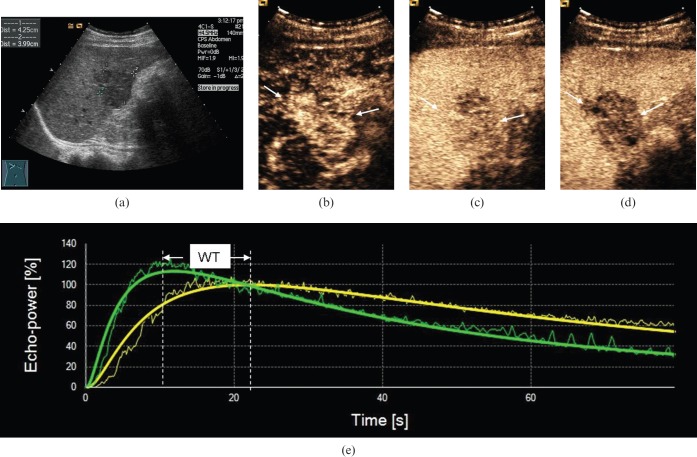
The pathological differentiation of all HCCs were as follows: well-differentiated HCCs (Figure 3) in 18 lesions with diameters ranging from 2.5 to 10.0 cm (5.37±2.27 cm); moderately differentiated HCCs (Figure 4) in 59 lesions with diameters ranging from 1.0 to 14.0 cm (4.93±2.70 cm); and poorly differentiated HCCs (Figure 5) in 38 lesions with diameters ranging from 1.4 to 9.5 cm (5.40±2.39 cm).
Figure 3.
Ultrasound scans in a 59-year-old male with well-differentiated hepatocellular carcinoma (HCC). (a) Greyscale sonography image showing a hypo-echoic nodule with a diameter of 3.2 cm. (b) Arterial phase scan at 19 s showing markedly hypervascular nodule (arrows). (c) Portal phase scan at 90 s showing homogeneous persistent positive enhancement of nodule (arrows) compared with parenchyma. (d) Late phase scan at 210 s showing hypo-enhancement of nodule (arrows). (e) Output time–intensity curves of HCC (in green) and reference (in yellow) showing that washout time (WT) in the well-differentiated HCC was long (WT=40 s).
Figure 4.
Ultrasound scans in a 54-year-old male with moderately differentiated hepatocellular carcinoma (HCC). (a) Greyscale sonography image showing a hypo-echoic nodule 3.9 cm in diameter. (b) Arterial phase scan at 16 s showing markedly hypervascular nodule (arrows). (c) Portal phase scan at 60 s showing hypoenhancement (arrows) compared with parenchyma. (d) Late phase scan at 140 s showed hypo-enhancement (arrows). (e) Output time–intensity curves of HCC (in green) and reference (in yellow) showing that washout time (WT) in the moderately differentiated HCC was medium (WT=20 s).
Figure 5.
Ultrasound scans in a 51-year-old male with poorly differentiated hepatocellular carcinoma (HCC). (a) Greyscale sonography image showed a hypo-echoic nodule 4.3 cm in diameter. (b) Arterial phase scan at 18 s showing markedly hypervascular nodule (arrows). (c) Portal phase scan at 90 s showing hypo-enhancement (arrows) compared with parenchyma. (d) Late phase scan at 140 s showing hypo-enhancement (arrows). (e) Output time–intensity curves of HCC (in green) and peripheral parenchyma (in yellow) showing that washout time (WT) in the poorly differentiated HCC was fast (WT=12 s).
The quality of fit values of ROI in both HCC lesions and peripheral parenchyma were greater than 80%. All HCC lesions showed rapid enhancement in the arterial phase. The IMAX and RS of HCC lesions were higher than those of peripheral parenchyma (p<0.05). The RT and TTP of HCC were shorter than those of peripheral parenchyma (p<0.05). Among the 115 HCCs evaluated, 97 (84.35%) CEUS TICs crossed with those of the references (WT: 12.40±1.27 s); they were also hypo-enhanced in the portal venous and late phases. The other 18 (15.65%) CEUS TICs did not cross with the references and remained enhanced (slight hyperenhancement or iso-enhancement) in the portal phase and the late phase. Table 1 shows the quantitative parameters in the ROIs of 115 HCCs, as well as the peripheral reference tissues.
Table 1. Quantitative parameters in the regions of interest (ROIs) of 115 hepatocellular carcinomas (HCCs) and peripheral reference tissues.
| ROI | IMAX (%) | RT (s) | TTP (s) | RS | QOF |
| HCC | 121.58±47.93 | 13.16±4.59 | 13.87±4.84 | 9.80±2.27 | 85.73±7.06 |
| Reference | 100 | 23.32±10.01 | 26.27±10.69 | 4.19±1.30 | 88.37±5.98 |
| T | 4.827 | 13.259 | 15.463 | 11.858 | 3.497 |
| p | 0.000 | 0.000 | 0.000 | 0.000 | 0.001 |
IMAX, maximum intensity; QOF, quality of fit between the raw data and theoretical curve; RS, rise slope; RT, rise time; TTP, time to peak.
Table 2 shows quantitative parameters in the ROIs of the three groups in differentiated HCCs and peripheral reference tissues. As shown in the table, WT in the well-differentiated HCCs was longest, and WT in the poorly differentiated HCCs was shortest. There were significant differences among WTs in the three differentiated HCC groups (p=0.04), whereas there were no significant differences among other parameters in the three differentiated HCC groups.
Table 2. Quantitative parameters in the regions of interest (ROIs) of 115 hepatocellular carcinomas (HCCs) and peripheral reference tissues according to the three differentiated HCC groups.
| ROI | n | IMAX1 (%) | RT1 (s) | TTP1 (s) | RS1 | IMAX2 (%) | RT2 (s) | TTP2 (s) | RS2 | WT (s) |
| Group 1 | 18 | 139.15±45.04 | 12.66±4.27 | 13.28±4.22 | 11.01±5.69 | 100 | 21.40±6.47 | 25.43±8.14 | 4.38±1.68 | 36.66±9.61a |
| Group 2 | 59 | 118.45±32.53 | 13.37±5.21 | 14.06±5.56 | 9.72±4.63 | 100 | 23.70±9.53 | 26.66±10.14 | 4.20±1.30 | 19.37±2.83b |
| Group 3 | 38 | 118.10±31.50 | 13.07±3.71 | 13.87±3.91 | 9.36±4.03 | 100 | 23.63±6.59 | 26.01±6.87 | 4.10±1.11 | 11.61±2.78c |
| p | 0.529 | 0.843 | 0.820 | 0.547 | 0.454 | 0.893 | 0.746 | 0.039 |
IMAX, maximum intensity of HCC; RS, rise slope; RT, rise time of HCC; TTP, time to peak of HCC; WT, washout time. IMAX1, RT1, TTP1 and RS1 show the parameters of HCC. IMAX2, RT2, TTP2 and RS2 show the parameters of peripheral reference tissue, and IMAX2 is constant.
Group 1, Group 2 and Group 3 correspond to well-differentiated, moderately differentiated and poorly differentiated HCCs, respectively.
aGroup 1 vs Group 2, p=0.011.
bGroup 2 vs Group 3, p=0.004.
cGroup 1 vs Group 3, p=0.000.
The immunohistochemical staining of SMA was successful in 82 HCCs, for which the number of UAs was 43.52±23.17 (Figure 6). Neo-arterisation in HCC was similar in size, and the basement membrane of pericytes surrounding endothelial cells in HCC exhibited strong positive SMA expression. The numbers of UAs in different grades were 46.70±36.35 for well-differentiated HCCs (n=10), 45.36±18.40 for moderately differentiated HCCs (n=44) and 41.64±24.86 for poorly differentiated HCCs (n=28; p=0.755).
Figure 6.
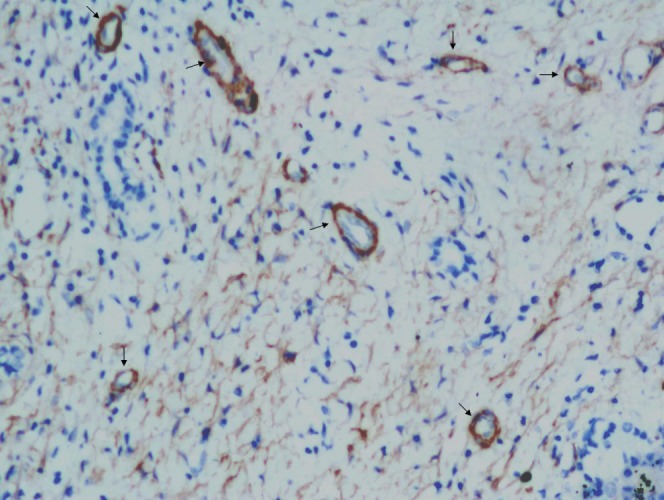
Representative section of hepatocellular carcinoma that was immunohistochemically stained for SMA (×200, arrows).
Discussion
With the development of modern imaging techniques, we can evaluate the intratumoral vascularity and haemodynamic changes of tumour blood flow not only with CECT or CEMRI, but also with the newly developed CEUS. In using low-mechanical-index CEUS, the perfusion patterns of HCCs are not only useful for definitive diagnosis, but can also provide histopathological information non-invasively [,5−7]. In the present study, related quantitative parameters were extracted from CEUS TIC. At the same time, TIC from ROIs yielded a complex shape that has been applied to tumours in an attempt to compare the echoes in ROIs of analysis and reference. The majority of TICs in HCCs showed classic enhancement features of arterial phase hyperenhancement (100%, 115 of 115) and hypo-enhancement in the portal and late phases (84.35%, 97 of 115). This observation is consistent with early reports [9,10] indicating that HCC had a predominantly arterial input, whereas normal liver had a predominantly portal input. To our knowledge, HCC is a hypervascular tumour, and neo-angiogenesis plays an important role in its growth and progression. In terms of hepatocarcinogenesis, as a result of a marked increase in neo-vascularised arteries, arterial blood flow becomes dominant. The number of UAs and the degree of sinusoidal capillarisation were substantially greater in HCCs than in cirrhotic nodules or low- to high-grade dysplastic nodules [17]. In the current study, abundant intratumoral arterioles were also detected in HCC with the help of SMA immunohistochemistry.
A correlation exists between the blood supply and the grade of malignancy of hepatocellular nodules in radiological and pathological analyses [18,19]. According to the analyses by CT during arterial portography and hepatic arteriography, in accordance with the elevation of the grade of malignancy of the nodules, the portal tract decreased, including normal portal vein and hepatic artery (intranodular arterial supply through normal hepatic arteries). On the other hand, abnormal artery (intranodular arterial supply through newly formed abnormal arteries) gradually increased [19]. Compared with well-differentiated HCC and poorly differentiated HCC, more moderately differentiated HCCs showed considerable hyperattenuation or hazy alternation, according to another study using CT and pathology [18]. But only the enhancement pattern of CECT was compared without evaluating the physiological characteristics of tumour angiogenesis by quantification of the perfusion parameters of tumour functional CT.
A published report showed that RT, TTP, RS and IMAX were associated with the number of UAs considering RT, TTP and RS reflected the contrast agent arrival velocity, and IMAX reflected the blood flow [14]. Current data showed that there were no significant differences between RT, TTP, RS and IMAX of HCCs in three histological gradings. Furthermore, there were no significant differences between UAs of HCCs in different histological gradings. The inflow of nodules generally changes from a mainly portal supply to an exclusively arterial supply during multistep hepatocarcinogenesis; in addition, intranodular blood supply is considered valuable in predicting the prognosis in borderline lesions in cirrhotic livers [20]. Our present results suggest that the vascularity of overt HCC with different histological gradings tends to accord with the parameters of CEUS and pathology. The finding of the present study is in agreement with a previous study which showed that there was no significant difference between hyperenhancing and hypo-enhancing or iso-enhancing lesions of different cellular differentiation in the arterial and portal phase [6]. However, another study described 112 HCCs and reported that the distribution of relative arterial vascularity differed significantly between groups based on pathological review. Their hypervascularity was more associated with moderately differentiated tumours (77 of 112) than with well-differentiated (23 of 112) or poorly differentiated tumours (12 of 112) [7]. Quantitative analysis CEUS perfusion used in the present study may be more objective and reliable than the visual analysis of others. Visual analysis is not accurate enough, because the eyes of observers usually focus on a particular portion of the lesion, whereas quantitative analysis allows a comparison of the echogenicity of the tumour and of the adjacent liver in a more global and reproducible manner. The diagnostic performances of visual analysis and quantitative analysis also differ significantly (p=0.01) [11].
There was a significant difference among WTs in the three differentiated HCC groups (p<0.05), and WT of the poorly differentiated HCC was faster than the two other types. The findings of our current work are in line with those of earlier reports using CEUS for assessing the vascular pattern of different histological HCCs [6,8]. This suggests that the timing of HCC becomes hypo-enhancing on CEUS and is correlated with tumour pathological differentiation; furthermore, well-differentiated tumours wash out more slowly than poorly differentiated ones. A previous study reported iso-echoic lesions in the late phase (30 HCCs; 28.8%), which significantly differed from hypo-echoic lesions (74 HCCs; 71.2%; p<0.05), had a significant probability of better differentiation [5]. Thus, an incomplete transition of drainage blood flow during multistep hepatocarcinogenesis may have occurred. Based on radiological appearances, histopathological features and microangioarchitecture of 46 surgically resected hepatocellular nodules, a previous study reported that the drainage vessels of HCC change from hepatic veins to hepatic sinusoids, and then to portal veins during multistep hepatocarcinogenesis [1]. In the present study, WT is surmised to closely correlate with the histological changes of drainage vessels. Well-differentiated HCCs probably remained the same mostly when hepatic veins flowed, whereas main drainage vessels may be changed from hepatic veins to surrounding hepatic sinusoids, and then to portal veins in moderately and poorly differentiated HCCs. WT in well-differentiated HCCs was longer than moderately and poorly differentiated HCCs (p<0.05).
There were some limitations in the present study. First, imprecise correlation between the imaging plane and histological section could have occurred, affecting the correlation of quantitative parameters and neo-angiogenesis. However, we do not believe that these factors negate the new concept proposed in our study. Second, we did not examine the continuities between intranodular and extranodular vascular structures on serial slices using double immunostaining with CD34 and SMA to clarify the correlation between quantitative parameters of CEUS and extranodular drainage vessels at the border of HCCs.
Conclusions
Quantitative CEUS TIC parameters (namely RT, TTP, RS and IMAX of HCC in varied pathological differentiations) indicate no statistical significance, reflecting the arterial input function and blood flow of HCC. Given that WT is correlated with tumour pathological differentiation, it is more important to use WT in predicting histological grading of HCC than any other parameter.
References
- 1.Kitao A, Zen Y, Matsui O, Gabata T, Nakanuma Y. Hepatocarcinogenesis: multistep changes of drainage vessels at CT during arterial portography and hepatic arteriography–radiologic-pathologic correlation. Radiology 2009;252:605–14 [DOI] [PubMed] [Google Scholar]
- 2.Minagawa M, Ikai I, Matsuyama Y, Yamaoka Y, Makuuchi M. Staging of hepatocellular carcinoma: assessment of the Japanese TNM and AJCC/UICC TNM systems in a cohort of 13,772 patients in Japan. Ann Surg 2007;245:909–22 [DOI] [PMC free article] [PubMed] [Google Scholar]
- 3.Sakabe K, Yamamoto T, Kubo S, Hirohashi K, Hamuro M, Nakamura K, et al. Correlation between dynamic computed tomographic and histopathological findings in the diagnosis of small hepatocellular carcinoma. Dig Surg 2004;21:413–20 [DOI] [PubMed] [Google Scholar]
- 4.Amano S, Ebara M, Yajima T, Fukuda H, Yoshikawa M, Sugiura N, et al. Assessment of cancer cell differentiation in small hepatocellular carcinoma by computed tomography and magnetic resonance imaging. J Gastroenterol Hepatol 2003;18:273–9 [DOI] [PubMed] [Google Scholar]
- 5.Nicolau C, Catalá V, Vilana R, Gilabert R, Bianchi L, Solé M, et al. Evaluation of hepatocellular carcinoma using SonoVue, a second generation ultrasound contrast agent: correlation with cellular differentiation. Eur Radiol 2004;14:1092–9 [DOI] [PubMed] [Google Scholar]
- 6.Liu GJ, Xu HX, Lu MD, Xie XY, Xu ZF, Zheng YL, et al. Correlation between enhancement pattern of hepatocellular carcinoma on real-time contrast-enhanced ultrasound and tumour cellular differentiation on histopathology. Br J Radiol 2007;80:321–30 [DOI] [PubMed] [Google Scholar]
- 7.Jang HJ, Kim TK, Burns PN, Wilson SR. Enhancement patterns of hepatocellular carcinoma at contrast-enhanced US: comparison with histologic differentiation. Radiology 2007;244:898–906 [DOI] [PubMed] [Google Scholar]
- 8.Fan ZH, Chen MH, Dai Y, Wang YB, Yan K, Wu W, et al. Evaluation of primary malignancies of the liver using contrast-enhanced sonography: correlation with pathology. AJR Am J Roentgenol 2006;186:1512–9 [DOI] [PubMed] [Google Scholar]
- 9.Claudon M, Cosgrove D, Albrecht T, Bolondi L, Bosio M, Calliada F, et al. Guidelines and good clinical practice recommendations for contrast enhanced ultrasound (CEUS)—update 2008. Ultraschall Med 2008;29:28–44 [DOI] [PubMed] [Google Scholar]
- 10.Catala V, Nicolau C, Vilana R, Pages M, Bianchi L, Sanchez M, et al. Characterization of focal liver lesions: comparative study of contrast-enhanced ultrasound versus spiral computed tomography. Eur Radiol 2007;17:1066–73 [DOI] [PubMed] [Google Scholar]
- 11.Quaia E, Palumbo A, Rossi S, Degobbis F, Cernic S, Tona G, et al. Comparison of visual and quantitative analysis for characterization of insonated liver tumors after microbubble contrast injection. AJR Am J Roentgenol 2006;186:1560–70 [DOI] [PubMed] [Google Scholar]
- 12.Huang-Wei C, Bleuzen A, Bourlier P, Roumy J, Bouakaz A, Pourcelot L, et al. Differential diagnosis of focal nodular hyperplasia with quantitative parametric analysis in contrast-enhanced sonography. Invest Radiol 2006;41:363–8 [DOI] [PubMed] [Google Scholar]
- 13.Guibal A, Taillade L, Mulé S, Comperat E, Badachi Y, Golmard JL, et al. Noninvasive contrast-enhanced US quantitative assessment of tumor microcirculation in a murine model: effect of discontinuing anti-VEGF therapy. Radiology 2010;254:420–9 [DOI] [PubMed] [Google Scholar]
- 14.Pei XQ, Liu LZ, Zheng W, Cai MY, Han F, He JH, et al. Contrast-enhanced ultrasonography of hepatocellular carcinoma: correlation between quantitative parameters and arteries in neoangiogenesis or sinusoidal capillarization. Eur J Radiol; 2011;81:e182–8 [DOI] [PubMed] [Google Scholar]
- 15.Yang BH, Xia JL. Clinical diagnosis and staging rules and illustration. Tumor Jan 2002;22:75 [Google Scholar]
- 16.Chinese Expert Consensus Statement Chinese Society of Liver Cancer Guidelines of diagnosis and therapy for liver cancer. Chinese Hepatology 2009;14:237–45 [Google Scholar]
- 17.Park YN, Yang CP, Fernandez GJ, Cubukcu O, Thung SN, Theise ND. Neoangiogenesis and sinusoidal “capillarization” in dysplastic nodules of the liver. Am J Surg Pathol 1998;22:656–62 [DOI] [PubMed] [Google Scholar]
- 18.Tajima T, Honda H, Taguchi K, Asayama Y, Kuroiwa T, Yoshimitsu K, et al. Sequential hemodynamic change in hepatocellular carcinoma and dysplastic nodules: CT angiography and pathologic correlation. AJR Am J Roentgenol 2002;178:885–97 [DOI] [PubMed] [Google Scholar]
- 19.Asayama Y, Yoshimitsu K, Nishihara Y, Irie H, Aishima S, Taketomi A, et al. Arterial blood supply of hepatocellular carcinoma and histologic grading: radiologic-pathologic correlation. AJR Am J Roentgenol 2008;190:28–34 [DOI] [PubMed] [Google Scholar]
- 20.Hayashi M, Matsui O, Ueda K, Kawamori Y, Gabata T, Kadoya M. Progression to hypervascular hepatocellular carcinoma: correlation with intranodular blood supply evaluated with CT during intraarterial injection of contrast material. Radiology 2002;225:143–9 [DOI] [PubMed] [Google Scholar]


