Abstract
Bilateral temporal lobe hyperintensity (BTH) is a commonly encountered MRI finding in a wide spectrum of clinical conditions and often poses a diagnostic challenge to the radiologist. The purpose of this paper is to elucidate several diseases that manifest as BTH on MRI, based on a retrospective review of cranial MRI of 65 cases seen in our institution between October 2007 and September 2010. We found BTH in different clinical scenarios that included infective diseases (herpes simplex virus, congenital cytomegalovirus infection), epileptic syndrome (mesial temporal sclerosis), neurodegenerative disorders (Alzheimer's disease, frontotemporal dementia, Type 1 myotonic dystrophy), neoplastic conditions (gliomatosis cerebri), metabolic disorders (mitochondrial encephalopathy, lactic acidosis and stroke-like episodes, Wilson's disease, hyperammonemia), dysmyelinating disease (megalencephalic leukoencephalopathy with subcortical cysts), and vascular (cerebral autosomal dominant arteriopathy with subcortical infarcts and leukoencephalopathy) and paraneoplastic (limbic encephalitis) disorders. The conventional MRI findings with advanced MRI such as diffusion-weighted imaging, susceptibility-weighted imaging and MR spectroscopy along with laboratory results are potentially helpful in distinguishing the different clinical conditions and thus affect the early diagnosis and clinical outcome.
MRI is the most sensitive imaging technique to depict brain lesions as altered signal intensities. Most of the lesions are demonstrated as hyperintensities on T2 weighted and fluid-attenuated inversion-recovery (FLAIR) MR images, and the signal intensity itself is non-specific. Characteristic distribution of lesions and associated imaging findings, however, can suggest the diagnosis or narrow the differential diagnosis. Bilateral temporal lobe hyperintensity (BTH) is a commonly observed finding on MRI in different neurological disorders. We considered BTH as increased signal intensity on T2 weighted or FLAIR MR images involving the grey or white matter or both. Compared with fast spin-echo T2 weighted sequence, FLAIR has greater sensitivity for detection of BTH because of suppression of the cerebrospinal fluid (CSF) signal with preservation of T2 characteristics [1]. Several neurological disorders have a distinctive propensity to involve the temporal lobes. The spectrum includes infective, epileptic syndrome, neurodegenerative, neoplastic, metabolic, dysmyelinating, vascular and paraneoplastic disorders. Associated MRI features like gyral haemorrhages, hippocampal, mamillary body and forniceal atrophy, basal ganglia (BG) hyperintensity, temporal lobe cysts, pachygyria-agyria complex and lacunar infarcts help in narrowing the differential diagnosis. Advanced MRI including diffusion-weighted imaging (DWI), susceptibility-weighted imaging (SWI) and MR spectroscopy (MRS) have an added value. Knowledge of key MRI features in the appropriate clinical setting and lab parameters can help to reach the definitive diagnosis. We retrospectively reviewed the MRI findings and the clinical charts of the patients with BTH to investigate what disorders affect both the temporal lobes and to evaluate other MRI features for differential diagnosis.
Methods and materials
Patient selection
MR reports of all MRI brain studies were reviewed from picture archiving and communication systems at our hospital to identify patients with bilateral involvement of temporal lobes between October 2007 and September 2010. The MRI reports that showed BTH were selected, and a review of those MRI reports was performed.
MR image analysis
The MR images were retrospectively reviewed by the radiologists. All individual cross-sectional images were evaluated for the location and distribution of BTH, presence of diffusion restriction, haemorrhage, enhancement and MRS findings. Additional MRI findings were also assessed. Medical records and laboratory parameters of these cases were reviewed.
MRI technique
Most patients were scanned on a 1.5 T MRI system using a head matrix coil, while a few cases were performed on a 3 T MRI system using a head sense coil. The following acquisition parameters were used: T2 weighted imaging [repetition time (TR) in milliseconds/echo time (TE) in milliseconds/field of view (FOV), 4500–4770/95/25], FLAIR (TR/TE/FOV, 8500–9000/90–101/25). T1 gradient volume acquisition was performed for T1 weighted imaging in sagittal plane with a slice thickness (ST) of 0.9 mm, and then reconstructed in all three (axial, coronal and sagittal) planes with an ST of 6 mm and an interslice gap of 0.6 mm. Diffusion-weighted three-scan trace in the transverse plane by using echo-planar imaging was performed with b-values of 0, 500 and 1000. Apparent diffusion coefficient maps were obtained automatically on a voxel-by-voxel basis by using commercially available software. 5–6 ml of intravenous gadolinium (1 ml per 10 kg of body weight) contrast agent was used for the contrast-enhanced study. MRS was performed by using a mutivoxel point resolved spectroscopy acquisition technique (ST=15 mm; TR/TE, 1590/30).
Results
There were 65 patients with BTH: 43 male and 22 female, ranging in age from 6 to 65 years with varying clinical presentations. Of the 65 patients with BTH, we found the 13 different clinical entities on the basis of clinical history, laboratory results and MRI findings. Herpes simplex virus (HSV) encephalitis was the most frequent in this series.
Frequency and demographic distribution of diseases are summarised in Table 1.
Table 1. Frequency and demographic distribution of diseases.
| Diagnosis (n) | Percentage of total cases (n=65) | Age or age range (years) | Sex distribution |
| Infective diseases | |||
| Herpes encephalitis (15) | 23 | 34–55 | 10M, 5F |
| Congenital CMV infection (2) | 3 | 8–11 | 1M, 1F |
| Epileptic syndrome | |||
| Mesial temporal sclerosis (10) | 15.3 | 8–27 | 6M, 4F |
| Neurodegenerative | |||
| Alzheimer's disease (7) | 10.7 | 58–65 | 5M, 2F |
| Frontotemporal dementia (2) | 3 | 61–64 | 2F |
| Myotonic dystrophy (1) | 1.5 | 27 | 1M |
| Neoplastic | |||
| Gliomatosis cerebri (9) | 13.8 | 33–64 | 6M, 3F |
| Metabolic | |||
| MELAS (7) | 10.7 | 10–22 | 5M, 2F |
| Wilson's disease (1) | 1.5 | 10 | 1M |
| Hyperammonemia (1) | 1.5 | 61 | 1F |
| Dysmyelinating disease | |||
| MLC (6) | 9.2 | 6–20 | 5M, 1F |
| Vascular | |||
| CADASIL (2) | 3 | 31–35 | 1M, 1F |
| Paraneoplastic disorder | |||
| Limbic encephalitis (2) | 3 | 25–32 | 2M |
CADASIL, cerebral autosomal dominant arteriopathy with subcortical infarcts and leukoencephalopathy; CMV, cytomegalovirus; F, female; M, male; MELAS, mitochondrial encephalopathy, lactic acidosis and stroke-like episodes; MLC, megalencephalic leukoencephalopathy with subcortical cysts.
The clinical features, location and distribution of temporal lobe hyperintensity, additional and advanced MRI findings with relevant laboratory results are summarised in Table 2.
Table 2. The clinical features, location and distribution of temporal lobe hyperintensity, additional and advanced MRI findings with relevant laboratory results.
| Bilateral temporal lobe hyperintensity |
Advanced MRI findings |
||||||||||
| S. no. | Diagnosis | Clinical features | Lobe | GM | WM | Additional MRI findings | DWI | SWI | MRS | Gd-enhancement | Laboratory result |
| 1 | Herpes encephalitis | Fever, seizure, altered sensorium | A, M | + | − | Orbital gyri involvement, gyriform haemorrhages | R | + | ND | Gyriform | HSV antibodies in CSF |
| 2 | Mesial temporal sclerosis | Complex partial seizure | M | + | + | Hippocampal, mamillary body, fornix and collateral WM atrophy | − | − | ND | ND | Temporal lobe localisation on EEG |
| 3 | Gliomatosis cerebri | Headache, recurrent seizures | A, M | + | + | Expansion of parenchyma, multilobar involvement | − | − | ↑ML | Absent / patchy | Non-contributory |
| 4 | MELAS | Episodes of LOC, seizure | P, M | + | + | Fleeting hyperintensity, basal ganglia involvement | R | − | ↑lac | Patchy | ↑Serum and CSF lactate |
| 5 | Alzheimer's disease | Personality changes, memory loss | A, M | − | + | Hippocampal atrophy, enlarged parahippocampal fissures | − | − | ↑ML | − | Non-contributory |
| 6 | MLC | Developmental delay, seizure | Whole | − | + | Temporal lobe cysts, subcortical WM, external capsule | − | − | ↓NAA ↑cho | − | Non-contributory |
| 7 | Congenital CMV | Seizure | P | − | + | Periventricular cysts, pachygyria-agyria complex | − | − | ND | − | Non-contributory |
| 8 | CADASIL | Migraine, hemisensory loss | A, M | − | + | Lacunar infarcts, subcortical WM, external capsule and insula | − | − | ND | − | Non-contributory |
| 9 | Frontotemporal dementia | Dementia | A,M | − | + | Fronto-temporal atrophy | − | − | ↓NAA ↑cho | − | Non-contributory |
| 10 | Limbic encephalitis | Memory disturbance | M | + | − | Cingulate gyrus, subfrontal cortex and inferior frontal WM | − | − | ND | − | Pleocytosis, lymphoma antibodies in CSF |
| 11 | Hyperammonemia | Confusion, altered sensorium | A | + | − | Posterior cingulate gyrus | R | − | ND | ND | ↑Blood ammonia |
| 12 | Wilson's disease | Weakness, extrapyramidal symptoms | A, P, L | + | + | Fronto-parietal lobes, dorsal midbrain, deep grey nuclei | R | − | ND | − | ↑Serum and urine copper, ↓ceruloplasmin |
| 13 | Myotonic dystrophy | Developmental delay, facial and distal limb weakness | A | − | + | Periventricular and deep WM, prominent VR spaces | − | − | ND | ND | Myotonic discharges in electromyography |
↓, decreased; ↑, elevated; −, negative; +, positive; A, anterior; CADASIL, cerebral autosomal dominant arteriopathy with subcortical infarcts and leukoencephalopathy; Cho, choline; CMV, cytomegalovirus; CPS, complex partial seizure; CSF, cerebrospinal fluid; DWI, diffusion-weighted imaging; EC, external capsule; EEG, electroencephalogram; Gd, gadolinium; GM, grey matter; HSV, herpes simplex virus; L, lateral; Lac, lactate; LOC, loss of consciousness; M, medial; MELAS, mitochondrial encephalopathy, lactic acidosis and stroke-like episodes; ML, myoinositol; MLC, megalencephalic leukoencephalopathy with subcortical cysts; MRS, MR spectroscopy; NA, not applicable; NAA, N-acetylaspartate; ND, not done; P, posterior; R, restriction; S. no., serial number; SWI, susceptibility-weighted imaging; WM, white matter; VR, Virchow–Robin spaces.
Discussion
BTH at T2 weighted and FLAIR imaging is a well-known MRI finding in patients with temporal lobe epilepsy [1]. In the present study, FLAIR BTH was most frequently seen in patients with HSV encephalitis. In addition, it was observed in various pathological conditions: metabolic, vascular, neoplastic, infective and paraneoplastic diseases. We discuss the BTH in different clinical scenarios highlighting the unique MRI features for each clinical entity.
Infective diseases
Certain specific infective diseases have propensity for temporal lobes that include HSV Type 1, congential cytomegalovirus (CMV) and neurosyphilis.
Herpes simplex virus encephalitis
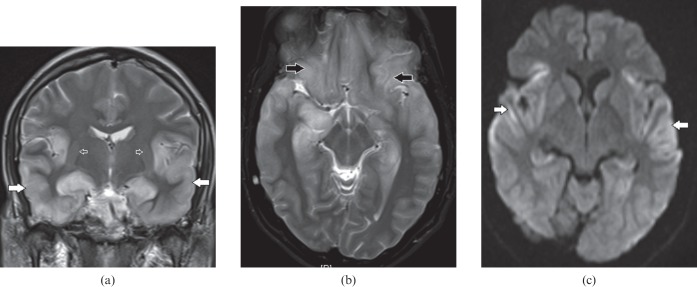
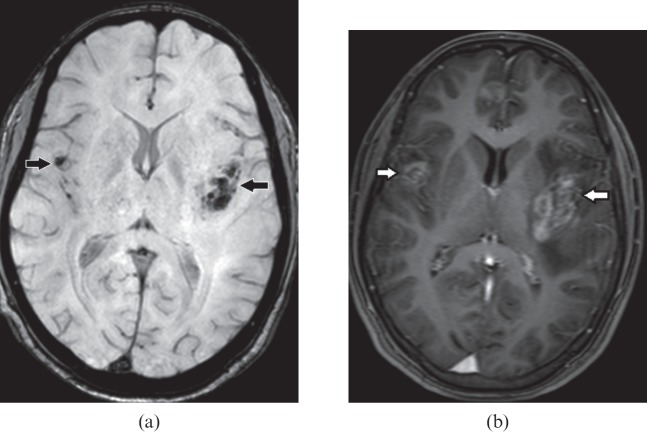
This is a common form of viral encephalitis affecting the young and those of middle age. HSV has specific predilection for medial temporal lobes (Figure 1a) and other limbic structures such as insula, cingulate gyrus and inferior frontal lobes (Figure 1b) with characteristic sparing of lentiform nucleus [2]. Diffusion-weighted MRI is a very sensitive tool for early detection and diagnosis (Figure 1c) of this entity when conventional MRI is normal [3]. Additional MRI sequences such as SWI for early haemorrhagic foci (Figure 2a) and post-gadolinium study to look for gyriform enhacement (Figure 2b) in involved areas are of diagnostic value [2]. In clinically suspected encephalitis these imaging features are diagnostic of this entity that can be supported by detection of HSV antibodies in the CSF along with characteristic EEG changes [2].
Figure 1.
A 34-year-old male with herpes encephalitis. (a) Coronal T2 weighted image shows bilateral symmetric cortical swelling and hyperintensity involving the anteromedial temporal lobes including the insular cortex (white arrows) with characteristic sparing of basal ganglia (open arrows). (b) Axial T2 weighted image shows additional involvement of orbital gyri (black arrows). (c) Axial diffusion-weighted image depicts restricted diffusion in the involved areas (white arrows).
Figure 2.
A 46-year-old male with herpes encephalitis. (a) Axial susceptibility-weighted image demonstrates haemorrhages (black arrows) in both temporal lobes. (b) Axial T1 weighted post-gadolinium image shows gyriform enhancement (white arrows) in the involved temporal lobes.
Congenital cytomegalovirus infection
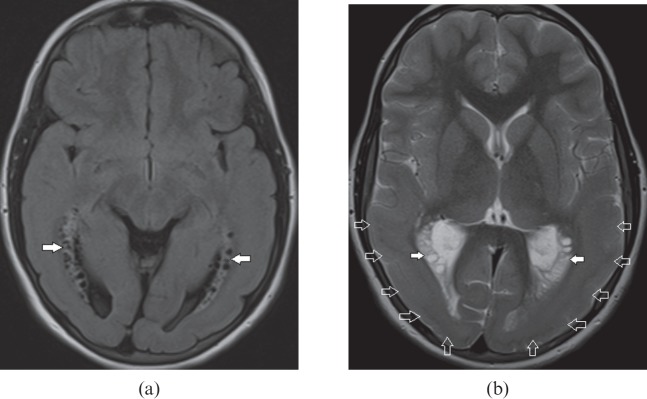
Congenital CMV infection is a common form of the toxoplasmosis, rubella, cytomegalovirus and herpes simplex (TORCH) group of infections. It can present with a wide imaging spectrum depending upon the age of onset in the intrauterine period. It presents with lissencephaly if infection occurs before 16–18 weeks, polymicrogyria between 18 and 24 weeks and normal gyral pattern when infection occurs during third trimester [4]. This diagnosis should be suspected when there are cardinal features such as asymmetric white matter abnormality with temporoparietal predominance (Figure 3a), periventricular and anterior temporal cysts, gyral abnormalities (Figure 3b) and periventricular calcifications [5]. Pseudo-TORCH or Aicardi–Goutières syndrome closely mimics CMV; however, symmetric white matter changes, basal ganglia and cerebral white matter calcification, cerebral atrophy and chronic lymphocytosis and raised interferon-alpha on CSF examination characterise the former disorder [6].
Figure 3.
An 11-year-old female with cytomegalovirus infection. (a) Axial fluid-attenuated inversion-recovery image shows bilateral periventricular cysts with gliosis of white matter (white arrows) in both temporal lobes. (b) Axial T2 weighted image demonstrates gyral abnormality in the form of pachygyria–agyria complex (open arrows) bilaterally involving the temporo-occipital lobes in addition to the periventricular cysts (white arrows). Combination of these imaging findings along with periventricular calcifications are in favour of congenital cytomegalovirus infection.
Epilepsy syndrome
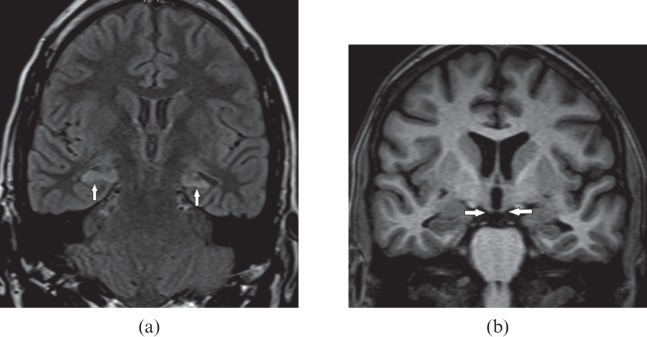
Mesial temporal sclerosis is the most common pathological abnormality in temporal lobe epilepsy. Most patients present with complex partial seizure. Bilateral involvement is seen in 10% [7]. Classic MRI findings include volume loss and an abnormal increased T2 and FLAIR signal of the hippocampus as a result of underlying gliosis (Figure 4a) and the subsequent increase in free water content. Associated atrophy of parahippocampus gyrus, collateral white matter, mamillary body (Figure 4b) and fornix are also seen. Optimised high-resolution oblique coronal thin sections MRI of the temporal lobes are highly sensitive and specific for detection of mesial temporal sclerosis.
Figure 4.
A 17-year-old male with complex partial seizure. (a) Oblique coronal fluid-attenuated inversion-recovery image reveals bilateral hippocampal atrophy, hyperintensity indicating gliosis (white arrows) with loss of internal architecture consistent with a diagnosis of bilateral mesial temporal sclerosis. (b) Oblique coronal T1 weighted image demonstrates bilateral mamillary body atrophy (white arrows).
Neurodegenerative disorders
Major neurodegenerative disorders with specific involvement of temporal lobes include Alzheimer's disease (AD) and frontotemporal dementia (FTD). Type 1 myotonic dystrophy is a rare disorder which can also manifest as temporal lobe hyperintensity.
Alzheimer's disease
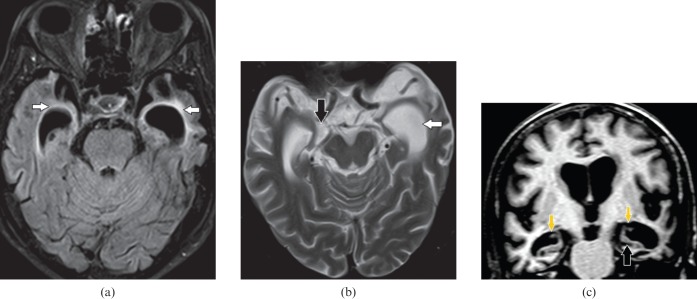
It is a progressive neurodegenerative disorder of the sixth to seventh decade, characterised clinically by memory loss, cognitive impairment and personality changes. White matter changes in AD can present as confluent periventricular hyperintensity, which can also involve temporal lobes (Figure 5a). This hyperintensity is seen as smooth periventricular halo, which is more specific for AD than irregular periventricular hyperintensity seen in multi-infarct dementia [8]. Marked temporal cortical atrophy with disproportionate medial temporal volume loss, predominantly the hippocampi and parahippocampi gyri with correponding enlargement of parahippocampal fissures and temporal horns, is diagnostic of this entity [9] (Figure 5b,c). In a clinically suspected case of AD with normal or equivocal conventional MRI findings, additional MRI such as MRS would be a more sensitive non-invasive tool to detect abnormality at an early stage. MRS at short TE with voxel placed on the posterior cingulate gyrus will show a decreased N-acetylaspartate and elevated myoinositol [9].
Figure 5.
A 64-year-old male with memory loss and personality changes. (a) Axial fluid-attenuated inversion-recovery image shows hyperintensity in both anteromedial temporal lobes (white arrows). (b) Axial T2 weighted and (c) coronal T1 weighted images depict marked atrophy of temporal lobes with preferential volume loss of hippocampi and parahippocampi gyri and corresponding enlargement of parahippocampal fissures including choroidal (downwards arrows on c) and hippocampal fissures (black arrows), and temporal horns (white arrow). Temporal lobe hyperintensity indicates non-specific gliosis because of marked atrophy; however, the selective mesial temporal atrophy with enlarged parahippocampal fissures are diagnostic of Alzheimer's disease.
Frontotemporal dementia
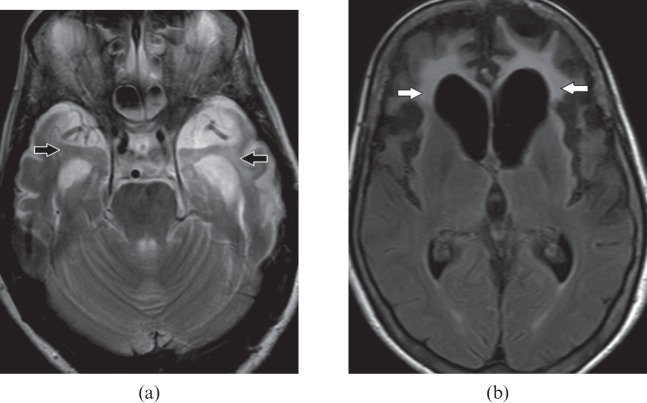
This is also known as Pick's disease, another form of neurodegenerative disorder occurring in the fifth to sixth decade presents with gradual language, personality and behavioural changes. In comparsion with AD, FTD has relatively preserved memory and visuospatial skills late in the disease course. FTD has a predilection for fronto-temporal lobes on imaging. Characteristic disproportionate fronto-temporal atrophy with gliosis of underlying white matter on MR (Figure 6) confirms the clinical diagnosis [10]. MR surface display shows preferential atrophy in the frontotemporal regions and allows a distinction to be made from the temporoparietal volume loss seen in AD [9].
Figure 6.
A 64-year-old female with frontotemporal dementia. (a) Axial T2 weighted image shows hyperintensity with volume loss in bilateral temporal lobes (black arrows). (b) Axial fluid-attenuated inversion-recovery image demonstrates predominate volume loss in both frontal and temporal lobes with associated increased signal in white matter indicating underlying gliosis (white arrows).
Myotonic dystrophy Type-1
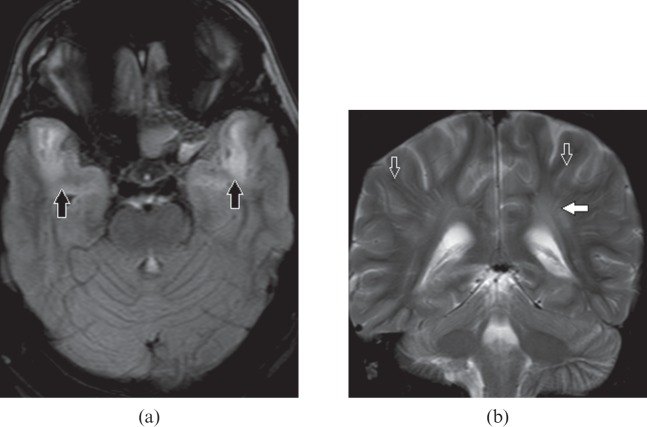
The adult form of myotonic dystrophy is a multisystem disorder. In patients younger than 40 years, the diagnosis of this entity should be suspected if there are typical clinical features of distal muscle and facial muscle weakness, hearing impairment, cataract and testicular atrophy with distinctive imaging features. On MRI, characteristic involvement of anterior temporal subcortical (Figure 7a) and periventricular white matter and dilated Virchow–Robin spaces (Figure 7b) are commonly encountered imaging findings. Absent cystic changes differentiate this from megalencephalic leukoencephalopathy with subcortical cysts (MLC), which closely resemble myotonic dystrophy [11].
Figure 7.
A 34-year-old male with myotonic dystrophy Type 1. (a) Axial fluid-attenuated inversion-recovery image shows bilateral anterior temporal white matter hyperintensity (black arrows). (b) Coronal T2 weighted image shows hyperintensity in periventricular white matter (white arrow) and prominent perivascular spaces (open arrows) disproportionate to the age.
Neoplastic condition
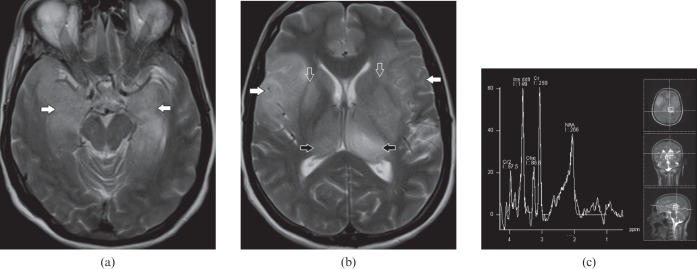
Gliomatosis cerebri is characterised by chronic clinical course with non-specific mild symptoms in relation to the extent of involvement on imaging. MRI reveals diffuse expansion of brain parenchyma with maintained architecture in the absence of discrete mass. It has characteristic multilobar involvement, most commonly frontotemporal (Figure 8a), along with BG and thalami (Figure 8b). MRS is a non-invasive diagnostic method for metabolic characterisation of this tumour, and most commonly reveals decreased N-acetylaspartate, an elevated peak of myoinositol and a normal choline level (Figure 8c). Patients with gliomatosis cerebri are often clinically problematic, with vague and generalised symptoms. Widespread involvement on imaging can raise the consideration of encephalitis or vasculitis, such as systemic lupus erythaematosus; however, relative acute presentation, reversible diffusion restriction on DWI and variable enhancement on post-gadolinium study can differentiate between them [12].
Figure 8.
A 61-year-old male with gliomatosis cerebri. (a) Axial T2 weighted image demonstrates cortical expansion and hyperintensity (white arrows) in both medial temporal lobes. (b) Axial T2 weighted image shows multifocal brain parenchymal involvement with expansion and relative preservation of architecture. Involvement of frontotemporal lobes (white arrows), basal ganglia (open arrows) and thalami (black arrows) are seen. (c) MR spectroscopy shows markedly elevated myoinositol peak at 3.45 parts per million.
Metabolic conditions
Metabolic conditions associated with BTH include mitochondrial encephalopathy, lactic acidosis and stroke-like episodes (MELAS) as a common cause, and hyperammonemia and Wilson's disease as uncommon causes.
MELAS
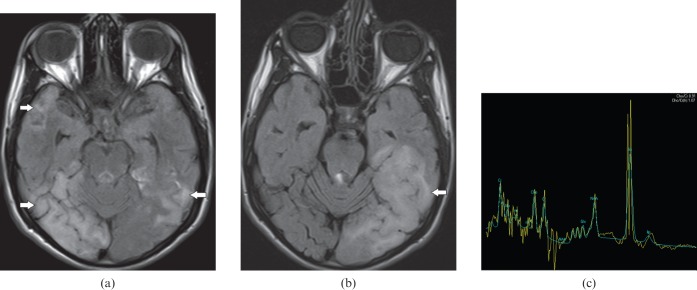
MELAS is an inherited metabolic disorder due to a genetic defect in mitochondrial deoxyribonucleic acid (DNA). In a young adult presenting with a history of recurrent stroke-like episodes, episodic paresis, psychosis and cortical blindness [13], the diagnosis of MELAS should be suspected if there is bilateral infarct-like cortical and subcortical parieto-occipital and temporoparietal hyperintensity crossing the vascular territories (Figure 9a,b). The fleeting nature of this hyperintensity is a unique characteristic of this entity. Spectroscopy demonstrates a remarkable lactate peak (Figure 9c) which, along with elevated serum and CSF lactate levels, commends the imaging diagnosis [14].
Figure 9.
A 17-year-old male with mitochondrial encephalopathy, lactic acidosis and stroke-like episodes (MELAS). (a) Axial fluid-attenuated inversion-recovery (FLAIR) image shows bilateral asymmetric cortical and subcortical temporal lobe hyperintensity (white arrows), right more than the left and (b) axial FLAIR image 4 months later shows resolution of previous hyperintensity and new area of involvement on left side (white arrow) indicating the fleeting nature of the lesions. (c) MR spectroscopy demonstrates elevated lactate peak at 1.3 parts per million. These findings are consistent with a diagnosis of MELAS.
Hyperammonemia
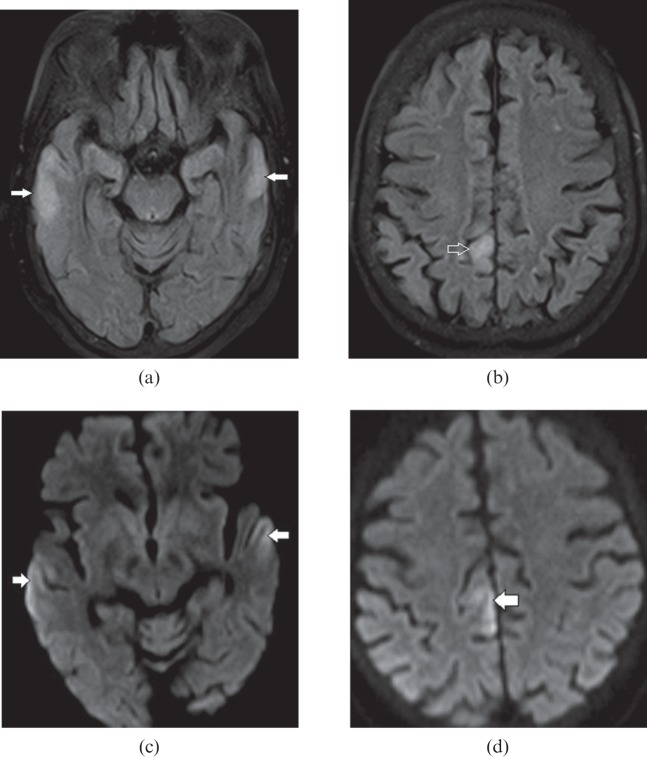
This is a metabolic end result of urea cycle disorders and decompensated liver diseases. The areas most vulnerable to brain injury include bilateral temporal lobe including insular cortex and posterior cingulate gyrus with sparing of occipital lobes and perirolandic cortex [15]. On MRI, the affected areas are recognised as hyperintensity on FLAIR, T2 weighted sequences (Figure 10a,b) and restricted diffusion on DWI (Figure 10c) owing to the presence of reversible cytotoxic oedema from the glutamine-induced neuronal injury [16]. In a clinically suspected metabolic encephalopathy, awareness of these distinguishing imaging features in the context of elevated blood ammonia and glutamine peak on MRS [17] expedites early diagnosis and timely management.
Figure 10.
A 61-year-old female with hyperammonemic encephalopathy. Axial fluid-attenuated inversion-recovery images show (a) bilateral peripheral cortical temporal lobe (white arrows) and (b) right posterior cingulate gyrus (open arrow) hyperintensity. Diffusion-weighted images show corresponding restricted diffusion (white arrows) in (c) the bilateral peripheral cortical temporal lobe and (d) the right posterior cingulate gyrus. The typical distribution of lesions with elevated blood ammonia level suggests this diagnosis.
Wilson's disease
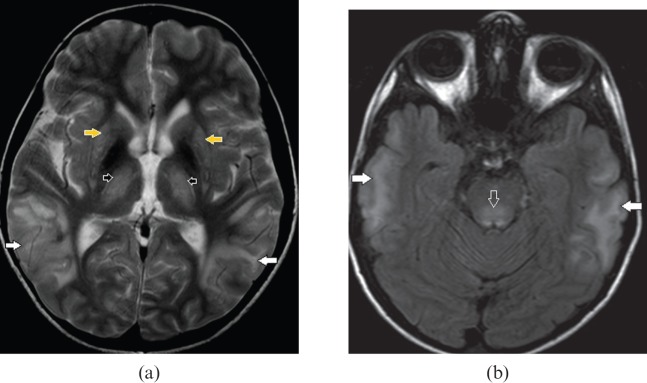
This is an uncommon metabolic disorder due to deficiency of ceruloplasmin serum transport protein for copper. It generally presents with extrapyramidal symptoms or chronic liver disease. Although bilateral BG and brainstem involvement (Figure 11a) are the imaging hallmarks of this disorder, occasionally extensive grey and white matter involvement can be seen (Figure 11b) [18]. A combination of the above findings can closely simulate the more common metabolic condition MELAS; however, the presence of bilateral Kayser–Fleischer rings on ophthalmoscopic examination, elevated serum and urinary copper levels with decreased serum ceruloplasmin clinch the diagnosis.
Figure 11.
A 10-year-old male with Wilson's disease. (a) Axial T2 weighted and (b) fluid-attenuated inversion-recovery images demonstrate bilateral extensive cortical and subcortical temporal lobe hyperintensity (white arrows), dorsal midbrain involvement (open arrow), bilateral symmetric basal ganglia (yellow arrows) and anterolateral thalamic (black arrows) hyperintensity. Extensive grey and white matter lesions are less frequently in Wilson's disease however concomitant basal ganglia, thalamic and dorsal brainstem abnormalities point to the diagnosis.
Dysmyelinating disease
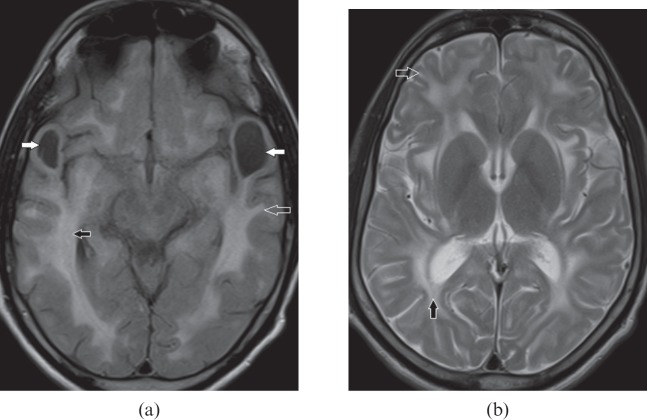
MLC with subcortical cysts is a form of Van der Knaap leukoencephalopathy with autosominal recessive inheritance resulting from gene mutations in the MLC 1 gene. It is typically described as occuring in the Agarwal community of India [19]. It generally presents in infancy with macrocephaly, often in combination with mild gross motor and cognitive decline, gradual onset of ataxia, spasticity and relatively late onset of mild mental deterioration. Imaging features include the presence of subcortical cysts in the anterior temporal (Figure 12a) and frontoparietal lobes in addition to diffuse white matter swelling and hyperintensity (Figure 12a,b). Internal capsule, grey matter structures such as BG and thalami are commonly spared [20]. The diagnosis of MLC is established in individuals with typical clinical findings and characteristic abnormalities observed on cranial MRI.
Figure 12.
A 22-year-old male with megalencephalic leukoencephalopathy with subcortical cysts. (a) Axial fluid-attenuated inversion-recovery and (b) axial T2 weighted images reveal bilateral anterior temporal lobe cysts (white arrows), deep (black arrow) and subcortical (open arrow) white matter hyperintensity. Temporal lobe cysts with extensive white matter lesions involving the deep and subcortical white matter, and external capsule with sparing of basal ganglia, thalami and internal capsules are typical for this subtype of van der Knaap leukoencephalopathy.
Vascular
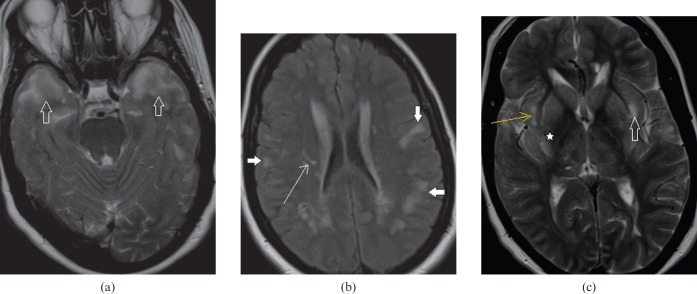
Cerebral autosomal dominant arteriopathy with subcortical infarcts and leukoencephalopathy is a rare hereditary small-vessel disease due to mutation in the Notch 3 gene located on chromosome 19 [21]. It occurs in the third and fourth decade of life. Affected individuals present with recurrent stroke-like episodes, migraine and psychiatric symptoms. Hyperintensity in bilateral anterior temporal lobes is the imaging hallmark of this entity (Figure 13a) and is further supported by the presence of lacunar infarcts, hyperintense subcortical and external capsule lesions (Figure 13b,c) [22].
Figure 13.
A 35-year-old female with cerebral autosomal dominant arteriopathy with subcortical infarcts and leukoencephalopathy. (a) Axial T2 weighted image shows confluent hyperintense lesions in both anterior temporal lobes (open arrows). (b) Axial fluid-attenuated inversion-recovery image shows patchy subcortical hyperintense areas (white arrows) and multiple lacunar infarcts (thin white arrow). (c) Axial T2 weighted image shows multiple patchy hyperintense areas involving the external capsule (open arrow), insular cortex (thin arrow) and basal ganglia (asterisk).
Paraneoplastic disorder
Limbic encephalitis is a rare paraneoplastic disorder in which cerebral inflammation is associated with a systemic tumour, most commonly small-cell carcinoma of the lung. MRI shows a typical pattern of brain parenchymal changes in the form of an increased signal in the bilateral medial temporal lobes, amygdala (Figure 14a), cingulate gyrus, insula, subfrontal cortex and inferior frontal white matter with no mass effect or enhancement. Early cases present with cortical swelling and hyperintensity, which resolve in the course of months and years, ultimately resulting in mesial temporal atrophy on serial MRI [23] (Figure 14b). HSV encephalitis can show similar imaging findings; however, a more acute history of febrile illness, mass effect and haemorrhages on MRI along with viral titres in serum or CSF confirms its diagnosis. Gliomatosis can also mimic limbic encephalitis because of its indolent clinical course; however, on imaging there is more extensive brain parenchymal involvement [24].
Figure 14.
A 26-year-old male with paraneoplastic limbic encephalitis presenting with progressive memory disturbance. (a) Initial coronal T2 weighted image demonstrates swelling and increase signal in both mesial temporal lobes (white arrows). (b) Follow-up coronal T2 weighted image after 1 year shows significant decrease in the swelling and abnormal signal intensity (white arrows). (c) Axial contrast-enhanced CT section through the mid-abdomen shows ileocolic intussusception (black arrow) with marked concentric wall thickening of ascending colon (white arrows). Biopsy proven Burkitt's lymphoma of ascending colon is also shown.
Conclusion
Knowledge of key MRI features in the appropriate clinical setting serves as a diagnostic tool in the characterisation of BTH.
References
- 1.Jack CR, Jr, Rydberg CH, Krecke KN, Trenerry MR, Parisi JE, Rydberg JN, et al. Mesial temporal sclerosis: diagnosis with fluid-attenuated inversion-recovery versus spin-echo MR imaging. Radiology 1996;199:367–73 [DOI] [PubMed] [Google Scholar]
- 2.Demaerel P, Wilms G, Robberecht W, Johannik K, Van Hecke P, Carton H, et al. MRI of herpes simplex encephalitis. Neuroradiology 1992;34:490–3 [DOI] [PubMed] [Google Scholar]
- 3.Küker W, Nägele T, Schmidt F, Heckl S, Herrlinger U. Diffusion-weighted MRI in herpes simplex encephalitis: a report of three cases. Neuroradiology 2004;46:122–5 [DOI] [PubMed] [Google Scholar]
- 4.Barkovich AJ, Lindan CE. Congenital cytomegalovirus infection of the brain: imaging analysis and embryologic considerations. AJNR Am J Neuroradiol 1994;15:703–15 [PMC free article] [PubMed] [Google Scholar]
- 5.de Vries LS, Gunardi H, Barth PG, Bok LA, Verboon-Maciolek MA, Groenendaal F. The spectrum of cranial ultrasound and magnetic resonance imaging abnormalities in congenital cytomegalovirus infection. Neuropediatrics 2004;35:113–19 [DOI] [PubMed] [Google Scholar]
- 6.Østergaard JR, Christensen T. Aicardi–Goutières syndrome: neuroradiological findings after nine years of follow-up. Eur J Paediatr Neurol 2004;8:243–6 [DOI] [PubMed] [Google Scholar]
- 7.Oppenheim C, Dormont D, Hasboun D, Bazin B, Samson S, Lehéricy S, et al. Bilateral mesial temporal sclerosis: MRI with high-resolution fast spin-echo and fluid-attenuated inversion-recovery sequences. Neuroradiology 1999;41:471–9 [DOI] [PubMed] [Google Scholar]
- 8.Fazekas F, Chawluk JB, Alavi A, Hurtig HI, Zimmerman RA. MR signal abnormalities at 1.5 T in Alzheimer's dementia and normal aging. AJR Am J Roentgenol 1987;149:351–6 [DOI] [PubMed] [Google Scholar]
- 9.Norfray JF, Provenzale JM. Alzheimer's disease neuropathologic findings and recent advances in imaging. AJR Am J Roentgenol 2004;182:3–13 [DOI] [PubMed] [Google Scholar]
- 10.Oba H, Tokumaru A. Magnetic resonance imaging for frontotemporal lobar degeneration. [In Japanese.] Brain Nerve 2009;61:1269–73 [PubMed] [Google Scholar]
- 11.Di Costanzo A, Di Salle F, Santoro L, Bonavita V, Tedeschi G. Brain MRI features of congenital- and adult-form myotonic dystrophy type 1: case-control study. Neuromuscul Disord 2002;12:476–83 [DOI] [PubMed] [Google Scholar]
- 12.Desclée P, Rommel D, Hernalsteen D, Godfraind C, de Coene B, Cosnard G. Gliomatosis cerebri, imaging findings of 12 cases. J Neuroradiol 2010;37:148–58 [DOI] [PubMed] [Google Scholar]
- 13.Sproule DM, Kaufmann P. Mitochondrial encephalopathy, lactic acidosis, and stroke like episodes: basic concepts, clinical phenotype, and therapeutic management of MELAS syndrome. Ann N Y Acad Sci 2008;1142:133–58 [DOI] [PubMed] [Google Scholar]
- 14.Kamada K, Takeuchi F, Houkin K, Kitagawa M, Kuriki S, Ogata A, et al. Reversible brain dysfunction in MELAS MEG, and (1)H MRS analysis. J Neurol Neurosurg Psychiatry 2001;70:675–8 [DOI] [PMC free article] [PubMed] [Google Scholar]
- 15.Bindu PS, Sinha S, Taly AB, Christopher R, Kovoor JM. Cranial MRI in acute hyperammonemic encephalopathy. Pediatr Neurol 2009;41:139–42 [DOI] [PubMed] [Google Scholar]
- 16.Babington JR, Stahl JH, Coy DL. Reversible cytotoxic edema in a cirrhotic patient following TIPS. J Neuroimaging 2009;19:391–3 [DOI] [PubMed] [Google Scholar]
- 17.Kojic J, Robertson PL, Quint DJ, Martin DM, Pang Y, Sundgren PC. Brain glutamine by MRS in a patient with urea cycle disorder and coma. Pediatr Neurol 2005;32:143–6 [DOI] [PubMed] [Google Scholar]
- 18.Mikol J, Vital C, Wassef M, Chappuis P, Poupon J, Lecharpentier M, et al. Extensive cortico-subcortical lesions in Wilson's disease clinico-pathological study of two cases. Acta Neuropathol 2005;110:451–8 [DOI] [PubMed] [Google Scholar]
- 19.Gorospe JR, Singhal BS, Kainu T, Wu F, Stephan D, Trent J, et al. Indian Agarwal megalencephalic leukodystrophy with cysts is caused by a common MLC1 mutation. Neurology 2004;62:878–82 [DOI] [PubMed] [Google Scholar]
- 20.van derKnaap MS, Scheper GC. Megalencephalic leukoencephalopathy with subcortical cysts. Pagon RA, Bird TC, Dolan CR, Stephens K, eds. GeneReviews. Seattle, WA: University of Washington; 2003 [Google Scholar]
- 21.Eikermann-Haerter K, Yuzawa I, Dilekoz E, Joutel A, Moskowitz MA, Ayata C. Cerebral autosomal dominant arteriopathy with subcortical infarcts and leukoencephalopathy syndrome mutations increase susceptibility to spreading depression. Ann Neurol 2011;69:413–18 [DOI] [PMC free article] [PubMed] [Google Scholar]
- 22.Singhal S, Rich P, Markus HS. The spatial distribution of MR imaging abnormalities in cerebral autosomal dominant arteriopathy with subcortical infarcts and leukoencephalopathy and their relationship to age and clinical features. AJNR Am J Neuroradiol 2005;26:2481–7 [PMC free article] [PubMed] [Google Scholar]
- 23.Urbach H, Soeder BM, Jeub M, Klockgether T, Meyer B, Bien CG. Serial MRI of limbic encephalitis. Neuroradiology 2006;48:380–6 [DOI] [PubMed] [Google Scholar]
- 24.Eloraby AM. The paraneoplastic limbic encephalitis: MRI characterization of a deceiving neurological disorder. J Egypt Natl Canc Inst 2008;20:403–9 [PubMed] [Google Scholar]


