

Abstract
Genome-wide association studies (GWASs) have identified many SNPs underlying variations in plasma-lipid levels. We explore whether additional loci associated with plasma-lipid phenotypes, such as high-density lipoprotein cholesterol (HDL-C), low-density lipoprotein cholesterol (LDL-C), total cholesterol (TC), and triglycerides (TGs), can be identified by a dense gene-centric approach. Our meta-analysis of 32 studies in 66,240 individuals of European ancestry was based on the custom ∼50,000 SNP genotyping array (the ITMAT-Broad-CARe array) covering ∼2,000 candidate genes. SNP-lipid associations were replicated either in a cohort comprising an additional 24,736 samples or within the Global Lipid Genetic Consortium. We identified four, six, ten, and four unreported SNPs in established lipid genes for HDL-C, LDL-C, TC, and TGs, respectively. We also identified several lipid-related SNPs in previously unreported genes: DGAT2, HCAR2, GPIHBP1, PPARG, and FTO for HDL-C; SOCS3, APOH, SPTY2D1, BRCA2, and VLDLR for LDL-C; SOCS3, UGT1A1, BRCA2, UBE3B, FCGR2A, CHUK, and INSIG2 for TC; and SERPINF2, C4B, GCK, GATA4, INSR, and LPAL2 for TGs. The proportion of explained phenotypic variance in the subset of studies providing individual-level data was 9.9% for HDL-C, 9.5% for LDL-C, 10.3% for TC, and 8.0% for TGs. This large meta-analysis of lipid phenotypes with the use of a dense gene-centric approach identified multiple SNPs not previously described in established lipid genes and several previously unknown loci. The explained phenotypic variance from this approach was comparable to that from a meta-analysis of GWAS data, suggesting that a focused genotyping approach can further increase the understanding of heritability of plasma lipids.
Introduction
Cardiovascular disease (CVD) is one of the leading causes of disability and death worldwide.1 Atherosclerosis is the major underlying pathological process of CVD and is highly prevalent in western societies. Atherogenesis has numerous genetic and environmental risk factors,2 and abnormalities of plasma lipids and lipoproteins account for ∼50% of the population attributable risk of developing CVD.3,4 Plasma-lipid and lipoprotein levels are themselves highly heritable—estimates range from 40%–60% for total cholesterol (TC), low-density lipoprotein cholesterol (LDL-C), high-density lipoprotein cholesterol (HDL-C), and triglycerides (TGs).5
In a large-scale meta-analysis of genome-wide association studies (GWASs), it was shown that plasma-lipid levels are affected by common genetic variants in 95 loci, of which 59 were previously unreported.6 All together, variation at these loci explains 10%–12% of the total variance and 25%–30% of the genetic variability in plasma-lipid phenotypes.6 This means that although a portion of the genetic contribution to variation in plasma lipids and lipoproteins has been characterized, there is still variance that remains unattributed.7
To further identify genetic associations underlying variation in plasma-lipid phenotypes, we performed a large meta-analysis of 32 studies comprising 66,240 individuals of European ancestry by using the candidate-gene ITMAT-Broad-CARe (IBC) array (Illumina), also known as the CardioChip or the Human CVD BeadArray. The IBC array was designed to capture genetic diversity by using ∼50,000 SNPs across ∼2,000 candidate-gene regions primarily related to cardiovascular, inflammatory, and metabolic phenotypes.8 Prior reports using this array have confirmed previously established associations and identified unreported associations between SNPs and several phenotypes and disease outcomes, including coronary artery disease,9,10 plasma lipids,11,12 blood pressure,13,14 cardiomyopathy,15 type 2 diabetes (T2D),16,17 and height.18 The majority of loci on the IBC array are captured with a marker density equal to or greater than that seen on genome-wide arrays. Compared to the agnostic design of GWAS arrays, gene-centric genotyping with this array might permit a better identification of multiple functional polymorphisms, or their proxies, at each locus. Indeed, this approach has the potential to capture a more detailed genetic architecture in selected high-priority regions and increase the total explained variance.
We sought to contribute to the current literature by using a dense gene-centric approach with the IBC array to identify lipid-trait-associated loci that have not been discovered with more conventional approaches. A flow diagram of the performed analyses is illustrated in Figure 1.
Figure 1.
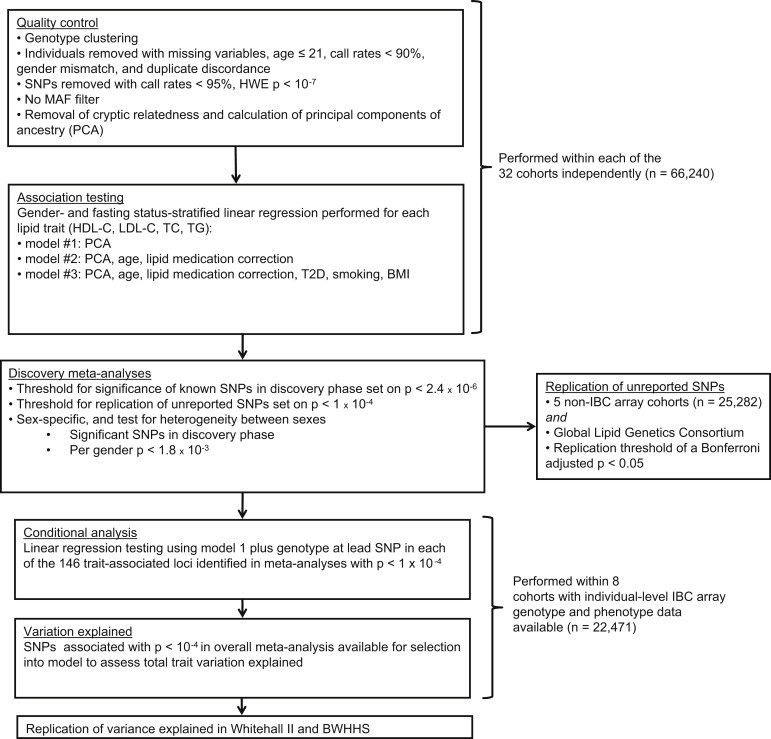
Summary of the Design Used and the Number of Individuals Involved and p Value Thresholds Used in Each Step
Material and Methods
Participating Studies
We analyzed individual-level phenotype and genotype data from 22,471 individuals of European descent in seven cohorts, and an additional 25 cohorts contributed summary-level results for 43,769 individuals, yielding a total sample size of 66,240 (Table S1A, available online). Five additional cohorts containing data from a total of 25,282 individuals were used for replication (Table S1B). Further replication was sought through the GWAS meta-analysis described by the Global Lipids Genetics Consortium (GLGC).6 In addition to the genotype data, we obtained data on body mass index (BMI), age, gender, T2D status, smoking history, and, where available, any treatment for dyslipidemia. Informed consent for DNA analysis was received from each respective local institutional and/or national ethical review board.
Lipid Phenotype Definitions and Correction for the Use of Lipid-Lowering Drugs
Lipid measurements from blood samples collected at baseline or first measurement of each study were used for analysis. We restricted the analyses to those individuals older than 21 years because lipid levels are unstable prior to this age.19 Lipid samples were categorized as “known fasting,” “nonfasting,” or “undefined.” We converted concentrations from mg/dl to mmol/l by dividing by 38.67 for TC, LDL-C, and HDL-C measurements and by dividing by 88.57 for TG measurements. With the exception of the PROCARDIS study, where direct LDL-C assay was used (CHOD/PAP assay in an Olympus AU543020), LDL-C concentration was calculated according to Friedewald’s formula (LDL-C = TC – HDL-C – kTGs), where k is 0.45 for mmol/l (or 0.20 if TGs were measured in mg/dl). LDL-C was treated as a missing value if TG values were > 4.51 mmol/l (>400 mg/dl).21 Prior to analysis, TG levels were transformed with the natural logarithm (ln) for normalizing its distribution.
For individuals receiving lipid-lowering therapy, we multiplied recorded lipid values by a constant: TC was multiplied by 1.271; LDL-C was multiplied by 1.352; HDL-C was multiplied by 0.949, and TGs were multiplied by 1.210 prior to transformation. The multiplicative correction factors were based on analysis of repeatedly measured lipid levels, including levels measured before and after lipid-lowering treatment, in the Whitehall II (WHII) study22 as follows. The expected difference between two data-collection time points 5 years apart for each lipid phenotype was estimated among WHII study participants who were not on lipid-lowering therapy. The mean difference between the expected and observed values for those receiving medication at the latter, but not the former, collection phase was calculated and used as the respective correction factor. The correction factors used here are comparable to published estimates for the effects of statins on lipid values from treatment trials.23
Genotyping and Quality Control
Genotyping was performed with the gene-centric IBC array (Illumina HumanCVD).8 We used genotyping data from the first two versions of the IBC array. Version 1 of the array captures 45,238 SNPs, and version 2 contains an additional 3,989 SNPs, composing a total of 49,227 SNPs. These were clustered into genotypes with Illumina BeadStudio software. Quality-control filters were applied within each cohort at the sample and SNP levels. The filter requirements for the meta-analysis, as sent to each study, required the removal of individuals with a call rate < 90%, gender mismatch, or duplicate discordance. SNPs with call rates < 95% or Hardy-Weinberg equilibrium (HWE) deviation at chi-square p < 10−7 were also removed. To take advantage of the rare variants captured on the array and the large number of samples available, we did not perform any filtering on variants with a low minor allele frequency (MAF) at this stage.
Evaluation of Cryptic Relatedness
Only founders within cohorts with recorded family structure were included in the analysis; the exceptions were the GRAPHIC, HAPI, and PROCARDIS studies, in which family structure was maintained but adjusted for in the association analysis. To ensure removal of cryptic relatedness and duplicate samples, we estimated pi-hat, a measure of identity by descent (IBD), from the pairwise identity by state (IBS) by using PLINK.24 PLINK is a computationally efficient open-source analysis toolset for genetic data and is able to perform a series of basic, large-scale analyses. For each set of duplicates or monozygotic twins, and for those with a pairwise pi-hat > 0.3, the sample with the highest genotyping call rate was retained for analysis.
Evaluation of Population Stratification
For the primary analysis, only individuals of European ancestry were included. Self-reported ethnicity was verified by multidimensional-scaling analysis of IBS distances as implemented in PLINK; HapMap panels were used as reference standards. After SNPs in pairwise linkage disequilibrium (LD) (r2 > 0.3) were removed, EIGENSTRAT software was used for computing principal components on the subset of nonexcluded individuals for use as covariates in the regression analyses. EIGENSTRAT, part of the EIGENSOFT package, corrects for variation in the frequency across ancestral populations through the use of principal components, minimizing potential false-positive signals due to population structure while increasing its power to detect true associations.25,26 Analysis in participants of non-European ancestry is reported in an accompanying paper (C.C.E., unpublished data).
Thresholds for Declaration of Statistical Significance
When LD was accounted for, it was previously calculated that genotyping with the IBC array generates ∼20,500 independent tests for individuals of European descent.27 For maintaining the conventional 5% false-positive rate, the appropriate multiple-testing-corrected threshold for statistical significance was set at p = 2.4 × 10⁻⁶ for the primary analysis.16,18 When the individual-level data were used in the analysis, as in the conditional analysis and variable selection, or when replication was available, we used a more permissive p value threshold of p < 1 × 10⁻⁴. To maintain our statistical power of ∼80% for a SNP with an effect size R2 of 0.05% during the gender-specific analysis, we used a gender-specific threshold of p < 1.8 × 10⁻³. Because the SNPs included in the gender-specific analysis were previously considered significant in the primary main-effect analysis, this choice had little effect on false positives. The GWAS threshold of p < 5 × 10⁻⁸ was referenced as a comparison to common GWAS practice.
Genomic control estimates reflected by lambda (λ), a method for quantifying and adjusting population stratification from population-based samples,28 were derived for each study before the meta-analysis. To avoid the problem of λ estimate inflation due to the high proportion of positive variants (based on the selection criteria of the included SNPs and loci), we excluded the upper 10% of the most statistically significant signals during the estimation of λ.29 METAL used the option to adjust each study with its corresponding λ before the meta-analysis.
Association Testing
Association analysis was performed with an additive genetic model with one degree of freedom for all cohorts. We performed gender-stratified analysis within each study for the following three models: model 1 corrected only for population stratification to filter out any artificial association related to population differences; model 2 corrected for population stratification, age, and lipid-lowering medication, by using the correction factors described above because those two extra variables are believed to affect the relationship between the traits and the genotypes tested; and model 3 corrected for population stratification, age, T2D, smoking, BMI, and lipid-lowering medication as described earlier to further control for additional variables able to influence the observed associations. The main results and conditional analysis were reported on the basis of model 1. Variable selection used signals from all three models, and these were maintained for the section of explained variance. All three models were also considered in our scan for previously unreported signals and the replication of previously published associations. The three models were also used as means for understanding the associations observed when additional factors were controlled. Meta-analysis was performed with METAL,30 and the results were verified with MANTEL31 and the Metafor package in R.32 METAL was run with the option of using the p values for the meta-analysis and took into account sample size and direction of effect, whereas MANTEL used the classical approach of meta-analysis with a fixed-effects model31 and Metafor used a random-effects scheme with the Hunter-Schmidt estimator.33 Reported p values are based on METAL unless otherwise stated. The use of the probability-combination option in METAL does not include the meta-analysis of beta coefficients, although it is able to overcome the problems of differences in phenotype distribution and gender between the studies combined.30 Metafor used a random-effects model that considered differences between studies as part of the heterogeneity adjusted in the model;34 therefore, given the number of available studies and the difference between them, the beta coefficients from Metafor were considered as the most accurate estimations of the underlying “true” effects of the SNPs, and they are presented throughout.
After the main analysis, we tested for gender-specific signals of association by performing the meta-analysis separately for males and females and combining their results. Only SNPs deemed statistically significant in the overall analysis were compared between genders for evidence of heterogeneity of effect. Heterogeneity of the meta-analysis was assessed with the I2 statistic, which describes what percentage of total variation in the study estimates is due to the differences between studies. The statistical significance of the heterogeneity was tested by the chi-square heterogeneity statistic.35 The criteria for selection of SNPs were: a heterogeneity p value < 0.05 between males and females and a gender-specific p value < 1.8 × 10⁻³. When SNPs were in LD (r2 > 0.3), only the strongest associated SNP was presented.
Conditional Analysis
Loci harboring significant evidence of association with p < 10−4 in model 1 were examined for additional signals with conditional analyses in PLINK24 in data from seven European-ancestry cohorts for which individual-level genotype data were available. A term was added to the regression model including the lead SNP as a covariate, and SNPs within the same genomic region (within 1 Mb of the lead SNP) were evaluated for significance. A locus-specific Bonferroni correction, based on the number of tests performed, was then applied for determining the significance of independent signals.16 For loci harboring more than one independent signal, we continued the process until no unreported SNP associations were found.
Variable Selection and Explained Variance
We used variable selection to identify the most informative SNPs to estimate the total phenotypic variance in the lipid phenotype after age and gender adjustment. To avoid removing individuals with missing data from the analysis, we performed variable selection in the individual-level data after imputation of any missing genotypes by using fastPHASE, a package for haplotypic reconstruction and estimation of missing genotypes.36 All SNPs with lipid associations at p < 1.0 × 10⁻⁴ for any of the meta-analysis algorithms were included in the selection procedure. The previously reported GWAS SNPs for each lipid phenotype were obtained from both the National Human Genome Research Institute (NHGRI) Catalog of Published GWASs37 and the GLGC publication.6 All HumanCVD Beadarray SNPs within 500 kb of the reported SNPs were identified with the SNAP38 web tool, and SNPs with the highest LD for each single reported polymorphism were forced into the model. The stepwise selection scheme with the Akaike’s Information Criterion (AIC)39 was implemented in R separately for each chromosome.
Given that the SNP selection was performed in the available individual-level data, including information on previously reported polymorphisms, an estimate of association in the same sample might lead to overestimation of the true effect. Therefore, unbiased estimates of the true variance explained were obtained in the WHII study and British Women Heart and Health Study (BWHHS), which did not contribute individual-level data. The ratio of phenotypic variance explained by our results, which took into account the number of SNPs used and the number of observations, was further compared to that estimated with only the previously reported SNPs. For comparison with previous GWASs, we also estimated the explained variance by using the top SNP at each locus plus the independent SNPs in the region as identified through conditional analysis.
Replication of Previously Undescribed Signals and Previously Unreported Signals
We report two categories of associations—previously unreported SNPs at established loci and SNPs at previously undescribed loci—by using the less stringent statistical threshold of p < 1 × 10⁻⁴. Loci were designated novel if they had not been reported in the NHGRI GWAS database or in the GLGC study,6 and novel SNPs were those that were not reported in the GLGC study6 and that were in LD (r2 ≤ 0.3) with any of the GLGC lead SNPs. Loci within 500 kb of reported signals were not considered novel. To attain the final list of novel SNPs, we checked for LD between SNPs within the list itself. In groups of SNPs in LD (r2 ≤ 0.3), the SNP with the lowest p value was reported.
Replication
Independent replication was then sought for all previously unreported associations. Look ups were performed in five additional cohorts containing data from a total of 25,282 individuals. Characteristics and methodological details for cohorts (referred to as the “25K cohort”) are listed in Table S1B. Additional replication was sought through the GLGC GWAS meta-analysis.6 A signal was considered successfully replicated when its Bonferroni-adjusted p value in the replication sample was lower than 0.05 and when its estimate was directionally consistent with the discovery meta-analysis. Five of the studies (the Cooperative Health Research in the Region of Augsburg Study, the Atherosclerosis Risk in Communities Study, the University of Pennsylvania Catheterization Study, the Cardiovascular Health Study, and the British Genetics of Hypertension Study) used for this meta-analysis had previously contributed data to the GLGC. These studies were thus removed from the meta-analysis of the discovery with both replication studies.
Results
Characteristics of Study Samples
A total of 49,227 SNPs were tested in a meta-analysis of 32 cohorts of 66,240 individuals of European ancestry (Table S1A). The ratio of the observed to the null median test statistic, λ, was ≤1.1 for all studies, except for the GRAPHIC (the Genetic Regulation of Arterial Pressure of Humans in the Community) study, the HAPI (Heredity and Phenotype Intervention) heart study, and PROCARDIS (the Precocious Coronary Artery Disease Study), where related individuals were included. The GRAPHIC study had a λ of 1.2 for all phenotypes considered, and it decreased to ∼1.06 when rare variants (MAF < 0.1%) were excluded from the data. Both the HAPI study and PROCARDIS had λ values of ∼1.10 and 1.12 for LDL-C and TC, respectively, but these again decreased to ≤ 1.1 when rare variants (MAF < 0.1%) were excluded.
Meta-analysis
We observed 598, 491, 575, and 609 statistically significant (p < 2.4 × 10⁻⁶) associations for HDL-C, LDL-C, TC, and TGs, respectively, by using model 1 in METAL (Table S2). After we excluded SNPs present in fewer than 80% of the studies and filtered associations with a meta-analysis I2 value for heterogeneity > 35%, the number of statistically significant SNPs was reduced to 276 for HDL-C, 158 for LDL-C, 269 for TC, and 242 for TGs (Table S3). Of the 2,273 statistically significant associations before filtering, 1,094 were with SNPs of MAF < 1%, and 1,088 of these had an I2 value > 35% (Table S2). In total, given that several SNPs were associated with more than one phenotype and that SNPs were clustered tightly at certain loci, we identified 549 study-wide significant SNPs in and around 114 different genes. Figure S1 shows the overlap of the identified signals between traits; Manhattan plots for each phenotype are shown in Figure 2.
Figure 2.
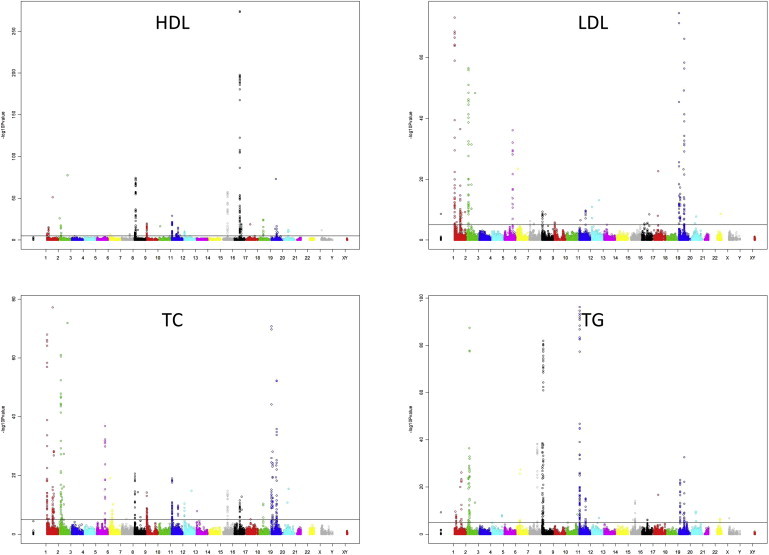
Manhattan Plots for HDL-C, LDL-C, TC, and TG Data from the IBC Lipid Meta-analysis Show p Values Based on Those Obtained from the METAL Meta-analysis
We also analyzed the data by using MANTEL and the Metafor package in R. Although each algorithm used a slightly different method for the meta-analysis, 98% and 95% of the top 100 signals for all phenotypes were also significant in Metafor and MANTEL, respectively. Of the 945 filtered significant associations observed in METAL, 78% were also significant in Metafor and 80% were significant in MANTEL (Table S3). The differences in the results between the three packages were mainly observed in associations with SNPs of low frequency, of high heterogeneity, or with minor statistical-significance differences, which were close to our cutoff thresholds.
The meta-analysis of plasma-lipid levels, corrected for lipid-lowering medication and adjusted for age (model 2) or for BMI, T2D, and current smoking status (model 3) gave similar results. A summary of the differences (in terms of gene loci identified) between the three models is shown in Figure 3. For the four phenotypes, the Pearson correlation coefficients of the test statistics varied between 0.86 and 0.92 (for models 1 and 2) and between 0.85 and 0.89 (for models 1 and 3). The correlation between models 2 and 3 was 0.94–0.97.
Figure 3.
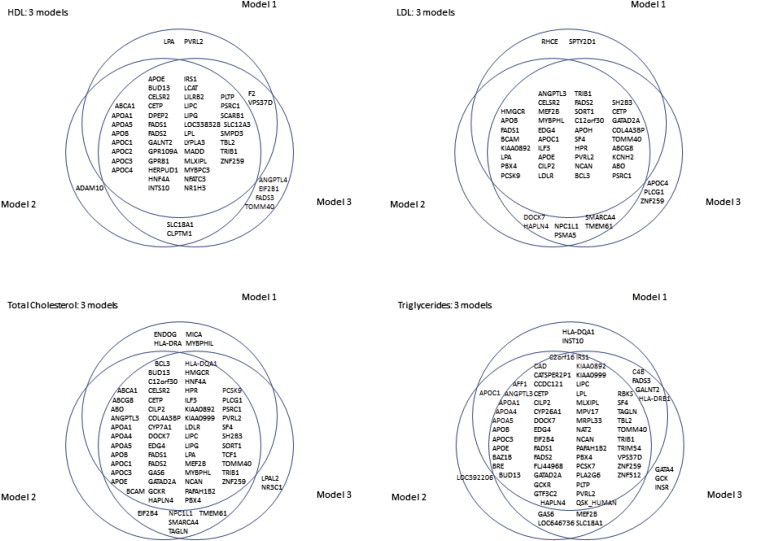
Venn Diagram per Phenotype for the Comparison of the Three Models Used
Model 1 corrects only for population stratification; model 2 corrects for population stratification, age, and lipid medication; and model 3 corrects for population stratification, age, T2D, smoking, BMI, and lipid medication. Only signals with p < 2.4 × 10⁻⁶ are included.
Conditional Analysis
Because of the dense gene-centric nature of the IBC array, SNPs showing association unsurprisingly formed tight clusters. Using a p < 10−4 threshold, we examined 39 loci for HDL-C, 34 loci for LDL-C, 41 loci for TC, and 32 loci for TGs. Conditioning on the SNP with the strongest p value, we identified independent signals for four traits (Table S4). Although four independent signals were observed in the LPL (MIM 609708) locus and three signals were observed in the BUD13-APOA5 (MIM 606368) cluster for HDL and TGs, only two SNPs (rs268 and rs3289) in the LPL locus were overlapping between the phenotypes.
Gender-Specific Analysis
Of the 66,240 individuals included in the meta-analysis, 31,513 were males and 34,727 were females. The data were analyzed with stratification by gender in each cohort, and the first-stage meta-analysis included both genders. We also tested each gender separately, and the results were compared for concordance between genders. All of the SNPs showing heterogeneity of effect between males and females had the same direction of effect with the overall analysis, but one gender showed a significantly weaker association than the other. Gender-specific differences were found for the individual lipid traits (14 SNPs for HDL-C, 9 SNPs for LDL-C, 14 SNPs for TGs, and 9 SNPs for TC [Table S5]).
Explained Variance
Variable selection used all unfiltered signals, including 1,156 SNPs for HDL-C, 1,063 SNPs for LDL-C, 1,173 SNPs for TC, and 1,139 SNPs for TGs, identified as significant at the p < 10−4 threshold from any of the three meta-analysis algorithms. Additionally, previously reported SNPs were forced into the model and included 41 SNPs for HDL-C, 25 SNPs for LDL-C, 22 SNPs for TC, and 35 SNPs for TGs. On the basis of the AIC evaluation, 71 SNPs in HDL-C, 79 SNPs in LDL-C, 120 SNPs in TC, and 75 SNPs in TGs appear to carry additional information beyond the previously reported SNPs. All SNPs, including the previously reported SNPs that were forced into the model, that were retained after variable selection are described in Table S6.
Using the list of SNPs identified by variable selection, we estimated the percentage of explained phenotypic variance in the subset of studies providing individual-level data. After adjustment for age and gender, the identified SNPs explained 9.9% (with 112 SNPs) of the variance in HDL-C, 9.5% (with 104 SNPs) of the variance in LDL-C, 10.3% (with 142 SNPs) of the variance in TC, and 8.0% (with 110 SNPs) of the variance in TGs. Using data derived from previously reported lipid-associated SNPs available in the IBC array, we observed much lower percentages: 6.3% for HDL-C, 4.8% for LDL-C, 4.1% for TC, and 5.5% for TGs. For comparison, using the common approach of including only the top signal from each locus plus any independent SNP after conditional analysis, we were able to explain 7.9% of the HDL-C variance, 8.4% of the LDL-C variance, 8.2% of the TC variance, and 6.3% of the TG phenotypic variance.
To avoid overestimation resulting from using the same data sets for SNP selection and testing, we also estimated the variance explained in the WHII study and the BWHHS, which did not contribute individual-level data used in the variable selection. For the WHII study, the AIC-selected SNPs explained 11.5% of the variations in HDL-C, 15.6% of the variations in LDL-C, 13.2% of the variations in TC, and 9.8% of the variations in TGs, whereas the previously reported SNPs explained 7.9%, 8.2%, 6.7%, and 7.4% of the phenotypic variance in HDL-C, LDL-C, TC, and TGs, respectively. The corresponding estimates for the BWHHS were 8.2% for HDL-C, 10.7% for LDL-C, 8.1% for TC, and 8.2% for TGs when all the selected SNPs were included in the analysis and 6.0% for HDL-C, 4.2% for LDL-C, 2.6% for TC, and 5.7 for TGs when only the previously reported SNPs were considered. The estimated explained variance, approximate to the heritability due to additive genetic effects, was 10.9% (males) and 12.2% (females) for HDL-C, 12.8% (males) and 11.53% (females) for LDL-C, 12.7% (males) and 12.6% (females) for TC, and 10.7% (males) and 8.6% (females) for TGs (Table S7).
Confirmation of Previously Reported Signals
The IBC array covered 57 of the 95 loci reported in the GLGC study6 and did not include two of the top 20 HDL-C loci (KLF14 [MIM 609393] and LILRA3 [MIM 604818]), two of the top 20 LDL-C loci (TOP1 [MIM 126420] and ST3GAL4 [MIM 104240]), any of the top 20 TC loci, and two of the top 20 TG loci (KLHL8 [MIM 611967] and FRMD5). Among the directly genotyped SNPs in the IBC array, we were able to replicate the association between HDL-C and 13 out of 18 SNPs, between LDL-C and 11 of 21 SNPs, between TC and 16 of 26 SNPs, and between TGs and 9 of 18 SNPs, each at a threshold of p < 10−4. Similarly, for the previously reported loci, the lowest p value SNP in our results replicated 23 of 32 available HDL-C loci, 23 of 32 available LDL-C loci, 30 of 43 available TC loci, and 21 of 29 TG loci. Out of the 57 loci cited above, 31 had specifically the same SNP genotyped by both the GLGC and the IBC array. For those, thus, there was information on directions of effect for both the GLGC and IBC array. In total, these represent 49 signals (given that one SNP can be significant for more than one trait); 13 of those were significant for HDL-C, 11 were significant for LDL-C, 16 were significant for TC, and 9 were significant for TGs. Only one SNP, rs12027135 from LDLRAP1 (MIM 605747), was found with a non-statistically-significant effect and a direction opposite of that from the GLGC study for two traits (LDL-C and TC).
In addition to the association reported in previous studies, we also identified significant associations for LCAT (MIM 606967), LRP1 (MIM 107770), LPA (MIM 152200), IRS1 (MIM 147545), and PCSK9 (MIM 607786) loci at the GWAS p value cutoff of p < 5 × 10⁻⁸ (Table S8).
Previously Unreported Signals
Using a p < 1.0 × 10⁻⁴ threshold, we identified 48 significant SNP associations in novel and previously reported genes for HDL-C, and 17 of these are in previously unreported genes. For LDL-C, we identified 38 significantly associated SNPs that were not previously reported in either the NHGRI GWAS database or in the GLGC study.6 Of these, 18 were located within genes without any previously annotated effect on LDL-C. Similarly, for TC we observed 47 SNPs not previously reported in established genes and 15 SNPs in previously undescribed genes. Finally, for TGs we observed 49 associations, including signals in the 18 genes not previously reported. With the array-wide significance level of p < 2.4 × 10⁻⁶, there were 11, 5, 12, and 6 novel SNPs for HDL-C, LDL-C, TC, and TGs, respectively. Several loci not previously reported were observed with an array-wide significance of p < 2.4 × 10⁻⁶ (Table S9).
Replication
SNPs that showed a significant (p < 1.0 × 10⁻⁴) association and that were not previously reported to be associated with lipids were considered for replication in additional studies. These were examined either in our own replication sample of the 25K cohort or with the GLGC data. In total, 23 of the total 69 putative novel gene signals identified in stage 1 were found to be significantly associated in the replication stage. Three of these SNPs reached a GWAS level of significance (p < 5 × 10⁻⁸) in the discovery phase and two replicated (67%), nine more reached our array-wide significance and five replicated (56%), and a further 57 surpassed the permissive 10−4 cutoff, at which sixteen signals (28%) were replicated.
Of all the signals tested, 11 associations were replicated for HDL-C, 11 were replicated for LDL-C, 17 were replicated for TC, and 12 were replicated for TGs. These replicated signals were in 21 gene regions not previously reported as associated with the lipid phenotypes considered here. A total of 23 signals were replicated in the 25K cohort and/or the GLGC study: five for HDL-C, five for LDL-C, seven for TC, and six for TGs (Table S9). Together with the results of the overall meta-analysis, details of the lead SNPs replicated in each of the novel genes are provided in Table 1.
Table 1.
Replicated Previously Unreported Genes
| Gene | Trait | Model | SNP | Chr | Position |
Discovery |
25K Replication |
GLGC Replication |
Overall Meta-analysis | ||||||||||||
|---|---|---|---|---|---|---|---|---|---|---|---|---|---|---|---|---|---|---|---|---|---|
| Allele 1 | Allele 2 | Freq 1 | Number of Individuals | p Value | Direction | Het p Value | Number of Individuals | p Value | Direction | Het p Value | Mult Adj p Value | GLGC p Value | Direction | GLGC Mult Adj p Value | |||||||
| PPARG | HDL | 3 | rs12631819 | 3 | 12,317,861 | T | G | 0.0285 | 53,187 | 1.72 × 10⁻⁵ | − | 0.2150 | 10,567 | 2.42 × 10⁻¹ | + | 0.6780 | 1.00 | 2.27 × 10⁻⁴ | − | 1.64 × 10⁻² | 8.35 × 10⁻⁶ |
| GP1HBP1 | HDL | 2 | rs7388248 | 8 | 144,376,728 | C | G | 0.2878 | 54,144 | 3.30 × 10⁻⁷ | + | 0.7494 | 14,374 | 1.42 × 10⁻² | + | 0.5845 | 1.00 | 4.03 × 10⁻⁴ | + | 2.90 × 10⁻² | 2.93 × 10⁻⁹ |
| DGAT2 | HDL | 1 | rs11236530 | 11 | 75,167,052 | A | C | 0.4246 | 61,617 | 2.44 × 10⁻⁶ | − | 0.6566 | 24,732 | 3.80 × 10⁻⁵ | − | 0.3281 | 2.74 × 10⁻³ | 4.92 × 10⁻³ | − | 3.54 × 10⁻¹ | 1.40 × 10⁻⁹ |
| HCAR2 | HDL | 3 | rs4759361 | 12 | 121,744,233 | A | T | 0.1584 | 53,194 | 2.05 × 10⁻⁹ | + | 0.8481 | 13,902 | 6.24 × 10⁻¹ | + | 0.2468 | 1.00 | 1.00 × 10⁻⁶ | + | 7.23 × 10⁻⁵ | 2.50 × 10⁻¹² |
| FTO | HDL | 2 | rs1421085 | 16 | 52,358,455 | T | C | 0.6095 | 54,286 | 5.76 × 10⁻⁵ | + | 0.1952 | 14,373 | 1.08 × 10⁻¹ | + | 0.8410 | 1.00 | 3.31 × 10⁻⁵ | + | 2.38 × 10⁻³ | 2.33 × 10⁻⁸ |
| VLDLR | LDL | 2 | rs7024888 | 9 | 2,626,992 | T | C | 0.9523 | 48,970 | 4.38 × 10⁻⁵ | + | 0.8693 | 2,998 | 1.66 × 10⁻¹ | + | 0.4035 | 1.00 | 4.95 × 10⁻⁵ | + | 3.02 × 10⁻³ | 7.51 × 10⁻⁸ |
| SPTY2D1 | LDL | 1 | rs11024739 | 11 | 18,602,419 | A | C | 0.5514 | 55,610 | 3.09 × 10⁻⁷ | + | 0.3205 | 24,393 | 7.49 × 10⁻¹ | + | 0.5482 | 1.00 | 4.14 × 10⁻⁶ | + | 2.53 × 10⁻⁴ | 6.04 × 10⁻¹⁰ |
| BRCA2 | LDL | 3 | rs9534275 | 13 | 31,838,345 | A | C | 0.5149 | 47,864 | 4.61 × 10⁻⁶ | − | 0.4505 | 13,886 | 8.26 × 10⁻¹ | + | 0.4184 | 1.00 | 2.48 × 10⁻⁷ | − | 1.51 × 10⁻⁵ | 5.67 × 10⁻⁹ |
| SOCS3 | LDL | 2 | rs4082919 | 17 | 73,889,077 | T | G | 0.5148 | 48,687 | 2.33 × 10⁻⁵ | + | 0.5148 | 14,347 | 1.17 × 10⁻³ | + | 0.1111 | 4.45 × 10⁻² | 3.58 × 10⁻¹ | + | 1.00 | 4.46 × 10⁻⁴ |
| APOH | LDL | 1 | rs1801689 | 17 | 61,641,042 | A | C | 0.9646 | 55,363 | 2.80 × 10⁻¹¹ | − | 0.6439 | 2,999 | 5.56 × 10⁻¹ | − | 0.3226 | 1.00 | 2.10 × 10⁻⁵ | − | 1.28 × 10⁻³ | 9.41 × 10⁻¹⁴ |
| C4B | TGs | 1 | rs389883 | 6 | 32,055,439 | T | G | 0.6323 | 57,442 | 8.63 × 10⁻⁷ | + | 0.9931 | 14,638 | 3.81 × 10⁻² | + | 0.9599 | 1.00 | 3.95 × 10⁻¹⁵ | + | 2.85 × 10⁻¹³ | 9.90 × 10⁻¹⁹ |
| LPAL2 | TGs | 3 | rs3123629 | 6 | 160,826,076 | A | G | 0.3445 | 47,279 | 3.76 × 10⁻⁵ | + | 0.5835 | 13,935 | 5.23 × 10⁻¹ | + | 0.5929 | 1.00 | 1.20 × 10⁻⁶ | + | 8.60 × 10⁻⁵ | 4.40 × 10⁻⁸ |
| GCK | TGs | 3 | rs2070971 | 7 | 44,164,108 | T | G | 0.132 | 49,207 | 2.23 × 10⁻⁶ | + | 0.2751 | 13,900 | 1.18 × 10⁻² | + | 0.8145 | 8.46 × 10⁻¹ | 3.08 × 10⁻⁴ | + | 2.22 × 10⁻² | 2.25 × 10⁻⁷ |
| GATA4 | TGs | 3 | rs6983129 | 8 | 11,628,545 | A | C | 0.4918 | 49,262 | 2.30 × 10⁻⁶ | + | 0.9860 | 13,940 | 2.02 × 10⁻¹ | + | 0.2548 | 1.00 | 7.54 × 10⁻⁶ | + | 5.43 × 10⁻⁴ | 2.62 × 10⁻⁸ |
| SERPINF2 | TGs | 3 | rs2070863 | 17 | 1,595,252 | T | C | 0.2109 | 49,243 | 3.73 × 10⁻⁵ | + | 0.6577 | 13,903 | 4.41 × 10⁻⁴ | + | 0.3132 | 3.18 × 10⁻² | 5.95 × 10⁻³ | + | 4.28 × 10⁻¹ | 2.41 × 10⁻⁵ |
| INSR | TGs | 1 | rs8112883 | 19 | 7,130,320 | T | G | 0.3269 | 57,525 | 8.55 × 10⁻⁶ | − | 0.2601 | 14,635 | 4.61 × 10⁻¹ | − | 0.8751 | 1.00 | 2.85 × 10⁻⁵ | − | 2.05 × 10⁻³ | 4.76 × 10⁻⁶ |
| FCGR2A | TC | 3 | rs1801274 | 1 | 159,746,369 | A | G | 0.5016 | 53,200 | 2.25 × 10⁻⁵ | + | 0.9812 | 13,976 | 2.54 × 10⁻³ | + | 0.5643 | 2.04 × 10⁻¹ | 1.58 × 10⁻⁴ | + | 1.26 × 10⁻² | 3.67 × 10⁻⁸ |
| INSIG2 | TC | 3 | rs12464355 | 2 | 118,566,320 | A | G | 0.9263 | 53,171 | 6.26 × 10⁻⁵ | + | 0.6811 | 13,851 | 7.66 × 10⁻³ | + | 0.4101 | 6.13 × 10⁻¹ | 8.69 × 10⁻⁵ | + | 6.96 × 10⁻³ | 1.19 × 10⁻⁸ |
| UGT1A1 | TC | 1 | rs11563251 | 2 | 234,344,123 | T | C | 0.0934 | 65,731 | 3.46 × 10⁻⁶ | + | 0.0242 | 14,678 | 2.56 × 10⁻¹ | + | 0.0790 | 1.00 | 1.50 × 10⁻⁶ | + | 1.20 × 10⁻⁴ | 2.50 × 10⁻⁹ |
| CHUK | TC | 3 | rs11597086 | 10 | 101,943,695 | A | C | 0.5885 | 52,928 | 3.54 × 10⁻⁵ | − | 0.4075 | 13,998 | 2.05 × 10⁻¹ | − | 0.3244 | 1.00 | 5.81 × 10⁻⁵ | − | 4.65 × 10⁻³ | 2.99 × 10⁻⁹ |
| UBE3B | TC | 3 | rs7298565 | 12 | 108,421,917 | A | G | 0.5254 | 48,938 | 1.47 × 10⁻⁵ | + | 0.8893 | 13,997 | 7.93 × 10⁻¹ | + | 0.3195 | 1.00 | 1.25 × 10⁻⁴ | + | 1.00 × 10⁻² | 1.98 × 10⁻⁶ |
| BRCA2 | TC | 2 | rs9534275 | 13 | 31,838,345 | A | C | 0.5157 | 54,094 | 4.16 × 10⁻⁶ | − | 0.6331 | 14,407 | 3.59 × 10⁻¹ | + | 0.3510 | 1.00 | 2.47 × 10⁻⁵ | − | 1.98 × 10⁻³ | 5.39 × 10⁻⁷ |
| SOCS3 | TC | 2 | rs4082919 | 17 | 73,889,077 | T | G | 0.5159 | 54,065 | 1.22 × 10⁻⁵ | + | 0.7658 | 14,415 | 1.61 × 10⁻⁴ | + | 0.0394 | 1.29 × 10⁻² | 9.56 × 10⁻³ | + | 7.65 × 10⁻¹ | 8.91 × 10⁻⁷ |
The following abbreviations are use: chr, chromosome; freq, frequency; het, heterogeneity; mult adj, multiple-variate-adjusted; GLGC, Global Lipids Genetics Consortium; HDL, high-density lipoprotein; LDL, low-density lipoprotein; TGs, triglycerides; and TC, total cholesterol.
Additionally, previously unreported SNPs in known loci were also identified. Four SNPs were associated with HDL-C, six were associated with LDL-C, ten were associated with TC, and four were associated with TGs. The results for all SNPs and loci tested for replication are presented in Table S9.
Discussion
To explore association with HDL-C, LDL-C, TC, and TG levels, we used a large-scale locus-centric approach to test 49,227 SNPs carefully prioritized for CVD-related loci in 32 studies with a combined discovery sample size of up to 66,240 individuals of European ancestry. Using an additional sample of 25,282 individuals and the available data derived from the GLGC study,6 we identified 21 additional loci that have not been associated with lipid levels before and were able to confirm a number of the previously reported associations. We also observed in multiple loci gender-specific differences that were identifiable at the level of explained variance. Finally, although the array covers a smaller proportion of the genome, our heritability estimates were comparable to current GWAS estimates.
Recently, gene-based arrays (such as the IBC array) and the “Metabochip,” “Immunochip,” and “exome-chip” arrays with content derived from GWASs, next-generation sequencing, and other plausible sources (such as functional studies) are becoming increasingly popular and offer significant value to individual investigators and consortia.40–42 They allow the flexibility of incorporating index SNPs, as well as denser probe coverage for finer mapping, across a large number of loci, permitting selective coverage for a range of prioritized findings. The GLGC study6 provides the most current analysis of the entire genome for common polymorphisms that underpin circulating concentrations of HDL-C, LDL-C, TC, and TGs. Working under the hypothesis that any individual SNP tested is unlikely to have a true effect on the particular phenotype of interest, the GLGC was able to identify SNPs explaining 0.05% of the phenotypic variance with 94.75% power, whereas in our data the same SNPs had 85.07% power to explain the same proportion of the phenotypic variance. This might in part explain our inability to replicate the entire set of SNPs identified in the GLGC study. Nevertheless, these differences in power do not take into account the fact that, compared to those in the GWAS, the SNPs tested here were more likely to be associated with the phenotypes tested because of the selection of SNPs derived from available information concerning a putative role in lipid metabolism. This is apparent from the extreme quantile-quantile plots seen in hypothesis-driven arrays compared to typical GWASs. Such candidate-loci arrays also allow “cosmopolitan tagging” approaches to ensure that sufficient markers across loci of interest for multiple ancestries are achieved. Much of the lipid content of the 2,000 loci on the IBC array was derived from pathway-based candidates.8 Fifty-seven loci present on the IBC array were associated with lipid traits in the GLGC study. Importantly, however, at the time of array design, very few loci were shown to be robustly associated with lipid phenotypes, showing the clear utility of such candidate-loci approaches for generating putative candidates for validation in large numbers of individuals. One shortcoming of hypothesis-driven genotyping arrays is limited coverage—38 out of the reported 95 previously reported GLGC loci were not represented on the IBC array. Despite this, the great majority, 74 out of 80, of the strongest associations were covered with greater density than before, highlighting the utility of such approaches. Furthermore, aggregation of data sets such as those presented here has clear utility for conditional analyses—we show that 27 loci have more than one independent signal for the examined lipid traits.
Our most significantly associated locus for HDL-C was CETP (MIM 118470). CETP is a hydrophobic glycoprotein, which, upon secretion by the liver, is bound mainly to HDL particles in the plasma.43 CETP inhibitors have been shown to significantly increase plasma HDL-C levels and thereby mimic the hyperalphalipoproteinemia encountered in patients with CETP deficiency.44 For both LDL-C and TC, LDLR (low density lipoprotein receptor [MIM 606945]) had the lowest p value. LDLR encodes the cell-surface LDL receptor, which removes circulating LDL via receptor-mediated endocytosis. More than 1,600 rare, loss-of-function mutations in LDLR have been shown to cause familial hypercholesterolemia.45–47 Finally, the locus with the strongest association with TG levels was BUD13 (functional spliceosome-associated protein 71), which is located at the same chromosome 11 locus that contains the APOA1-C3-A4-A5-ZNF259 (MIM 107680) cluster. In the GLGC GWAS meta-analysis, the top hit for TGs, rs964184 in APOA1 (MIM 107680), lies within the BUD13 promoter. BUD13 is a yeast homolog of an active spliceosome, but little is known about its function in humans. Two of the encoded apolipoproteins, apoA-V and apoC-III, within the cluster influence the activity of lipoprotein lipase (LPL) activity, which is central to hydrolysis of circulating TG-rich lipoproteins. Variants in these genes have long been associated with clinical hypertriglyceridemia.48,49
Two of our top signals, CETP and BUD13, show evidence of gender-specific effects. A wide variety of phenotypes, including CHD, demonstrate sexual dimorphism.50 Thus, some of the strongest signals we found might be important in one gender alone. An illustrative example is CETP, for which SNPs rs17231506 and rs12720922 were both differentially associated with HDL-C levels in men and women. This relationship has been previously suggested, and gender-specific differences in expression levels of the gene product have been hypothesized.51 Other previously reported SNPs, also shown here to have gender-interactions, include rs531819, rs17398765, rs1367117 in APOB (MIM 107730),52 rs4953023 in ABCG8 (MIM 605460),53–55 rs157580 in TOMM40 (MIM 608061), which is close to APOE (MIM 107741),56 and rs12721109 in APOC4 (MIM 600745).57 In addition to gender differences in association with individual SNPs, we observed between-sex differences in trait heritability. Of the four lipid phenotypes examined, LDL-C and TC had minimal between-gender differences in heritability—1.06% and 0.2%, respectively. Females showed higher heritability for HDL-C (1.5% difference), and males showed higher heritability for TGs (1.9% difference). Our results, except those for TGs, are similar to those reported by Weiss et al.5—LDL-C showed small narrow-sense heritability differences, and females had higher narrow-sense heritability of HDL-C than did males. In contrast to our findings, Weiss and colleagues5 showed a stronger but nonsignificant heritability in females compared to men for TGs.
Of the 49,227 SNPs in the array, ∼21% had a MAF < 1%, whereas in the 2,273 unfiltered significant associations observed, 48% had a MAF < 1%. After filtering, 0.06% of the significant associations were SNPs of MAF < 1%. Compared to their overall proportion on the array, the higher proportion of rare SNPs passing the array-wide p value threshold can be attributed, in part, to their high heterogeneity. In the majority of cases, SNPs with genotyping errors show high levels of heterogeneity between studies. This might suggest that current methods cannot easily genotype or call uncommon SNPs. A technical note from Illumina58 reported that accurate calling of rare variants is possible, although there is an increase in the error rate for rare-allele homozygotes. It is also possible that carriers of rare functional SNPs will have an extreme phenotype, leading, in some cases, to exclusion from the study or to a greater measurement bias in some studies compared to others. At least some of the rare SNPs in our results are known to have functional mutations with large effects. APOB (MIM 107730) SNP rs5742904 has a p value of 1.039 × 10−46 with LDL-C in our meta-analysis but has an I2 of 96.6%. SNP rs5742904 is a known rare mutation (c.10580G>A [p.Arg3527Gln]) (RefSeq accession number NM_000384.2; ENSG00000084674) involved in hypercholesterolaemia and early CHD.59,60 The mutation, which has been shown to reduce the affinity for the LDL cholesterol particle, where ApoB is the single protein component for the receptor, is present in 5% of patients with familial hypercholesterolaemia (MIM 143890) in the UK.61 The identification of rare SNP associations is a substantial challenge, and although we observed a number of strong probable associations, high heterogeneity precludes any firm conclusions.
Our results point toward the existence of multiple independent lipid-associated SNPs in several different loci. One example is LPL (lipoprotein lipase), for which the classical view of the primary functional importance of the c.1421C>G (p.Ser447∗) variant (rs328), which causes a premature stop codon, has been modified by the findings that several different polymorphisms at this locus concurrently affect LPL expression.62,63 Interestingly, all of our top signals—CETP, LDLR, and the BUD13 cluster—show evidence of the existence of more than one functional SNP. Especially for the cluster around BUD13, the risk allele rs9804646-T (MAF = 0.08) is on the same haplotype as the protective allele of the top SNP (rs10750097) in the region, making the former identifiable only after conditional analysis. If this turns out to be the rule for the genetic architecture of lipid loci, any single identified signal at a locus will underestimate the explained variance. Future clinical use in prediction of lipid levels will require more sophisticated approaches for fully capturing information, irrespective of the levels of significance in discovery and replication studies. A number of statistical and computational criteria for selecting the most relevant and informative SNPs are available. Here, we used the AIC criterion as a balance between being inclusive of the SNPs used and avoiding overfitting. It is possible that the exclusive use of only the most significant, not the most informative, SNPs is partly responsible for much of the “missing” heritability that cannot be explained by additional modest-effect common variants.64 The truly causal polymorphisms are not always included within the genotyped SNPs, making heritability estimates dependent on the LD between causal and observed SNPs.65 Methods such as selection with AIC or the approach used by Yang et al.,66 which account for the total information in the area, will recover some of this missing information, as our results suggest. In addition, use of stringent thresholds of statistical significance will exclude polymorphisms explaining a very small percentage of the variation, despite the potential impact of a great number of such SNPs. Our own results and the work by Yang and colleagues65 suggest that common SNPs, which do not reach generally acceptable significant levels, are likely to hold additional information. Rare variants still undiscovered might explain some of the “missing” heritability of plasma-lipid phenotypes,67 but it is not clear how much extremely rare changes can contribute to a population measure such as heritability. Gene × gene and gene × environment interactions can also play an important role, but statistical constraints hinder their identification.67 Transgenerational epigenetic alterations have also been suggested as possible sources of heritability,68 but if they persist for many generations, it is likely that they will acquire LD with a SNP already in the analysis.69
For these same reasons, we were also less stringent with our criteria in pursuing potentially novel signals for downstream replication by using a p < 1 × 10⁻⁴ threshold instead of our array-wide significance level of p < 2.4 × 10⁻⁶. To avoid any increase of false-positive signals, we applied the stringent Bonferroni correction in our replication p values. We used a very specific definition to declare novelty of a signal. Previously unreported loci were defined as those not described in either the NHGRI GWAS database or by the initial GLGC publication,6 and previously unreported SNPs were defined as those that were not reported in the GLGC study6 and that were in LD (r2 < 0.3) with a lead GLGC SNP. This caused some previously characterized SNPs and loci from candidate-gene studies (these SNPs had not been replicated in any GWAS) to be considered novel in our analysis. GATA4 (MIM 600576) is an example of such. Although its association with TGs was missed by the GWAS, evidence in mice, and recently in humans, reveals that the coded protein is involved in TG absorption from the intestine and underpins plasma TG levels.70
The most challenging aspect of evaluating large data sets is that it is extremely difficult to find an ideal replication sample, which is bigger than the discovery set, in such a large meta-analysis setting, where most large studies have been exhausted. We used five previously reported GWASs with and without imputed genotype data. This resulted in an uneven replication in which very few SNPs could be genotyped across the entire replication sample, and most were available only in a fraction of the studies. Considering that we most likely overestimated the true effect size of each SNP, in accordance with the winner’s curse, the power to replicate our signals in a smaller sample is markedly reduced. Nevertheless, a small number of signals, notably DGAT2 (MIM 606983) for HDL-C, SOCS3 (MIM 604176) for TC and LDL, and SERPINF2 (MIM 613168) for TGs, were replicated. The published GLGC data evaluated ≥ 2.5 million SNPs (both directly genotyped and imputed) in more than 100,000 individuals and, as such, provided a much more reliable replication set. On the basis of this replication, a further 21 previously unreported loci were confirmed. Moreover, we were also able to identify three SNPs that added additional information to what was previously published. The rs753381 variant is a coding nonsynonymous SNP in PLCG1 (MIM 172420) and is considered in the GLGC study as part of the LDL-C association with TOP1 (MIM 126420) (rs6029526). The LD between rs753381 and the previously reported rs6029526 is r2 = 0.82, but phospholipase C, gamma 1 (PLCG1) was reported to affect cholesterol solubility in bile.71 Therefore, we speculate that this variant might influence serum-cholesterol levels through interference with the cholesterol cycle and that the relevant locus for the association with LDL-C is PLCG1 rather than TOP1. SNP rs389883, in an intron of C4B (MIM 120820), is significantly associated with TGs in both our data and in the GLGC results, but it is not included in the GLGC-reported signals. Similarly, TCF1 rs2244608, associated with LDL, is only included in the ethnic analysis, but not in the main results of the GWAS meta-analysis.
Well-known genes for other metabolic phenotypes were included in the replicated, previously unreported, signals; one example is FTO (MIM 610966) for BMI. FTO is believed to be involved in the regulation of food intake and to affect lipolysis in adipose tissue,72 whereas in our data, FTO is also associated with HDL-C, probably through its association with BMI, as the loss of significance in model 3 suggests (p = 0.8805). BRCA2 (MIM 600185), here associated with LDL-C, and BRCA1 are two of the best known genes in which mutations are associated with breast and ovarian cancers.73 The precise function of BRCA2 (MIM 600185) is unclear, but its encoded protein has been implicated in a variety of processes, including DNA repair and recombination, cell-cycle control, and transcription.74 Some of our other signals are already clinically significant. For example, HCAR2 (MIM 609163), also known as niacin receptor 1, is an important biomolecular target of niacin, which is a widely prescribed drug for the treatment of dyslipidemia and which acts primarily by inhibiting hepatic DGAT-2 (MIM 606983) and thus lowers secretion of TG-rich lipoproteins and increases HDL-C levels.75,76
The evidence from the cumulative meta-analysis of our-data, the replication studies, and the published GLGC results suggest that further “true” signals might be found with less stringent p value thresholds. Given the recent deluge of available genetic data, we propose that a more careful examination is required of common variants of moderate and small effects. This might help explain portions of missing heritability, elucidate the pathways and mechanisms involved in lipid metabolism and CHD, and identify potential loci in which rare SNPs with large effects on the phenotype can be discovered.
Contributor Information
Brendan J. Keating, Email: bkeating@mail.med.upenn.edu.
Fotios Drenos, Email: f.drenos@ucl.ac.uk.
Supplemental Data
Web Resources
The URLs for data presented herein are as follows:
Catalog of Published Genome-Wide Association Studies, http://www.genome.gov/gwastudies
GLGC Meta-analysis Data, http://www.sph.umich.edu/csg/abecasis/public/lipids2010/
Online Mendelian Inheritance in Man (OMIM), http://www.omim.org
SNP Annotation and Proxy Search (SNAP), http://www.broadinstitute.org/mpg/snap/
References
- 1.Lopez A.D., Mathers C.D., Ezzati M., Jamison D.T., Murray C.J. Global and regional burden of disease and risk factors, 2001: Systematic analysis of population health data. Lancet. 2006;367:1747–1757. doi: 10.1016/S0140-6736(06)68770-9. [DOI] [PubMed] [Google Scholar]
- 2.Berenson G.S., Srinivasan S.R., Bao W., Newman W.P., 3rd, Tracy R.E., Wattigney W.A. Association between multiple cardiovascular risk factors and atherosclerosis in children and young adults. The Bogalusa Heart Study. N. Engl. J. Med. 1998;338:1650–1656. doi: 10.1056/NEJM199806043382302. [DOI] [PubMed] [Google Scholar]
- 3.Arsenault B.J., Boekholdt S.M., Kastelein J.J. Lipid parameters for measuring risk of cardiovascular disease. Nat Rev Cardiol. 2011;8:197–206. doi: 10.1038/nrcardio.2010.223. [DOI] [PubMed] [Google Scholar]
- 4.Di Angelantonio E., Sarwar N., Perry P., Kaptoge S., Ray K.K., Thompson A., Wood A.M., Lewington S., Sattar N., Packard C.J., Emerging Risk Factors Collaboration Major lipids, apolipoproteins, and risk of vascular disease. JAMA. 2009;302:1993–2000. doi: 10.1001/jama.2009.1619. [DOI] [PMC free article] [PubMed] [Google Scholar]
- 5.Weiss L.A., Pan L., Abney M., Ober C. The sex-specific genetic architecture of quantitative traits in humans. Nat. Genet. 2006;38:218–222. doi: 10.1038/ng1726. [DOI] [PubMed] [Google Scholar]
- 6.Teslovich T.M., Musunuru K., Smith A.V., Edmondson A.C., Stylianou I.M., Koseki M., Pirruccello J.P., Ripatti S., Chasman D.I., Willer C.J. Biological, clinical and population relevance of 95 loci for blood lipids. Nature. 2010;466:707–713. doi: 10.1038/nature09270. [DOI] [PMC free article] [PubMed] [Google Scholar]
- 7.Manolio T.A., Collins F.S., Cox N.J., Goldstein D.B., Hindorff L.A., Hunter D.J., McCarthy M.I., Ramos E.M., Cardon L.R., Chakravarti A. Finding the missing heritability of complex diseases. Nature. 2009;461:747–753. doi: 10.1038/nature08494. [DOI] [PMC free article] [PubMed] [Google Scholar]
- 8.Keating B.J., Tischfield S., Murray S.S., Bhangale T., Price T.S., Glessner J.T., Galver L., Barrett J.C., Grant S.F., Farlow D.N. Concept, design and implementation of a cardiovascular gene-centric 50 k SNP array for large-scale genomic association studies. PLoS ONE. 2008;3:e3583. doi: 10.1371/journal.pone.0003583. [DOI] [PMC free article] [PubMed] [Google Scholar]
- 9.IBC 50K CAD Consortium Large-scale gene-centric analysis identifies novel variants for coronary artery disease. PLoS Genet. 2011;7:e1002260. doi: 10.1371/journal.pgen.1002260. [DOI] [PMC free article] [PubMed] [Google Scholar]
- 10.Clarke R., Peden J.F., Hopewell J.C., Kyriakou T., Goel A., Heath S.C., Parish S., Barlera S., Franzosi M.G., Rust S., PROCARDIS Consortium Genetic variants associated with Lp(a) lipoprotein level and coronary disease. N. Engl. J. Med. 2009;361:2518–2528. doi: 10.1056/NEJMoa0902604. [DOI] [PubMed] [Google Scholar]
- 11.Lanktree M.B., Anand S.S., Yusuf S., Hegele R.A., SHARE Investigators Replication of genetic associations with plasma lipoprotein traits in a multiethnic sample. J. Lipid Res. 2009;50:1487–1496. doi: 10.1194/jlr.P900008-JLR200. [DOI] [PMC free article] [PubMed] [Google Scholar]
- 12.Talmud P.J., Drenos F., Shah S., Shah T., Palmen J., Verzilli C., Gaunt T.R., Pallas J., Lovering R., Li K., ASCOT investigators. NORDIL investigators. BRIGHT Consortium Gene-centric association signals for lipids and apolipoproteins identified via the HumanCVD BeadChip. Am. J. Hum. Genet. 2009;85:628–642. doi: 10.1016/j.ajhg.2009.10.014. [DOI] [PMC free article] [PubMed] [Google Scholar]
- 13.Fox E.R., Young J.H., Li Y., Dreisbach A.W., Keating B.J., Musani S.K., Liu K., Morrison A.C., Ganesh S., Kutlar A., International Consortium for Blood Pressure Genome-wide Association Studies (ICBP-GWAS) Association of genetic variation with systolic and diastolic blood pressure among African Americans: The Candidate Gene Association Resource study. Hum. Mol. Genet. 2011;20:2273–2284. doi: 10.1093/hmg/ddr092. [DOI] [PMC free article] [PubMed] [Google Scholar]
- 14.Johnson T., Gaunt T.R., Newhouse S.J., Padmanabhan S., Tomaszewski M., Kumari M., Morris R.W., Tzoulaki I., O’Brien E.T., Poulter N.R., Cardiogenics Consortium. Global BPgen Consortium Blood pressure loci identified with a gene-centric array. Am. J. Hum. Genet. 2011;89:688–700. doi: 10.1016/j.ajhg.2011.10.013. [DOI] [PMC free article] [PubMed] [Google Scholar]
- 15.Cappola T.P., Li M., He J., Ky B., Gilmore J., Qu L., Keating B., Reilly M., Kim C.E., Glessner J. Common variants in HSPB7 and FRMD4B associated with advanced heart failure. Circ Cardiovasc Genet. 2010;3:147–154. doi: 10.1161/CIRCGENETICS.109.898395. [DOI] [PMC free article] [PubMed] [Google Scholar]
- 16.Saxena R., Elbers C.C., Guo Y., Peter I., Gaunt T.R., Mega J.L., Lanktree M.B., Tare A., Castillo B.A., Li Y.R., Look AHEAD Research Group. DIAGRAM consortium Large-scale gene-centric meta-analysis across 39 studies identifies type 2 diabetes loci. Am. J. Hum. Genet. 2012;90:410–425. doi: 10.1016/j.ajhg.2011.12.022. [DOI] [PMC free article] [PubMed] [Google Scholar]
- 17.Walford G.A., Green T., Neale B., Isakova T., Rotter J.I., Grant S.F., Fox C.S., Pankow J.S., Wilson J.G., Meigs J.B. Common genetic variants differentially influence the transition from clinically defined states of fasting glucose metabolism. Diabetologia. 2012;55:331–339. doi: 10.1007/s00125-011-2353-8. [DOI] [PMC free article] [PubMed] [Google Scholar]
- 18.Lanktree M.B., Guo Y., Murtaza M., Glessner J.T., Bailey S.D., Onland-Moret N.C., Lettre G., Ongen H., Rajagopalan R., Johnson T., Hugh Watkins on behalf of PROCARDIS. Meena Kumari on behalf of the Whitehall II Study and the WHII 50K Group Meta-analysis of Dense Genecentric Association Studies Reveals Common and Uncommon Variants Associated with Height. Am. J. Hum. Genet. 2011;88:6–18. doi: 10.1016/j.ajhg.2010.11.007. [DOI] [PMC free article] [PubMed] [Google Scholar]
- 19.de Ferranti S.D. Childhood cholesterol disorders: The iceberg base or nondisease? Med. Clin. North Am. 2012;96:141–154. doi: 10.1016/j.mcna.2012.01.011. [DOI] [PubMed] [Google Scholar]
- 20.Kaess B.M., Tomaszewski M., Braund P.S., Stark K., Rafelt S., Fischer M., Hardwick R., Nelson C.P., Debiec R., Huber F. Large-scale candidate gene analysis of HDL particle features. PLoS ONE. 2011;6:e14529. doi: 10.1371/journal.pone.0014529. [DOI] [PMC free article] [PubMed] [Google Scholar]
- 21.Friedewald W.T., Levy R.I., Fredrickson D.S. Estimation of the concentration of low-density lipoprotein cholesterol in plasma, without use of the preparative ultracentrifuge. Clin. Chem. 1972;18:499–502. [PubMed] [Google Scholar]
- 22.Marmot M., Brunner E. Cohort Profile: The Whitehall II study. Int. J. Epidemiol. 2005;34:251–256. doi: 10.1093/ije/dyh372. [DOI] [PubMed] [Google Scholar]
- 23.Law M.R., Wald N.J., Rudnicka A.R. Quantifying effect of statins on low density lipoprotein cholesterol, ischaemic heart disease, and stroke: Systematic review and meta-analysis. BMJ. 2003;326:1423. doi: 10.1136/bmj.326.7404.1423. [DOI] [PMC free article] [PubMed] [Google Scholar]
- 24.Purcell S., Neale B., Todd-Brown K., Thomas L., Ferreira M.A., Bender D., Maller J., Sklar P., de Bakker P.I., Daly M.J., Sham P.C. PLINK: A tool set for whole-genome association and population-based linkage analyses. Am. J. Hum. Genet. 2007;81:559–575. doi: 10.1086/519795. [DOI] [PMC free article] [PubMed] [Google Scholar]
- 25.Price A.L., Patterson N.J., Plenge R.M., Weinblatt M.E., Shadick N.A., Reich D. Principal components analysis corrects for stratification in genome-wide association studies. Nat. Genet. 2006;38:904–909. doi: 10.1038/ng1847. [DOI] [PubMed] [Google Scholar]
- 26.Price A.L., Butler J., Patterson N., Capelli C., Pascali V.L., Scarnicci F., Ruiz-Linares A., Groop L., Saetta A.A., Korkolopoulou P. Discerning the ancestry of European Americans in genetic association studies. PLoS Genet. 2008;4:e236. doi: 10.1371/journal.pgen.0030236. [DOI] [PMC free article] [PubMed] [Google Scholar]
- 27.Lo K.S., Wilson J.G., Lange L.A., Folsom A.R., Galarneau G., Ganesh S.K., Grant S.F., Keating B.J., McCarroll S.A., Mohler E.R., 3rd Genetic association analysis highlights new loci that modulate hematological trait variation in Caucasians and African Americans. Hum. Genet. 2011;129:307–317. doi: 10.1007/s00439-010-0925-1. [DOI] [PMC free article] [PubMed] [Google Scholar]
- 28.Bacanu S.A., Devlin B., Roeder K. Association studies for quantitative traits in structured populations. Genet. Epidemiol. 2002;22:78–93. doi: 10.1002/gepi.1045. [DOI] [PubMed] [Google Scholar]
- 29.Pearson T.A., Manolio T.A. How to interpret a genome-wide association study. JAMA. 2008;299:1335–1344. doi: 10.1001/jama.299.11.1335. [DOI] [PubMed] [Google Scholar]
- 30.Willer C.J., Li Y., Abecasis G.R. METAL: Fast and efficient meta-analysis of genomewide association scans. Bioinformatics. 2010;26:2190–2191. doi: 10.1093/bioinformatics/btq340. [DOI] [PMC free article] [PubMed] [Google Scholar]
- 31.de Bakker P.I., Ferreira M.A., Jia X., Neale B.M., Raychaudhuri S., Voight B.F. Practical aspects of imputation-driven meta-analysis of genome-wide association studies. Hum. Mol. Genet. 2008;17(R2):R122–R128. doi: 10.1093/hmg/ddn288. [DOI] [PMC free article] [PubMed] [Google Scholar]
- 32.Viechtbauer W. Conducting meta-analyses in R with the metafor package. J. Stat. Softw. 2010;36 Published online August 5, 2010. [Google Scholar]
- 33.Hunter J.E., Schmidt F.L. Sage Publications; 1990. Methods of meta-analysis: Correcting error and bias in research findings. [Google Scholar]
- 34.Thompson J.R., Attia J., Minelli C. The meta-analysis of genome-wide association studies. Brief. Bioinform. 2011;12:259–269. doi: 10.1093/bib/bbr020. [DOI] [PubMed] [Google Scholar]
- 35.Higgins J.P., Thompson S.G. Quantifying heterogeneity in a meta-analysis. Stat. Med. 2002;21:1539–1558. doi: 10.1002/sim.1186. [DOI] [PubMed] [Google Scholar]
- 36.Scheet P., Stephens M. A fast and flexible statistical model for large-scale population genotype data: Applications to inferring missing genotypes and haplotypic phase. Am. J. Hum. Genet. 2006;78:629–644. doi: 10.1086/502802. [DOI] [PMC free article] [PubMed] [Google Scholar]
- 37.Hindorff L.A., Sethupathy P., Junkins H.A., Ramos E.M., Mehta J.P., Collins F.S., Manolio T.A. Potential etiologic and functional implications of genome-wide association loci for human diseases and traits. Proc. Natl. Acad. Sci. USA. 2009;106:9362–9367. doi: 10.1073/pnas.0903103106. [DOI] [PMC free article] [PubMed] [Google Scholar]
- 38.Johnson A.D., Handsaker R.E., Pulit S.L., Nizzari M.M., O’Donnell C.J., de Bakker P.I. SNAP: A web-based tool for identification and annotation of proxy SNPs using HapMap. Bioinformatics. 2008;24:2938–2939. doi: 10.1093/bioinformatics/btn564. [DOI] [PMC free article] [PubMed] [Google Scholar]
- 39.Akaike H. A new look at the statistical model identification. IEEE Trans. Automat. Contr. 1974;19:716–723. [Google Scholar]
- 40.Cortes A., Brown M.A. Promise and pitfalls of the Immunochip. Arthritis Res. Ther. 2011;13:101. doi: 10.1186/ar3204. [DOI] [PMC free article] [PubMed] [Google Scholar]
- 41.Buyske S., Wu Y., Carty C.L., Cheng I.N., Assimes T.L., Dumitrescu L., Hindorff L.A., Mitchell S., Ambite J.L., Boerwinkle E. Evaluation of the metabochip genotyping array in African Americans and implications for fine mapping of GWAS-identified loci: the PAGE study. PLoS ONE. 2012;7:e35651. doi: 10.1371/journal.pone.0035651. [DOI] [PMC free article] [PubMed] [Google Scholar]
- 42.Abecasis Group. (2012). Exome Chip Design (http://genome.sph.umich.edu/wiki/Exome_Chip_Design).
- 43.Barter P. CETP and atherosclerosis. Arterioscler. Thromb. Vasc. Biol. 2000;20:2029–2031. doi: 10.1161/01.atv.20.9.2029. [DOI] [PubMed] [Google Scholar]
- 44.Barter P.J., Brewer H.B., Jr., Chapman M.J., Hennekens C.H., Rader D.J., Tall A.R. Cholesteryl ester transfer protein: a novel target for raising HDL and inhibiting atherosclerosis. Arterioscler. Thromb. Vasc. Biol. 2003;23:160–167. doi: 10.1161/01.atv.0000054658.91146.64. [DOI] [PubMed] [Google Scholar]
- 45.Austin M.A., Hutter C.M., Zimmern R.L., Humphries S.E. Familial hypercholesterolemia and coronary heart disease: A HuGE association review. Am. J. Epidemiol. 2004;160:421–429. doi: 10.1093/aje/kwh237. [DOI] [PubMed] [Google Scholar]
- 46.Hegele R.A. Plasma lipoproteins: Genetic influences and clinical implications. Nat. Rev. Genet. 2009;10:109–121. doi: 10.1038/nrg2481. [DOI] [PubMed] [Google Scholar]
- 47.Leigh S.E., Foster A.H., Whittall R.A., Hubbart C.S., Humphries S.E. Update and analysis of the University College London low density lipoprotein receptor familial hypercholesterolemia database. Ann. Hum. Genet. 2008;72:485–498. doi: 10.1111/j.1469-1809.2008.00436.x. [DOI] [PubMed] [Google Scholar]
- 48.Holmes M.V., Harrison S., Talmud P.J., Hingorani A.D., Humphries S.E. Utility of genetic determinants of lipids and cardiovascular events in assessing risk. Nat Rev Cardiol. 2011;8:207–221. doi: 10.1038/nrcardio.2011.6. [DOI] [PubMed] [Google Scholar]
- 49.van Dijk K.W., Rensen P.C., Voshol P.J., Havekes L.M. The role and mode of action of apolipoproteins CIII and AV: Synergistic actors in triglyceride metabolism? Curr. Opin. Lipidol. 2004;15:239–246. doi: 10.1097/00041433-200406000-00002. [DOI] [PubMed] [Google Scholar]
- 50.Strömberg A., Mårtensson J. Gender differences in patients with heart failure. Eur. J. Cardiovasc. Nurs. 2003;2:7–18. doi: 10.1016/S1474-5151(03)00002-1. [DOI] [PubMed] [Google Scholar]
- 51.Anagnostopoulou K.K., Kolovou G.D., Kostakou P.M., Mihas C., Hatzigeorgiou G., Marvaki C., Degiannis D., Mikhailidis D.P., Cokkinos D.V. Sex-associated effect of CETP and LPL polymorphisms on postprandial lipids in familial hypercholesterolaemia. Lipids Health Dis. 2009;8:24. doi: 10.1186/1476-511X-8-24. [DOI] [PMC free article] [PubMed] [Google Scholar]
- 52.Matthan N.R., Jalbert S.M., Barrett P.H., Dolnikowski G.G., Schaefer E.J., Lichtenstein A.H. Gender-specific differences in the kinetics of nonfasting TRL, IDL, and LDL apolipoprotein B-100 in men and premenopausal women. Arterioscler. Thromb. Vasc. Biol. 2008;28:1838–1843. doi: 10.1161/ATVBAHA.108.163931. [DOI] [PMC free article] [PubMed] [Google Scholar]
- 53.Dieter M.Z., Maher J.M., Cheng X., Klaassen C.D. Expression and regulation of the sterol half-transporter genes ABCG5 and ABCG8 in rats. Comp. Biochem. Physiol. C Toxicol. Pharmacol. 2004;139:209–218. doi: 10.1016/j.cca.2004.11.002. [DOI] [PubMed] [Google Scholar]
- 54.Duan L.P., Wang H.H., Ohashi A., Wang D.Q. Role of intestinal sterol transporters Abcg5, Abcg8, and Npc1l1 in cholesterol absorption in mice: Gender and age effects. Am. J. Physiol. Gastrointest. Liver Physiol. 2006;290:G269–G276. doi: 10.1152/ajpgi.00172.2005. [DOI] [PubMed] [Google Scholar]
- 55.Hazard S.E., Patel S.B. Sterolins ABCG5 and ABCG8: Regulators of whole body dietary sterols. Pflugers Arch. 2007;453:745–752. doi: 10.1007/s00424-005-0040-7. [DOI] [PMC free article] [PubMed] [Google Scholar]
- 56.Kantarci O.H., Hebrink D.D., Achenbach S.J., Pittock S.J., Altintas A., Schaefer-Klein J.L., Atkinson E.J., De Andrade M., McMurray C.T., Rodriguez M., Weinshenker B.G. Association of APOE polymorphisms with disease severity in MS is limited to women. Neurology. 2004;62:811–814. doi: 10.1212/01.wnl.0000113721.83287.83. [DOI] [PubMed] [Google Scholar]
- 57.Kamboh M.I., Aston C.E., Hamman R.F. DNA sequence variation in human apolipoprotein C4 gene and its effect on plasma lipid profile. Atherosclerosis. 2000;152:193–201. doi: 10.1016/s0021-9150(99)00459-1. [DOI] [PubMed] [Google Scholar]
- 58.Illumina. (2010). Genotyping rare variants: A simulated analysis achieves high cell rates and low error rates from loci containing rare variants. http://www.illumina.com/Documents/products/technotes/technote_genotyping_rare_variants.pdf.
- 59.Soria L.F., Ludwig E.H., Clarke H.R., Vega G.L., Grundy S.M., McCarthy B.J. Association between a specific apolipoprotein B mutation and familial defective apolipoprotein B-100. Proc. Natl. Acad. Sci. USA. 1989;86:587–591. doi: 10.1073/pnas.86.2.587. [DOI] [PMC free article] [PubMed] [Google Scholar]
- 60.Tybjaerg-Hansen A., Humphries S.E. Familial defective apolipoprotein B-100: A single mutation that causes hypercholesterolemia and premature coronary artery disease. Atherosclerosis. 1992;96:91–107. doi: 10.1016/0021-9150(92)90056-m. [DOI] [PubMed] [Google Scholar]
- 61.Myant N.B. Familial defective apolipoprotein B-100: A review, including some comparisons with familial hypercholesterolaemia. Atherosclerosis. 1993;104:1–18. doi: 10.1016/0021-9150(93)90171-p. [DOI] [PubMed] [Google Scholar]
- 62.Smith A.J., Palmen J., Putt W., Talmud P.J., Humphries S.E., Drenos F. Application of statistical and functional methodologies for the investigation of genetic determinants of coronary heart disease biomarkers: Lipoprotein lipase genotype and plasma triglycerides as an exemplar. Hum. Mol. Genet. 2010;19:3936–3947. doi: 10.1093/hmg/ddq308. [DOI] [PMC free article] [PubMed] [Google Scholar]
- 63.Deo R.C., Reich D., Tandon A., Akylbekova E., Patterson N., Waliszewska A., Kathiresan S., Sarpong D., Taylor H.A., Jr., Wilson J.G. Genetic differences between the determinants of lipid profile phenotypes in African and European Americans: The Jackson Heart Study. PLoS Genet. 2009;5:e1000342. doi: 10.1371/journal.pgen.1000342. [DOI] [PMC free article] [PubMed] [Google Scholar]
- 64.Shuldiner A.R., Pollin T.I. Genomics: Variations in blood lipids. Nature. 2010;466:703–704. doi: 10.1038/466703a. [DOI] [PubMed] [Google Scholar]
- 65.Yang J., Manolio T.A., Pasquale L.R., Boerwinkle E., Caporaso N., Cunningham J.M., de Andrade M., Feenstra B., Feingold E., Hayes M.G. Genome partitioning of genetic variation for complex traits using common SNPs. Nat. Genet. 2011;43:519–525. doi: 10.1038/ng.823. [DOI] [PMC free article] [PubMed] [Google Scholar]
- 66.Yang J., Benyamin B., McEvoy B.P., Gordon S., Henders A.K., Nyholt D.R., Madden P.A., Heath A.C., Martin N.G., Montgomery G.W. Common SNPs explain a large proportion of the heritability for human height. Nat. Genet. 2010;42:565–569. doi: 10.1038/ng.608. [DOI] [PMC free article] [PubMed] [Google Scholar]
- 67.Frazer K.A., Murray S.S., Schork N.J., Topol E.J. Human genetic variation and its contribution to complex traits. Nat. Rev. Genet. 2009;10:241–251. doi: 10.1038/nrg2554. [DOI] [PubMed] [Google Scholar]
- 68.Johannes F., Porcher E., Teixeira F.K., Saliba-Colombani V., Simon M., Agier N., Bulski A., Albuisson J., Heredia F., Audigier P. Assessing the impact of transgenerational epigenetic variation on complex traits. PLoS Genet. 2009;5:e1000530. doi: 10.1371/journal.pgen.1000530. [DOI] [PMC free article] [PubMed] [Google Scholar]
- 69.Slatkin M. Epigenetic inheritance and the missing heritability problem. Genetics. 2009;182:845–850. doi: 10.1534/genetics.109.102798. [DOI] [PMC free article] [PubMed] [Google Scholar]
- 70.Lamina C., Coassin S., Illig T., Kronenberg F. Look beyond one’s own nose: Combination of information from publicly available sources reveals an association of GATA4 polymorphisms with plasma triglycerides. Atherosclerosis. 2011;219:698–703. doi: 10.1016/j.atherosclerosis.2011.08.044. [DOI] [PubMed] [Google Scholar]
- 71.Pattinson N.R., Willis K.E. Effect of phospholipase C on cholesterol solubilization in model bile. A concanavalin A-binding nucleation-promoting factor from human gallbladder bile. Gastroenterology. 1991;101:1339–1344. doi: 10.1016/0016-5085(91)90086-z. [DOI] [PubMed] [Google Scholar]
- 72.Loos R.J., Bouchard C. FTO: The first gene contributing to common forms of human obesity. Obes. Rev. 2008;9:246–250. doi: 10.1111/j.1467-789X.2008.00481.x. [DOI] [PubMed] [Google Scholar]
- 73.Lancaster J.M., Wooster R., Mangion J., Phelan C.M., Cochran C., Gumbs C., Seal S., Barfoot R., Collins N., Bignell G. BRCA2 mutations in primary breast and ovarian cancers. Nat. Genet. 1996;13:238–240. doi: 10.1038/ng0696-238. [DOI] [PubMed] [Google Scholar]
- 74.Venkitaraman A.R. Cancer susceptibility and the functions of BRCA1 and BRCA2. Cell. 2002;108:171–182. doi: 10.1016/s0092-8674(02)00615-3. [DOI] [PubMed] [Google Scholar]
- 75.Viljoen A., Wierzbicki A.S. Safety and efficacy of laropiprant and extended-release niacin combination in the management of mixed dyslipidemias and primary hypercholesterolemia. Drug Healthc Patient Saf. 2010;2:61–71. doi: 10.2147/dhps.s7302. [DOI] [PMC free article] [PubMed] [Google Scholar]
- 76.Wise A., Foord S.M., Fraser N.J., Barnes A.A., Elshourbagy N., Eilert M., Ignar D.M., Murdock P.R., Steplewski K., Green A. Molecular identification of high and low affinity receptors for nicotinic acid. J. Biol. Chem. 2003;278:9869–9874. doi: 10.1074/jbc.M210695200. [DOI] [PubMed] [Google Scholar]
Associated Data
This section collects any data citations, data availability statements, or supplementary materials included in this article.