

Abstract
Z-scores are a means of expressing the deviation of a given measurement from the size or age specific population mean. By taking account of growth or age, Z-scores are an excellent means of charting serial measurements in paediatric cardiological practice. They can be applied to echocardiographic measurements, blood pressure and patient growth, and thus may assist in clinical decision-making.
Keywords: Blood pressure, cardio Z, echocardiography, paediatric cardiology, Z-score
WHAT ARE Z-SCORES?
Measurements are an important part of clinical assessment in the practice of paediatric cardiology. At the most basic level this typically includes measurement of the child's weight, height and blood pressure at clinic visits. Echocardiographic assessment is integral to patient assessment in the majority of children and decisions with respect to surgery or catheter intervention are frequently based on echocardiographic findings. In adult practice, ultrasound measurements are often reported with respect to a single “normal range” but this approach is impossible in growing children because the normal range of measurements will be impacted by patient growth and / or patient age. Therefore, the interpretation of these measurements during childhood presents a unique challenge, in determining whether a given measurement is within the expected range. In addition, if a measurement deviates from normality it is necessary for the clinician to gauge the magnitude of such deviation.
An approach to the description of clinical and echocardiographic variables is to describe the measurement in terms of a Z-score. The Z-score describes how many standard deviations above or below a size or age-specific population mean a given measurement lies. This approach has major attractions in paediatric cardiology and is increasingly being adopted. As an example, the left ventricle will become larger in all children as they grow. However, if a patient with chronic aortic or mitral valve regurgitation is being followed through serial assessment then clearly it is an abnormal and inappropriate dilation of the left ventricle that must be excluded. The use of Z-scores facilitates the detection of pathological increases in left ventricular dimensions, over and above that expected due to normal growth, by showing an increased Z-score over time.
Z-SCORES VERSUS CENTILES
Many paediatricians and paediatric cardiologists are familiar with centiles, particularly with regard to patient height and weight. The relationship between centiles and Z-scores, for a normally distributed parameter, is shown in Figure 1; the use of either means of expression assumes a normal distribution of the data.
Figure 1.
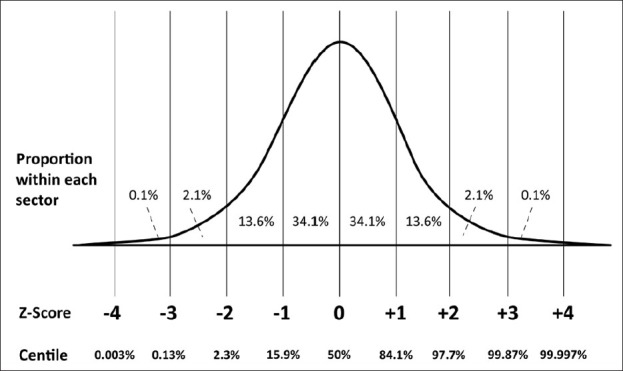
The relationship of Z-scores and centiles, assuming Normal distribution of the parameter. Note that the centile remains virtually constant at values distant from the mean (typically over 3 standard deviations from the mean), whilst the Z-score continues to be sensitive to changes in measurements
DERIVATION OF Z-SCORES
A Z-score is defined as 
where χ is the observed measurement, μ is the expected measurement (population mean) and σ is the standard deviation of the population. Thus, Z-scores above the population mean have a positive value and those below the population mean have a negative value. The Z-score value conveys the magnitude of deviation from the mean. For example, where the mean size of the aortic valve is 20mm, with a defined standard deviation of 3 mm, the Z-score of an aortic valve with annulus 14 mm is:
![]()
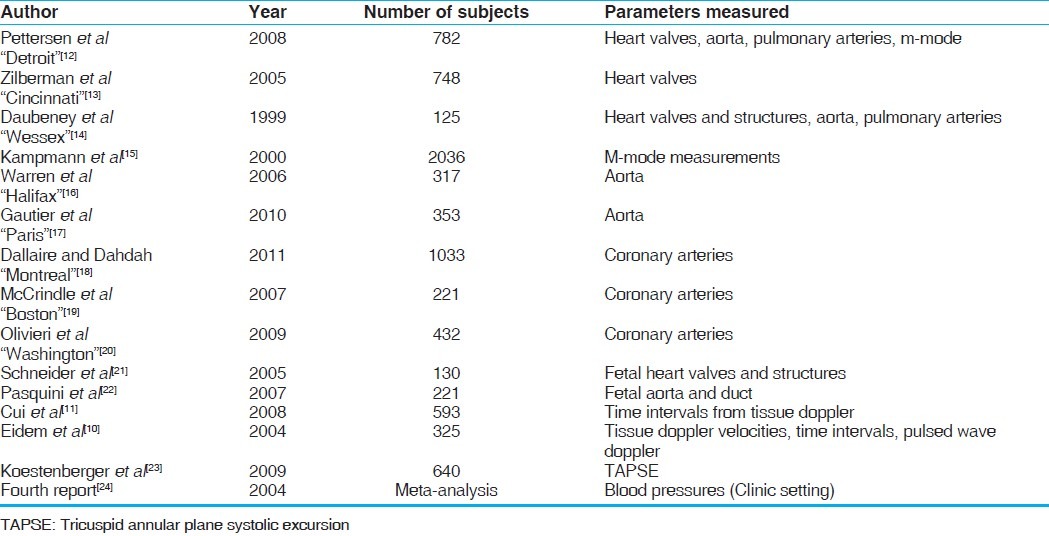
Therefore, in order to calculate a Z-score one must define the mean for each body size point, and the corresponding standard deviation. These values have been derived in many separate studies, of varying sample sizes, [Table 1] and the word ‘allometry’ has been used since 1936 to describe the “relationship between changes in shape and overall size”.[1] The determination of the ‘best-fit’ relationship relies upon finding the best mathematical fit for the data, and it has long been recognised that the correlation between size of body structure (e.g. heart valve) and surrogate marker of total body size (e.g. body surface area or weight) is rarely a simple linear one.[2–4] In other words, structures do not tend to obey the relationship y = ax + b (where y is the measured structure, x is the marker of total body size, a is the scaling coefficient and b is a constant).
Table 1.
Key references with respect to important paediatric and fetal echocardiographic data
Instead, a much better fit is generally shown by more complex polynomial equations (e.g. y=ax3+bx2+cx+d) or by a power law relationship (y=axb, where a is the scaling factor, and b the scaling exponent).
Once a best fit relationship is defined, a standard deviation and mean can be derived at each body size point. It is important to note that the standard deviation may vary with body size, a property termed ‘heteroscedasticity’.
WHICH PATIENT FACTORS SHOULD BE CONSIDERED?
The question of which patient factors should be used to reflect overall body size has been addressed in recent published guidelines.[5] For most measurements, the recommendation has been to calculate Z-scores with respect to patient body surface area rather than height or weight alone.[4] Many formulas have been used to calculate body surface area including those of Boyd, Dubois and Dubois and Haycock, and it should be noted that there is considerable discrepancy in the values derived by each formula, particularly at low body size. Recent published guidance has recommended the use of the Haycock formula,[6] but there is a strong argument that for a valid comparison the same BSA formula should be used as in the original reference study which was used to compute the Z-scores.
However, it should not be assumed that body surface area is always the favoured approach. For left ventricular mass, for example, patient height has been preferred.[7–9] Other factors, such as patient sex and race, may also be important for certain measurements. Echocardiographic measurements do not simply relate to measurement of the size of heart structures. Normal values of functional data such as blood pool Doppler and tissue Doppler data also change across the paediatric age range, and are heavily influenced by patient age[10,11] and heart rate.[11]
APPLICATION OF Z-SCORES
In order to optimise the relevance of the computed Z-score in the clinical situation, the methodology used for the measurement should match, as far as possible, that of the original investigators.
In order for body surface area to be computed, conventionally both height and weight are required, and our normal practice has been to record both whenever possible. However, from experience, weight is recorded more commonly than height, particularly in smaller babies and children. Weight only equations for the calculation of BSA, such as BSA = 0.1023 (weight0.68),[25] are convenient but risk misappropriating the Z-score data. In addition, for some echocardiographic measurements there may be variability as to whether a measurement is made in systole or diastole or whether a leading edge to leading edge versus internal dimension method has been used.
One of the most useful applications of Z-scores is in tracking allometric growth over time. The same Z-score algorithm should be used each time, and a note made of which reference data has been employed. Z-scores may vary significantly between different authors [Figure 2]. If different Z-score references are used in the erroneous belief that these are interchangeable then an apparent change in Z-score may be produced in the absence of a true variation. In practice, an institution should decide which reference data is going to be used for which measurements and this should be used consistently during patient follow-up.
Figure 2.
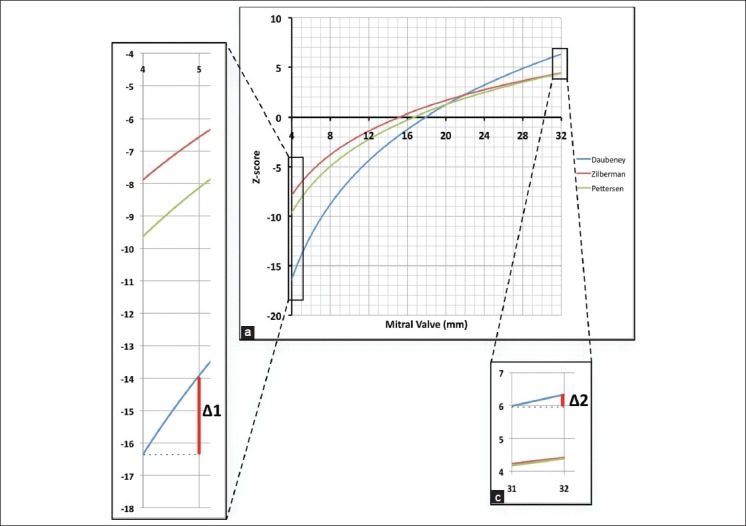
(a) demonstrates the relationship between mitral valve size in mm and the Z-score as derived by the three most commonly used algorithms. Values are calculated for a typical one year old male, weight 10kg, height 75 cm. The algorithms agree relatively closely around the mean (Z=0). (b) and (c). There is considerable discrepancy between the different algorithms, particularly at low Z-scores. Δ1 and Δ2 demonstrate the difference in magnitude of the change in Z-score, with a 1mm variation in measurement, at low and high Z-scores respectively
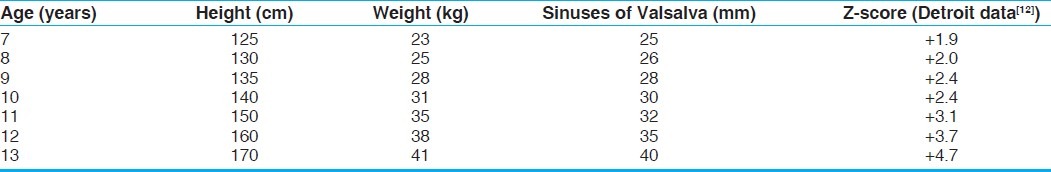
An example where z-scores can be very informative is in following progressive dilation of the aortic root in a patient with Marfan's syndrome. The diameter at the sinuses of Valsalva will increase as the child grows, but at times of rapid total body growth it can be difficult to detect disproportionate growth of a single structure. Table 2 illustrates such a clinical scenario, where a child starts to grow rapidly at the age of 10 years. The aortic root grows even faster, and the significant increase in the Z-score of the sinuses of Valsalva demonstrates this succinctly and clearly, alerting the clinician.
Table 2.
Increasing Z-score over time of the sinuses of Valsalva, suggesting pathological aortic root dilation
LIMITATIONS OF Z-SCORES
Z-scores have major advantages for the presentation of paediatric echocardiographic and physiological data. However, Z-scores remain an imperfect approximation and there are some important drawbacks which merit discussion. The first, and most important, factor to bear in mind is that the mean and standard deviation at each body size point are only estimation and may vary widely between investigators [Figure 2].
Secondly, to have statistical confidence in both the mean and the more extreme Z-scores an extremely large sample size is required, particularly in the assessment of patients across a wide range of sizes. The change in variance across body size (heteroscedasticity) means that it is important to include sufficient numbers of patients at extremes of body size. The inappropriate averaging of variance would tend to underestimate Z-scores values for the smallest children, and overestimate Z-score values for the larger subjects.
Thirdly, the use of Z-scores may amplify errors in measurements. A degree of intra- and inter-observer variability in measurements is unavoidable, but Z-scores can amplify only minimal changes in absolute measurement [Figure 2b], particularly at negative Z-scores. The exact nature of any amplification effect depends upon the algorithm used to derive the Z-score, and some do not exhibit such a phenomenon.
Finally, it is important that the user does not accept published data uncritically. If there is a wide standard deviation for example in smaller patients, then a value of zero can appear to lie within 2 standard deviations of the mean. For instance, a complete absence of movement on tissue Doppler at some positions, in the under one year age group, may yield a Z-score of >-2.[10]
HOW TO CALCULATE Z-SCORES IN PRACTICE
For the clinician, it is impractical to trawl through multiple paper reference sources in a clinic setting. It is important, though, that there is the ability to calculate Z-scores when required and there are some commercially available echocardiography archive packages that facilitate this. Though convenient, these integrated packages are often limited to a single set of reference data and have not extended to the incorporation of functional data such as blood pool or tissue Doppler. Fetal echocardiographic data is available on some archive solutions and not others.
Some institutions do not have image archiving systems installed and so web-based calculators have evolved. Probably the best known of these is at www.parameterz.com, where the user can input the relevant data for online calculation of Z-scores based on published reference data. Our own unit has recently released the “Cardio Z” App which can be installed on an iPhone/ipad platform and does not depend on an Internet connection. This permits user configuration of the preferred reference source for multiple fetal and paediatric echocardiographic measurements. The user has the option to change the body surface area formula, but the default position is to use that of the original reference. Diagrams detail the exact measurement methodology used by each paper, in order to facilitate valid comparisons with the reference data. Functional data, such as pulsed wave and tissue Doppler with derived functional indices, can also be entered. Supplementary information such as Z-scores for growth and blood pressure, and normal electrocardiographic data can also be analysed. A screenshot of the App is shown in Figure 3.
Figure 3.
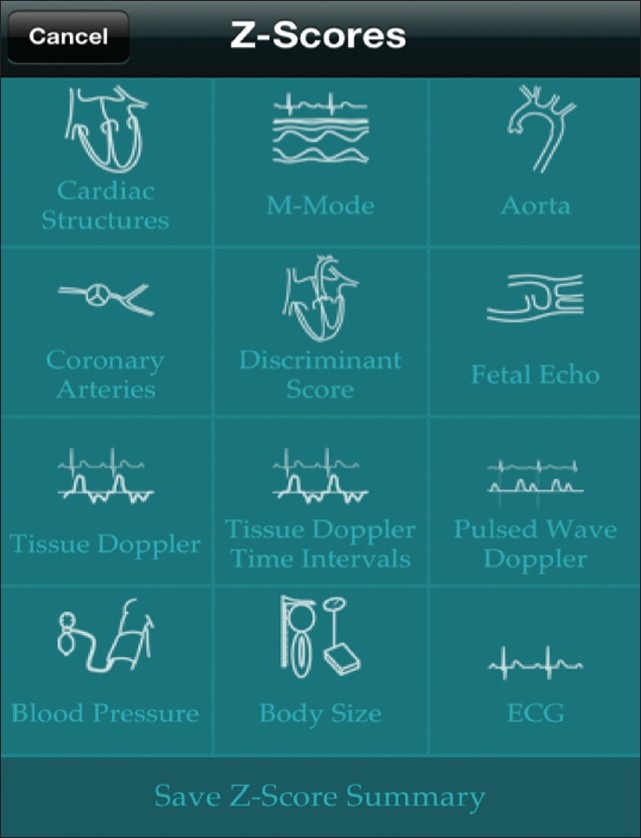
Main menu screenshot of the Cardio Z app showing the variables for which Z-scores can be calculated. The user can configure the reference data to be used and the formula to be used to calculate body surface area. The data can be stored as a “.pdf” document for emailing or storage
CONCLUSIONS
The use of Z-scores represents a helpful way of presenting patient specific information in paediatric cardiology. Users need to have an awareness of how such scores are calculated and their limitations. Purpose-designed software is making access to Z-score information far easier than it was possible in the past.
DECLARATIONS
HC and JMS are the joint authors of Cardio Z, an App developed for iPhone and available for purchase. Profits from the App are used to maintain future development and are donated to the Evelina Children's Hospital Appeal.
Footnotes
Source of Support: Nil
Conflict of Interest: HC and JMS are the joint authors of Cardio Z, an App developed for iPhone and available for purchase. Profits from the App are used to maintain future development and are donated to the Evelina Children's Hospital Appeal.
REFERENCES
- 1.Huxley JS, Teissier G. Terminology of Relative Growth. Nature. 1936;137:780–1. [Google Scholar]
- 2.McMahon T. Size and shape in biology. Science. 1973;179:1201–4. doi: 10.1126/science.179.4079.1201. [DOI] [PubMed] [Google Scholar]
- 3.Neilan TG, Pradhan AD, King ME, Weyman AE. Derivation of a size-independent variable for scaling of cardiac dimensions in a normal pediatric population. Eur J Echocardiogr. 2009;10:50–5. doi: 10.1093/ejechocard/jen110. [DOI] [PMC free article] [PubMed] [Google Scholar]
- 4.Sluysmans T, Colan SD. Theoretical and empirical derivation of cardiovascular allometric relationships in children. J Appl Physiol. 2005;99:445–57. doi: 10.1152/japplphysiol.01144.2004. [DOI] [PubMed] [Google Scholar]
- 5.Lopez L, Colan SD, Frommelt PC, Ensing GJ, Kendall K, Younoszai AK, et al. Recommendations for quantification methods during the performance of a pediatric echocardiogram: A report from the Pediatric Measurements Writing Group of the American Society of Echocardiography Pediatric and Congenital Heart Disease Council. J Am Soc Echocardiogr. 2010;23:465–95. doi: 10.1016/j.echo.2010.03.019. quiz 576-7. [DOI] [PubMed] [Google Scholar]
- 6.Haycock GB, Schwartz GJ, Wisotsky DH. Geometric method for measuring body surface area: A height-weight formula validated in infants, children, and adults. J Pediatr. 1978;93:62–6. doi: 10.1016/s0022-3476(78)80601-5. [DOI] [PubMed] [Google Scholar]
- 7.de Simone G, Daniels SR, Devereux RB, Meyer RA, Roman MJ, de Divitiis O, et al. Left ventricular mass and body size in normotensive children and adults: Assessment of allometric relations and impact of overweight. J Am Coll Cardiol. 1992;20:1251–60. doi: 10.1016/0735-1097(92)90385-z. [DOI] [PubMed] [Google Scholar]
- 8.Khoury PR, Mitsnefes M, Daniels SR, Kimball TR. Age-specific reference intervals for indexed left ventricular mass in children. J Am Soc Echocardiogr. 2009;22:709–14. doi: 10.1016/j.echo.2009.03.003. [DOI] [PubMed] [Google Scholar]
- 9.Foster BJ, Mackie AS, Mitsnefes M, Ali H, Mamber S, Colan SD. A novel method of expressing left ventricular mass relative to body size in children. Circulation. 2008;117:2769–75. doi: 10.1161/CIRCULATIONAHA.107.741157. [DOI] [PubMed] [Google Scholar]
- 10.Eidem BW, McMahon CJ, Cohen RR, Wu J, Finkelshteyn I, Kovalchin JP, et al. Impact of cardiac growth on Doppler tissue imaging velocities: A study in healthy children. J Am Soc Echocardiogr. 2004;17:212–21. doi: 10.1016/j.echo.2003.12.005. [DOI] [PubMed] [Google Scholar]
- 11.Cui W, Roberson DA, Chen Z, Madronero LF, Cuneo BF. Systolic and diastolic time intervals measured from Doppler tissue imaging: Normal values and Z-score tables, and effects of age, heart rate, and body surface area. J Am Soc Echocardiogr. 2008;21:361–70. doi: 10.1016/j.echo.2007.05.034. [DOI] [PubMed] [Google Scholar]
- 12.Pettersen MD, Du W, Skeens ME, Humes RA. Regression equations for calculation of z scores of cardiac structures in a large cohort of healthy infants, children, and adolescents: An echocardiographic study. J Am Soc Echocardiogr. 2008;21:922–34. doi: 10.1016/j.echo.2008.02.006. [DOI] [PubMed] [Google Scholar]
- 13.Zilberman MV, Khoury PR, Kimball RT. Two-dimensional echocardiographic valve measurements in healthy children: Gender-specific differences. Pediatr Cardiol. 2005;26:356–60. doi: 10.1007/s00246-004-0736-z. [DOI] [PubMed] [Google Scholar]
- 14.Daubeney PE, Blackstone EH, Weintraub RG, Slavik Z, Scanlon J, Webber SA. Relationship of the dimension of cardiac structures to body size: an echocardiographic study in normal infants and children. Cardiol Young. 1999;9:402–10. doi: 10.1017/s1047951100005217. [DOI] [PubMed] [Google Scholar]
- 15.Kampmann C, Wiethoff CM, Wenzel A, Stolz G, Betancor M, Wippermann CF, et al. Normal values of M mode echocardiographic measurements of more than 2000 healthy infants and children in central Europe. Heart. 2000;83:667–72. doi: 10.1136/heart.83.6.667. [DOI] [PMC free article] [PubMed] [Google Scholar]
- 16.Warren AE, Boyd ML, O’Connell C, Dodds L. Dilatation of the ascending aorta in paediatric patients with bicuspid aortic valve: Frequency, rate of progression and risk factors. Heart. 2006;92:1496–500. doi: 10.1136/hrt.2005.081539. [DOI] [PMC free article] [PubMed] [Google Scholar]
- 17.Gautier M, Detaint D, Fermanian C, Aegerter P, Delorme G, Arnoult F, et al. Nomograms for aortic root diameters in children using two-dimensional echocardiography. Am J Cardiol. 2010;105:888–94. doi: 10.1016/j.amjcard.2009.11.040. [DOI] [PubMed] [Google Scholar]
- 18.Dallaire F, Dahdah N. New Equations and a Critical Appraisal of Coronary Artery Z Scores in Healthy Children. J Am Soc Echocardiogr. 2011;24:60–74. doi: 10.1016/j.echo.2010.10.004. [DOI] [PubMed] [Google Scholar]
- 19.McCrindle BW, Li JS, Minich LLA, Colan SD, Atz AM, Takahashi M, et al. Coronary artery involvement in children with Kawasaki disease: risk factors from analysis of serial normalized measurements. Circulation. 2007;116:174–9. doi: 10.1161/CIRCULATIONAHA.107.690875. [DOI] [PubMed] [Google Scholar]
- 20.Olivieri L, Arling B, Friberg M, Sable C. Coronary artery Z score regression equations and calculators derived from a large heterogeneous population of children undergoing echocardiography. J Am Soc Echocardiogr. 2009;22:159–64. doi: 10.1016/j.echo.2008.11.003. [DOI] [PubMed] [Google Scholar]
- 21.Schneider C, McCrindle B, Carvalho JS, Hornberger LK, McCarthy KP, Daubeney PE. Development of Z-scores for fetal cardiac dimensions from echocardiography. Ultrasound Obstet Gynecol. 2005;26:599–605. doi: 10.1002/uog.2597. [DOI] [PubMed] [Google Scholar]
- 22.Pasquini L, Mellander M, Seale A, Matsui H, Roughton M, Ho SY, et al. Z-scores of the fetal aortic isthmus and duct: An aid to assessing arch hypoplasia. Ultrasound Obstet Gynecol. 2007;29:628–33. doi: 10.1002/uog.4021. [DOI] [PubMed] [Google Scholar]
- 23.Koestenberger M, Ravekes W, Everett AD, Stueger HP, Heinzl B, Gamillscheg A, et al. Right ventricular function in infants, children and adolescents: Reference values of the tricuspid annular plane systolic excursion (TAPSE) in 640 healthy patients and calculation of z score values. J Am Soc Echocardiogr. 2009;22:715–9. doi: 10.1016/j.echo.2009.03.026. [DOI] [PubMed] [Google Scholar]
- 24.National High Blood Pressure Education Program Working Group on High Blood Pressure in Children and Adolescents. The fourth report on the diagnosis, evaluation, and treatment of high blood pressure in children and adolescents. Pediatrics. 2004;114(2 Suppl 4th Report):555–76. [PubMed] [Google Scholar]
- 25.Bailey BJ, Briars GL. Estimating the surface area of the human body. Stat Med. 1996;15:1325–32. doi: 10.1002/(SICI)1097-0258(19960715)15:13<1325::AID-SIM233>3.0.CO;2-K. [DOI] [PubMed] [Google Scholar]