Abstract
Quantitative assessment of target volume contouring in radiotherapy treatment planning is an important aspect of quality assessment and educational exercises. The Conformity Index (CI) is a volume-based statistic frequently used for this purpose. Although the CI is relatively simple to understand and can be calculated using most treatment planning systems, it does not provide any information on the differences in shape between the two volumes. We present a new morphometric (shape-based) statistic known as the “mean distance to conformity” (MDC). For a specific volume that is being evaluated against a reference volume, the MDC represents the average distance that all outlying points in the volume must be moved in order to achieve perfect conformity with the reference volume. The MDC comprises a component related to under-contouring (where the evaluation volume is smaller than the reference volume) and a component related to over-contouring (where the evaluation extends beyond the reference volume). Furthermore, voxel-by-voxel information on conformity errors can also be displayed using a volume–error histogram. Calculation of MDC statistics is achieved using a three-dimensional grid search algorithm. By using a range of scenarios comprising both theoretical and actual clinical volumes, we demonstrate the increased utility of the MDC for the detection of contouring errors.
The precise delivery of tumouricidal doses to target volumes, while limiting the dose to adjacent normal tissue structures, is a central tenet of successful radiotherapy. Quantification of the geometric uncertainties associated with radiotherapy treatment planning, namely the extent of spread of subclinical disease, expected variations in shape, and inaccuracies or variations in treatment set-up, has become an important focus of study [1]. In contrast, the uncertainties resulting from inter- and intra-observer variations in target volume delineation have tended to avoid such close scrutiny.
One of the major obstacles to assessing variations in target volume delineation has been the lack of appropriate tools. The Conformity Index (CI) is a method that has been used for outline evaluation [2–6]. Originally developed for the evaluation of dose distributions for stereotactic radiosurgery, the CI refers to the ratio of the volume of overlap between outlines to the volume encompassing the full extent of both outlines (Figure 1). Two perfectly concordant volumes will have a CI of 1, and two volumes that fail to overlap have a CI of 0. Although the CI is relatively simple to understand and can be calculated using most treatment planning systems, it does not provide any information on the differences in shape between the two volumes.
Figure 1.
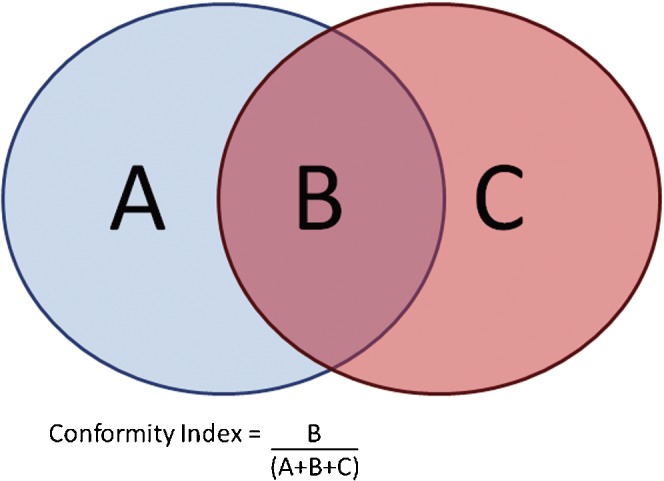
Illustration of the Conformity Index in two dimensions. The Conformity Index is defined as the area of overlap between two outlines, divided by the area that encompasses both outlines. In three dimensions, the volume of overlap is divided by the encompassing volume.
A number of morphometric (shape-based) techniques for outline assessment have been described in the literature; these techniques rely on identifying the distance between corresponding points on two volumes. Some authors have used deformable image registration techniques to produce deformation maps that quantify the change in shape between two outlines [7]. Alternative line-based morphometric techniques involve projecting a line from some arbitrary centre to the surface of each contour, and making a measurement along this line [8–11]. These techniques generally work well for near-spherical shapes but can fail to function correctly for complex outlines with concave elements. Subtle refinements of the line-based morphometric methods use surface normal projections from each point [12, 13], or the establishment of the closest point on corresponding outlines [14], for their line-based measurements. These techniques may still fail to function for highly irregular volumes and intersecting volumes. Moreover, the scoring statistics generated using these techniques are often difficult to interpret and do not allow for comparison between studies or evaluation of the clinical significance of the discrepancies.
In this paper, we present a novel morphometric scoring tool that has been developed for automated outline assessment. Our aim was to develop a tool with the following features:
A single scoring statistic that is representative of the overall conformity of the two volumes being assessed.
Additional statistics that provide information on whether the non-conformity is caused by over- or under-contouring.
A method of display that would facilitate evaluation of the clinical significance of the discrepancies.
Using both theoretical and real planning cases, we compare our tool with the CI to assess its additional benefit.
Methods
A scoring tool was written that is capable of importing contour volumes from any Digital Imaging and Communication in Medicine (DICOM) radiotherapy-compatible treatment planning system. A three-dimensional (3D) grid representation was established for processing of the contour data. Each node in the grid could adopt one of four states:
State 0: The node lies outside both reference and evaluation volumes.
State 1: The node lies within the reference volume but not the evaluation volume.
State 2: The node lies within the evaluation volume but not the reference volume.
State 3: The node lies within both volumes.
A new statistic was developed to describe the shape difference between the two volumes encoded in the grid, namely the “mean distance to conformity” (MDC). This is defined as the mean distance of each outlying voxel from the reference contour. Thus for two complex volumes, the MDC can be thought of as the average distance that the outlying points in the evaluation volume would have to be moved in three dimensions to achieve perfect conformity with the reference volume. The dimensions of MDC are given in millimetres.
The calculation algorithm is explained below and in Figure 2.
Figure 2.
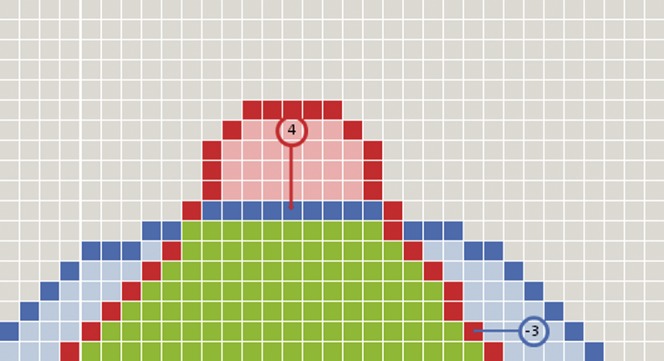
Diagram representation of the cellular automaton network. A series of nodes from a single axis of the network is shown. Two outlines have been entered into the node. The blue contour is the reference contour and the red contour the evaluation contour. The green voxels have been determined to lie within both outlines. The light blue voxels are within the reference outline but not within the evaluation outline and represent under-contouring errors. The light red voxels are within the evaluation outline but not the reference outline and represent over-contouring errors. For two of the nodes indicated by the red and blue circles, the distance to the nearest contour has been displayed. Note that over-contouring errors are given positive values and under-contouring errors are given negative values.
Reference and evaluation volumes are imported from the treatment planning system.
The volumes are represented in a 512 × 512 × 512 grid, where each node in the grid represents a 1 mm3 volume in the planning dataset.
Each node inspects the grid to determine if it lies within the reference volume or the evaluation volume, or both.
If a node lies within only one of the volumes, it performs a grid search through adjacent nodes in three dimensions until it finds the edge of the other volume. The conformity error for the node under evaluation is calculated as the vector distance between the start node and the end node in three dimensions, and is stored as a parameter within the node.
The grid search calculation maintains the sign of the conformity error for each node. In this way, it is able to distinguish between an over-contouring error (where the evaluation outline extends beyond the reference outline) and an under-contouring error (where the evaluation outline falls within the reference outline).
The conformity errors are summed across the entire network to calculate the MDC. The MDC score comprises two components: one due to errors of over-contouring and the other from errors of under-contouring.
Finally, the conformity errors in all the nodes of the grid are binned to create an error–volume histogram. The frequency at which each level of conformity error is observed is plotted as a percentage of the encompassing volume.
The algorithm was implemented using a 32-bit Pascal Compiler (Codegear Delphi 2009; Embarcadero Technologies, San Francisco, CA) with an 8-core 2.5 GHz Intel Xeon workstation (Broadberry Data Systems, Wilmington, DE). By implementing a multi-threaded optimisation, a typical pair of outlines can be scored in 3 min. On a typical 3 GHz single processor workstation used by commercial treatment planning systems, calculation time is approximately 10 min.
Evaluation of the scoring tool was carried out by comparing theoretical contour volumes, as well as real volumes obtained at a national radiotherapy training course (“Fundamentals of Radiotherapy Planning”, Cambridge 2008) with permission of the course delegates. For each analysis, the following data were generated:
The CI value.
The MDC value.
The under-contour and over-contour errors.
The error–volume histogram.
Illustrative scenarios were chosen to demonstrate the utility of the tool.
Results
Comparison of CI and MDC statistics
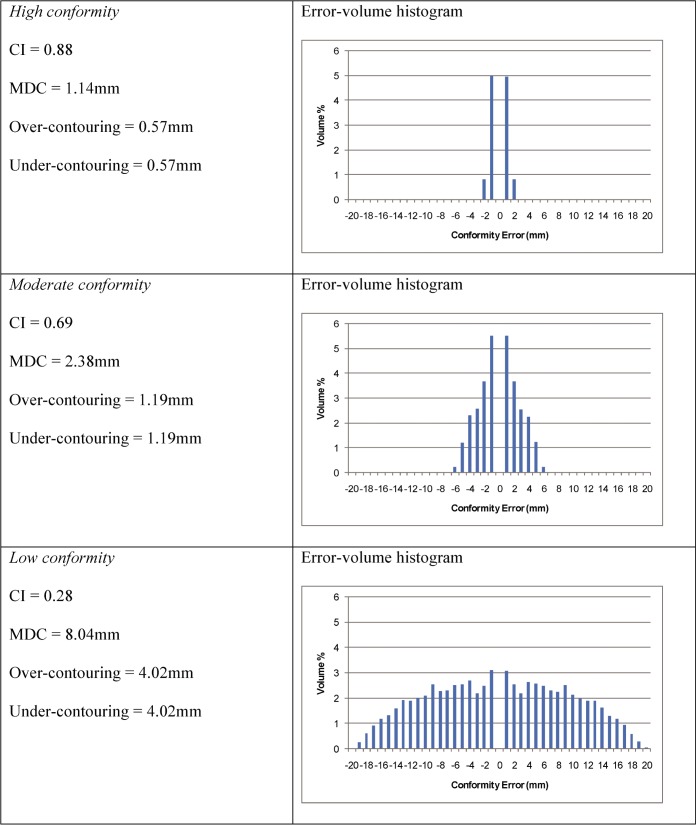
For this analysis, two identical spheres with a 25 mm diameter were created in the treatment planning system. The spheres were placed at increasing separation between their centres to represent three examples of conformity (high, moderate and low; Figure 3). As the spheres are separated, the CI values fall, the MDC values rise and the error–volume histograms show a broader range of conformity errors. As identical spheres were used for the two outlines, the under- and over-contour contributions to the MDC are identical (Figure 4).
Figure 3.
Two spheres with a 25 mm diameter are constructed in the treatment planning system, with increasing distance between their centres. The conformity index values for these three pairs of volumes are 0.88, 0.69 and 0.28, respectively.
Figure 4.
Results of Conformity Index (CI) and mean distance to conformity (MDC) evaluation for two spheres with increasing distance between centres.
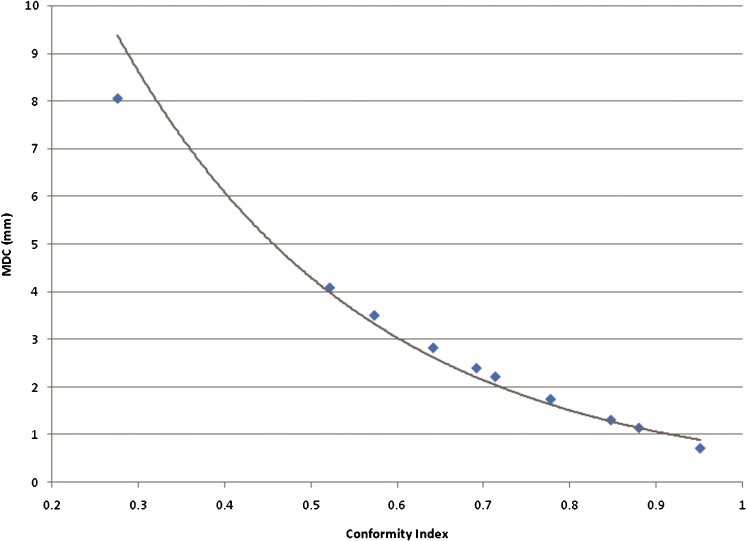
This exercise was extended to determine what level of MDC might be considered as a threshold for an acceptable conformity between volumes. A wider range of separations between the two spheres was used to produce a graph correlating the change in MDC with the CI (Figure 5). Our own measurements of inter- and intra-observer variation for glioblastoma using CT and MRI show that a CI value of 0.8 is an acceptable threshold for variation between expert observers [15]. The equivalent acceptable MDC would be approximately 1.6 mm. The graph shows that, as the CI value falls, there is a progressively steeper rise in the MDC value, suggesting that the MDC is a more sensitive indicator of the magnitude of error in conformity than the CI.
Figure 5.
Graph showing the variation of mean distance to conformity (MDC) with change in Conformity Index (CI) for two spherical volumes. The trendline shows a near exponential relationship between MDC and CI. Assuming a threshold CI of 0.85 as an acceptable standard, this equates to a threshold MDC of 1.6 mm.
Identification of a focal discrepancy between two contours
In this scenario, the evaluation volume is almost identical to the reference volume, but there is a significant focal variation in the contour on a single slice. This error might occur if the evaluation contour is incorrectly expanded to take in an apparently abnormal appearance in the planning image, such as a blood vessel (Figure 6). Analysis of the evaluation volume with the reference volume gives the following statistics: CI _ 0.98, MDC _ 0.09 mm, over-contour _ 1.49 mm and under-contour _ 0.60 mm.
Figure 6.
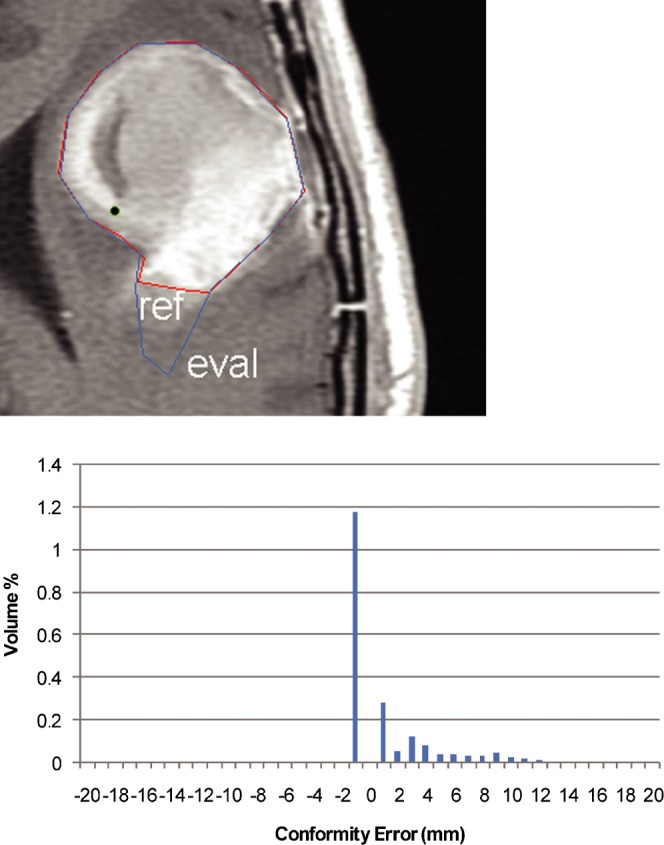
Illustration of the effect of a focal discrepancy between two otherwise near identical outlines. A representative axial image is shown from the treatment planning system. The error–volume histogram shows a small volume that extends up to 9–10 mm outside the reference volume.
The results indicate that the volume-based CI statistic was unable to identify the small area of discrepancy between the two volumes. However, the MDC score is higher than would be expected (CI of ≅0.8; MDC of 1.6 mm), again suggesting that the MDC is a more sensitive measure of non-conformity than the CI. Inspection of the error–volume histogram shows that the non-conformity is attributable to a small proportion of the evaluation volume, which is significantly different (up to 9–10 mm) outside the reference volume.
Analysis of clinical cases
Delegates at the training course were provided with a T1 weighted MRI scan that was registered to the planning CT scan. The contouring instructions stated that the gross tumour volume (GTV) should include all contrast-enhancing tissue on the MRI scan. Three sample volumes were analysed using the scoring tool and were compared to a reference volume prepared by an experienced neuro-oncologist. The scoring statistics for the volumes are given below.
Delegate 1
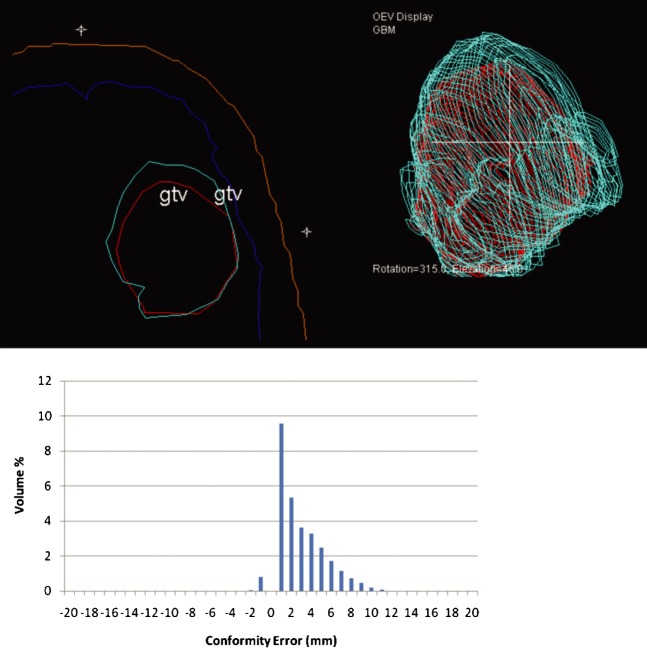
Values for Delegate 1 were: CI _ 0.71, MDC _ 2.99 mm, over-contour _ 2.96 mm and under-contour _ 0.02 mm.
In this example (Figure 7), the CI value indicates moderate conformity with the reference volume. However, the components of the MDC value suggest that the delegate is tending to systematically contour 3 mm larger than the reference volume. This is confirmed by the characteristic “right shift” shape of the error–volume histogram. The axial section and 3D display from the treatment planning system confirm the tendency for this delegate to over-contour. On further discussion with the delegate, it became clear that the instruction for outlining the GTV had been misunderstood. The delegate had included peri-tumoural oedema in the GTV in addition to the contrast-enhancing area of the tumour cavity, and hence the evaluation volume is consistently larger than the reference volume.
Figure 7.
Representative slice and error–volume histogram from Delegate 1. A systematic over-contouring error can be visualised in the treatment planning system (reference outline is red; delegate outline is cyan). The “right shift” appearance of the error–volume histogram confirms this finding. gtv, gross tumour volume.
Delegate 2
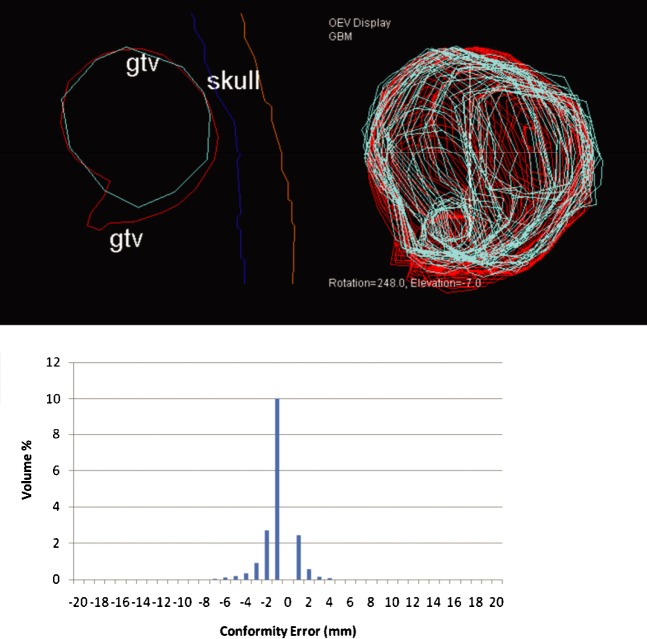
Values for Delegate 2 were: CI _ 0.82, MDC _ 1.48 mm, over-contour _ 0.24 mm and under-contour _ 1.23 mm.
In this example (Figure 8), the CI value indicates good conformity with the reference volume. However, the MDC score components suggest a tendency for the delegate to under-contour. On inspection of the error–volume histogram, it is evident that the error is largely due to an area of under-contouring of 5 mm. This can be seen in the axial section and 3D display from the treatment planning system.
Figure 8.
Representative slice and error–volume histogram from Delegate 2. This delegate tends to under-contour, as shown in the treatment planning system (reference outline is red; delegate outline is cyan). This is confirmed by the left shift of the error–volume histogram. gtv, gross tumour volume.
Delegate 3
Values for Delegate 3 were CI _ 0.89, MDC _ 1.27 mm, over-contour _ 0.50 mm and under-contour _ 0.80 mm.
In this example (Figure 9), the CI value indicates a high degree of conformity with the reference volume and this is borne out by the low MDC score. The subcomponents of the MDC score show a balance of under- and over-contouring errors, all of which are small. The axial section and 3D display from the treatment planning system shows the high degree of conformity between the reference and evaluation volumes.
Figure 9.
Representative slice and error–volume histogram from Delegate 3. This delegate demonstrates close conformity with the reference volume, as shown in the display from the treatment planning system (reference outline is red; delegate outline is cyan). The error–volume histogram shows a balance of under-contouring and over-contouring errors of small magnitude. gtv, gross tumour volume.
Discussion
Quantitative assessment of target volume contouring in radiotherapy treatment planning is an important aspect of quality assessment and educational exercises. However, providing such feedback is a time-consuming exercise, and automated methods that produce a single scoring statistic are desirable to accelerate the process. The CI has been used for the comparison of treatment outlines where there is significant interobserver variability [3, 4]. However, the CI fails to provide information on the differences in shape between the two volumes, which may be significant clinically.
We present a new morphometric scoring tool for volume assessment based on a new statistic known as the MDC. The MDC is easily understood as the average distance that outlying points within the evaluation volume need to be moved in order to achieve perfect conformity with the reference volume. The scenarios presented in this manuscript demonstrate that the MDC is similar to the CI in terms of its ability to assess differences between pairs of contours. However, analysis of the components of the MDC provides additional information on the extent of under-contouring and over-contouring for a specific contour. The impact on local tumour control of geographical miss owing to under-contouring during radiotherapy treatment planning is generally accepted. The impact of over-contouring on the risk of toxicity is less well established. Both over- and under-contouring tend to be caused by a large degree of uncertainty over the apparent edge of the target, which may be improved by providing additional imaging with higher soft-tissue contrast or by training in cross-sectional imaging.
The histogram display of the conformity errors obtained from voxel-by-voxel calculation of our scoring tool can also offer useful information relating to small but significant discrepancies between contours. As the algorithm operates in three dimensions, it is able to handle volume shifts occurring in the cranio-caudal axis, as well as those in the axial plane. The algorithm is also able to handle complex bifurcating volumes. In addition, the tool has been designed to accept contours created by any DICOM radiotherapy-compatible treatment planning system, which increases its utility as a quality assessment and educational tool.
The weakness of the tool is mainly related to its computational load. Calculation times for the scoring of large volumes on a standard single processor workstation with limited memory will be significantly increased. In addition, the 1 mm resolution accuracy may be insufficient for contour assessment in high-precision radiotherapy treatment such as stereotactic radiosurgery. Planned developments for the tool include support for the overlay of DICOM image data, a user-definable voxel grid size and a batch-processing mode, which could evaluate multiple outlines without user intervention and save scoring statistics to disc.
Conclusions
The MDC, a shape-based statistic for the evaluation of radiotherapy treatment planning contours, provides additional information over the CI as an assessment statistic. It has potential value for the quality assessment of radiotherapy treatment planning and as an educational tool. Further studies are planned to assess its utility in a range of clinical situations.
Acknowledgments
The authors would like to thank the delegates at the 2008 Fundamentals of Radiotherapy Planning Course for their kind permission to use their contouring data in this manuscript.
Footnotes
R.J. is supported by The Health Foundation (UK). N.G.B. is supported by the NIHR Cambridge Biomedical Research Centre.
References
- 1.McKenzie A, Coffey M, Greener T, Hall C, Van Herk M, Mijnheer B, et al. Technical overview of geometric uncertainties in radiotherapy. In: British Institute of Radiology Working Party. Geometric Uncertainties in Radiotherapy. London, UK: British Institute of Radiology, 2003 [Google Scholar]
- 2.Petersen RP, Truong PT, Kader HA, Berthelet E, Lee JC, Hilts ML, et al. Target volume delineation for partial breast radiotherapy planning: clinical characteristics associated with low interobserver concordance. Int J Radiat Oncol Biol Phys 2007;69:41–8 [DOI] [PubMed] [Google Scholar]
- 3.Coles CE, Wilson CB, Cumming J, Benson JR, Forouhi P, Wilkinson JS, et al. Titanium clip placement to allow accurate tumour bed localisation following breast conserving surgery - Audit on behalf of the IMPORT Trial Management Group. Eur J Surg Oncol 2009;35:578–82 [DOI] [PubMed] [Google Scholar]
- 4.Breen SL, Publicover J, De Silva S, Pond G, Brock K, O'Sullivan B, et al. Intraobserver and interobserver variability in GTV delineation on FDG-PET-CT images of head and neck cancers. Int J Radiat Oncol Biol Phys 2007;68:763–70 [DOI] [PubMed] [Google Scholar]
- 5.Feuvret L, Noël G, Nauraye C, Garcia P, Mazeron JJ. Conformal index and radiotherapy. Cancer Radiother 2004;8:108–19 [DOI] [PubMed] [Google Scholar]
- 6.Feuvret L, Noël G, Mazeron JJ, Bey P. Conformity index: a review. Int J Radiat Oncol Biol Phys 2006;64:333–42 [DOI] [PubMed] [Google Scholar]
- 7.Remeijer P, Rasch C, Lebesque J, V, van Herk M. A general methodology for three-dimensional analysis of variation in target volume delineation. Med. Phys 1999;26:931–40 [DOI] [PubMed] [Google Scholar]
- 8.Gual-Arnau X, Ibanez-Gual M, V, Lliso F, Rold'an S. Organ contouring for prostate cancer: interobserver and internal organ motion variability. Comput Med Imag Graph 2005;29:639–47 [DOI] [PubMed] [Google Scholar]
- 9.Song WY, Chiu B, Bauman GS, Lock M, Rodrigues G, Ash R, et al. Prostate contouring uncertainty in megavoltage computed tomography images acquired with a helical tomotherapy unit during image-guided radiation therapy. Int J Radiat Oncol Biol Phys 2006;65:595–607 [DOI] [PubMed] [Google Scholar]
- 10.Sheehan FH, Geiser EA, Munt B, Otto CM. Performance of user independent echocardiographic border detection algorithm: comparison with human observer variability. Int J Cardiovasc Imag 2005;21:617–25 [DOI] [PubMed] [Google Scholar]
- 11.Deurloo KEI, Steenbakkers RJHM, Zijp LJ, de Bois JA, Nowak PJCM, Rasch CRN, et al. Quantification of shape variation of prostate and seminal vesicles during external beam radiotherapy. Int J Radiat Oncol Biol Phys 2005;61:228–38 [DOI] [PubMed] [Google Scholar]
- 12.Steenbakkers RJ, Duppen JC, Fitton I, Deurloo KE, Zijp LJ, Comans EF, et al. Reduction of observer variation using matched CT-PET for lung cancer delineation: a three-dimensional analysis. Int J Radiat Oncol Biol Phys 2006;64:435–48 [DOI] [PubMed] [Google Scholar]
- 13.Rao M, Stough J, Chi Y, Muller K, Tracton G, Pizer SM, et al. Comparison of human and automatic segmentations of kidneys from CT images. Int J Radiat Oncol Biol Phys 2005;61:954–60 [DOI] [PubMed] [Google Scholar]
- 14.van derPut RW, Raaymakers BW, Kerkhof EM, van Vulpen M, Lagendijk JJ. A novel method for comparing 3D target volume delineations in radiotherapy. Phys Med Biol 2008;53:2149–59 [DOI] [PubMed] [Google Scholar]
- 15.Burton K, Jefferies S, Jena R, Estall V, Burnet N. Inter and intra observer variation in the gross tumour volume (GTV) delineation for glioblastoma (GBM). Radiother Oncol 2008;88:S27 [Google Scholar]


