

Abstract
Following transcatheter arterial chemoembolisation (TACE), the appearances on CT or MR images are largely related to the chemical and ischaemic insults to the portal tract. Understanding the mechanism of TACE-induced changes is essential for radiologists in order to determine the therapeutic effect as well as to distinguish these changes from recurrent tumours. This pictorial review illustrates the haemodynamic and substantial parenchymal changes related to TACE for hepatic malignancy.
Portal venous perfusion is essential for the function and survival of hepatocytes, whereas the hepatic artery primarily supplies the hepatic framework of the portal tract. Almost all hepatic tumours receive their blood supply from the hepatic artery (Figure 1) [1, 2]. Although several therapeutic options have been advocated, transcatheter arterial chemoembolisation (TACE) has been widely used for hypervascular hepatocellular carcinomas (HCCs) as an effective and palliative treatment [3]. Despite technical efforts to achieve highly selective embolisation of the tumour-supplying vessels, small or large insults to the non-tumorous parenchyma are inevitably induced by the embolic materials or procedure itself. In addition to functional problems, the various imaging appearances of the TACE-induced parenchymal injury have presented a challenge when determining the therapeutic effect or distinguishing this parenchymal injury from the viable tumour. In this article, we review the TACE-induced haemodynamic and parenchymal changes and illustrate their CT and MRI features.
Figure 1.
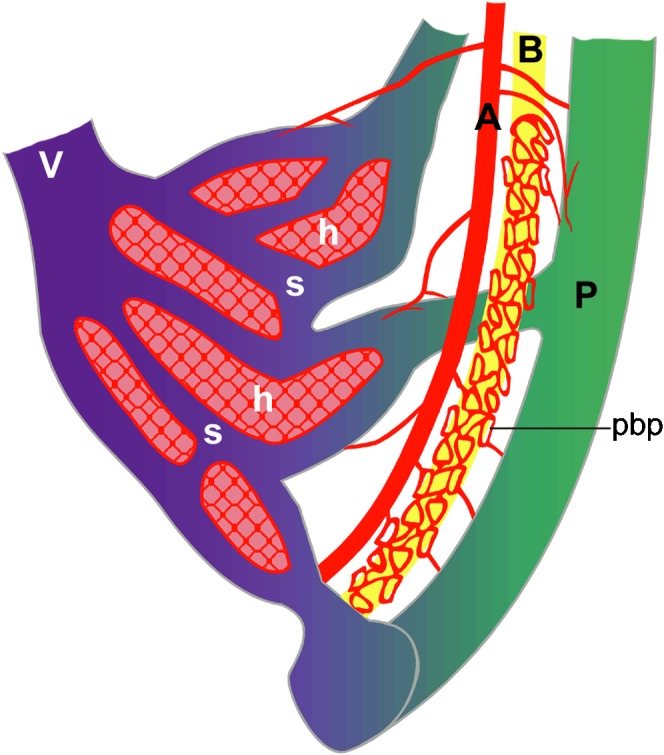
Schematic anatomy of normal hepatic vessels. The hepatic artery (A) primarily supplies the hepatic framework of the portal tract, which consists of the portal vein (P), bile duct (B) and hepatic artery. There are capillary networks between the hepatic artery (A) and portal vein (P), which is called the peribiliary plexus (pbp), and the portal venous flow affords sinusoidal (s) perfusion, supplying the hepatocytes (h). V, hepatic vein.
Protocols for TACE and follow-up
Our routine protocol for TACE includes the administration of an emulsion consisting of 1–20 ml of iodised oil (lipiodol; Andre-Guerbet, Aulnay-Sous-Bois, France) and 10–50 mg of doxorubicin (Adriamycin; Kyowa Hakko Kogyo, Tokyo, Japan), with the dose depending on the size, extent and vascularity of the tumour. If possible, the emulsion is injected exclusively into the tumour-feeding segmental or subsegmental arterial branches. This is followed by administration of gelatin sponge (Gelfoam; Upjohn, Kalamazoo, MI) fragments [3, 4]. The first follow-up CT is performed three or four weeks after TACE, and further follow-up CT examinations are performed three months and six months after TACE (Figure 2). If there is no evidence of recurrence of HCC in the six months following TACE, α-fetoprotein levels should be checked every three months and follow-up CT should be taken every year. Repeat TACE or radiofrequency ablation is recommended for residual tumour, marginal recurrence, intrahepatic metastases or newly developed lesions with arterial enhancement and venous washout on follow-up CT. MRI is needed for artefacts from dense lipiodol accumulation and arterial hypervascular pseudolesions from perfusion variation, and a technical limitation such as unoptimised arterial phase imaging for follow-up CT. Repeat TACE is performed for the HCC recurrence seen on MRI, and cases with no recurrence require routine follow-up CT examinations.
Figure 2.

Flowchart of follow-up CT examinations and MRI after transcatheter arterial chemoembolisation (TACE).
Bile duct injuries
Bilomas are the most common type of biliary complication after TACE [5]. The incidence of bile duct injury was significantly higher in patients with non-advanced cirrhotic liver, those undergoing highly selective embolisations and those with a history of repeated TACE procedures [6]. In acute-stage bile duct injury, necrosis of the bile ductule followed by rupture may lead to biloma formation, with or without secondary infection, and abscess formation, which may require an urgent drainage procedure (Figures 3 and 4). Stricture and dilatation of the bile duct are indicative of chronic-stage bile duct injury (Figure 3).
Figure 3.

Schemata of acute and chronic transcatheter arterial chemoembolisation (TACE)-induced bile duct injury and portal vein obliteration, with or without parenchymal infarct. (a) In the acute stage, necrosis of the bile duct induces rupture of the bile duct and biloma formation (asterisks) along the portal tract. A large cystic biloma can occupy the space of the acutely infarcted parenchyma. (b) In the chronic stage, the portal tract injury with stricture and dilatation of the bile ducts is accompanied by gradual portal vein obliteration, resulting in parenchymal atrophy.
Figure 4.

A 50-year-old man with underlying diabetes mellitus (DM) shows transcatheter arterial chemoembolisation (TACE)-induced portal tract and parenchymal injury, consisting of infarct and biloma formation with secondary infection by air-forming bacteria. (a) Before TACE, the portal vein branch in segment 4 (arrow) is well demonstrated on the portal phase of post-contrast CT. (b) On the 1 month follow-up CT after TACE, portal phase CT reveals an area with the density of air, which is a necrotic portal tract (arrow) that is associated with adjacent subcapsular fluid collection, suggesting biloma (arrowheads).
Portal vein obliteration
In addition to the direct chemical and ischaemic insults by the embolic agents via the vasa vasorum or periportal capillary plexus, extravasated bile from the disruption of the necrotised bile duct can track along the sheaths of Glisson capsule and result in portal phlebitis and compromised vascular patency [4, 7]. There is also the possibility that the dilated bile duct proximal to the stricture site will gradually compress the adjacent portal vein branches in the injured portal tract (Figures 3–5). Gross appearance of large intrahepatic bile duct injury tends to be followed by obliteration of the adjacent portal vein (Figure 5). Bile duct dilatations usually appear within one month after TACE, and most of the portal vein obliteration appears one to six months after TACE [4].
Figure 5.

A 51-year-old man shows transcatheter arterial chemoembolisation (TACE)-induced bile duct injury. (a) On the 1 month follow-up CT after TACE, portal phase CT shows low density (arrow) alongside the portal vein branch, suggesting bile duct injury. (b) On the 8 month follow-up CT after TACE, portal phase CT demonstrates further progression of the bile duct injury with proximal bile duct dilatation (arrow) and chronic stricture of the distal bile duct in the lateral segment of the left lobe of liver.
Acute parenchymal infarct
Owing to the intra-arterially infused chemoembolic materials, the period of stasis of arterial flow depends on the arterial diameter, the development of collateralisation and the total amount and density of embolic materials used. Embolic materials flow into the portal venules through the transplexal route, which leads to obliteration of the portal venules [7]. In the above conditions, the simultaneously decreased arterial and portal venous perfusion results in parenchymal infarction, which appears as a low-density area on all phases of dynamic CT (Figure 6). During the follow-up periods, some arterial inflow can be recovered by arterial recanalisation or collateralisation (Figure 7). Arterial reperfusion of previously infarcted parenchyma can demonstrate inhomogeneous enhancement on arterial phase images. Owing to the decreased attenuation of the infarcted area on pre-contrast and equilibrium-phase images, it can be hard to differentiate the reperfused area from a viable tumour that shows subsequent washout of contrast material. Superparamagnetic iron oxide particle (SPIO) uptake is also decreased in the infarcted parenchyma in the vicinity of the lesion (Figure 8).
Figure 6.

A 60-year-old woman with biloma formation after transcatheter arterial chemoembolisation (TACE). (a) On the portal phase CT scan, the branching pattern of the biloma (arrowheads) is shown 3 weeks after TACE. (b) Below the level of (a), the portal phase of dynamic CT shows linear biloma formation (arrowheads) along the right posterior segmental branch of the the portal vein (arrow). (c) On the 3 month follow-up CT after TACE, portal phase imaging depicts obliteration of the portal vein (arrow) and delayed infarction with decreased perfusion (arrowheads) in the posterior segment of the right lobe of the liver. (d) On the 7 month follow-up CT after TACE, the obliterated portal vein branch (arrow) and the atrophic change (arrowheads) in the posterior segment of the right lobe of liver is shown in the portal phase.
Figure 7.

A 63-year-old woman with parenchymal infarction after transcatheter arterial chemoembolisation (TACE). (a) Schema of acute infarction after TACE. Embolic materials flow into the portal venules and lead to obliteration of portal venules. At the same time, decreased perfusion results in parenchymal infarct. (b) A CT scan, obtained 3 weeks after TACE, shows wedge-shaped, non-enhancing low density intermingled with high-density iodised oil, suggesting subsegmental parenchymal infarction (arrowheads). (c) 2 months after TACE, marked atrophic change (arrowheads) at the area corresponding to parenchymal infarct is noted on the portal phase CT.
Figure 8.

A 65-year-old man with a perilesional infarct around the treated hepatocellular carcinoma (HCC), with iodised oil accumulation after transcatheter arterial chemoembolisation (TACE). (a) Pre-contrast CT image reveals decreased density (arrow) at the parenchymal retraction area on the anterior aspect of the iodised oil-accumulated lesion (arrowhead). (b) Arterial phase of dynamic MRI shows nodular enhancement (arrow) adjacent to the iodised oil lesion (arrowhead). (c) Decreased uptake of superparamagnetic iron oxide particles (SPIOs) (arrow) at the area of arterial enhancement on SPIO-enhanced T2∗ weighted gradient-echo MRI. High signal intensity of the small iodised oil accumulation (arrowhead) is not distinguishable from the adjacent infracted/atrophic parenchyma (arrow). (d) 9 month follow-up CT shows further contraction of the atrophic subsegment (arrow) on the anterior aspect of the iodised oil lesion (arrowhead) without any evidence of recurrent HCC.
Arterioportal fistulae
After TACE, chemical or ischaemic injury of the portal tract and direct mechanical injury of the arterial wall by the guide wire or catheter itself can induce the formation of a fistula between small arteries and the portal vein branches alongside [8]. Typically, subcapsular, wedge-shaped or irregular arterial phase enhancement during dynamic CT or MRI could be regarded as an arterioportal fistula (APF) (Figures 9 and 10). Owing to the traumatic or acute inflammatory nature of this injury, most traumatic APFs would disappear on the serial follow-up imaging studies (Figure 9). In the advanced cirrhotic liver, differential diagnosis of APF from recurrent HCC is sometimes difficult because of the parenchymal distortion and inhomogeneous attenuation of the background liver on delayed-phase images (Figure 11). MRI using Kupffer cell agent (SPIO) is helpful for excluding a true tumour from an acute APF-induced arterioportal shunt that shows normal SPIO uptake (Figure 11) [9].
Figure 9.

A 49-year-old woman with transcatheter arterial chemoembolisation (TACE)-induced arterioportal fistula formation. (a) Schema of a TACE-induced fistula. TACE-related portal tract injury can induce fistula formation between the small peripheral hepatic artery and the portal vein branches. Owing to the higher arterial perfusion pressure, the gross arterioportal shunt (asterisk) locally replaces the portal venous perfusion. (b) Arterial phase image of dynamic CT taken 3 months after TACE reveals the portal vein branch (arrow) and wedge-shaped parenchymal perfusion (arrowheads) from the arterioportal shunt through the arterioportal fistula in the vicinity of the dense iodised oil accumulation area (asterisk). (c) 9 months after TACE, gross appearance of the portal vein branch is not noted and the extent of parenchymal enhancement (arrowheads) is diminished on the arterial phase dynamic CT (asterisk indicates dense iodised oil accumulation area). (d) TACE-induced arterioportal shunt is no longer demonstrated on the 1 year follow-up CT (asterisk indicates dense iodiset oil accumulation area). (e) Dynamic MRI obtained at 13 week follow-up shows a wedge-shaped arterial enhancement (arrowheads) adjacent to the iodised oil accumulation site (asterisk). (f) The arterial enhancing area is not distinguished from background parenchyma on the superparamagnetic iron oxide particle-enhanced T2∗ weighted gradient-echo MRI obtained at 13 week follow-up after TACE (asterisk indicates dense iodised oil accumulation area).
Figure 10.

A 54-year-old man with transcatheter arterial chemoembolisation (TACE)-induced arterioportal shunt, portal vein obliteration and infarct. (a) Arterial phase dynamic CT depicts an amorphous enhancement (arrows) in the left lobe of the liver and subsegmental atrophy with partial iodised oil accumulation (arrowheads) at segment 8. (b) On dynamic MRI, arterial enhancement in the left lobe of the liver represents the TACE-induced arterioportal shunt (arrows). Decreased perfusion at S8 indicates infarction (arrowheads). (c) Superparamagnetic iron oxide particle (SPIO)-enhanced delayed MR image shows normal SPIO uptake at the arterioportal shunt area and decreased SPIO uptake at the infarcted area (arrowheads).
Figure 11.

A 77-year-old man with a hypervascular pseudolesion around the treated nodular hepatocellular carcinoma (HCC), with dense iodised oil accumulation. (a) On arterial phase dynamic CT, nodular arterial enhancement (arrowhead) abutting to the iodised oil accumulation is suggestive of marginal recurrence of HCC. (b) Inhomogeneouly decreased density at the arterial enhancing area looks like the washout appearance (arrowhead) of hypervascular HCC on the portal phase dynamic CT. (c) On superparamagnetic iron oxide particle SPIO-enhanced T2∗ weighted gradient-echo MRI, the hypervascular lesion shows normal SPIO uptake in the anterior aspect of the pre-existing iodised oil accumulation area (arrowhead).
Parenchymal atrophy
Parenchymal atrophy occurs because of decreased portal venous perfusion following acute or gradual vascular compromise caused by bile duct injury, arterial vasculitis, portal phlebitis and/or passive compression (Figures 5, 6, 8 and 10) [4, 10]. Depending on the extent of involvement, TACE-induced parenchymal atrophy in the cirrhotic liver, in which portal venous inflow is already decreased by portal hypertension, may deteriorate liver function. Yu et al [4] reported the mean time between TACE and the appearance of atrophic changes as 20 weeks.
Conclusions
After TACE, the appearances on CT or MRI are largely related to the chemical and ischemic insults to the portal tract. The mechanism and imaging findings of TACE-induced changes should be familiar to radiologists, so that they can determinate the therapeutic effect as well as distinguish such changes from a recurrent tumour. Serial follow-up is still essential and selective application of liver-specific contrast-enhanced MRI is recommended for accurate assessment of relevant conditions.
References
- 1.Charnsangavej C, Chuang V, Wallace S, Soo C, Bowers T. Transcatheter management of primary carcinoma of the liver. Radiology 1983;147:51–5 [DOI] [PubMed] [Google Scholar]
- 2.Wallace S, Charnsangavej C, Carrasco CH, Bechtel W. Infusion-embolization. Cancer 1984;54:2751–65 [DOI] [PubMed] [Google Scholar]
- 3.Uchida H, Ohishi H, Matsuo N, Nishimine K, Ohue S, Nishimura Y, et al. Transcatheter hepatic segmental arterial embolization using lipiodol mixed with an anticancer drug and Gelfoam particles for hepatocellular carcinoma. Cardiovasc Intervent Radiol 1990;13:140–5 [DOI] [PubMed] [Google Scholar]
- 4.Yu JS, Kim KW, Park MS, Yoon SW. Bile duct injuries leading to portal vein obliteration after transcatheter arterial chemoembolization in the liver: CT findings and initial observations. Radiology 2001;221:429–36 [DOI] [PubMed] [Google Scholar]
- 5.Kim HK, Chung YH, Song BC, Yang SH, Yoon HK, Yu ES, et al. Ischemic bile duct injury as a serious complication after transarterial chemoembolization in patients with hepatocellular carcinoma. J Clin Gastroenterol 2001;32:423–7 [DOI] [PubMed] [Google Scholar]
- 6.Yu JS, Kim KW, Jeong MG, Lee DH, Park MS, Yoon SW. Predisposing factors of bile duct injury after transcatheter arterial chemoembolization (TACE) for hepatic malignancy. Cardiovasc Intervent Radiol 2002;25:270–4 [DOI] [PubMed] [Google Scholar]
- 7.Shea WJ, Jr, Demas BE, Goldberg HI, Hohn DC, Ferrell LD, Kerlan RK. Sclerosing Cholangitis associated with hepatic arterial FUDR chemotherapy: radiographic histologic correlation. AJR Am J Roentgenol 1986;146:717–21 [DOI] [PubMed] [Google Scholar]
- 8.Yu JS, Kim KW, Sung KB, Lee JT, Yoo HS. Small arterial–portal venous shunts: a cause of pseudolesions at hepatic imaging. Radiology 1997;203:737–42 [DOI] [PubMed] [Google Scholar]
- 9.Mori K, Yoshioka H, Itai Y, Okamoto Y, Mori H, Takahashi N, et al. Arterioportal shunts in cirrhotic patients: evaluation of the difference between tumorous and nontumorous arterioportal shunts on MR imaging with superparamagnetic iron oxide. Am J Roentgenol 2000;175:1659–64 [DOI] [PubMed] [Google Scholar]
- 10.Yamashita Y, Torashima M, Oguni T, Yamamoto A, Harada M, Miyazaki T, et al. Liver parenchymal changes after transcatheter arterial embolization therapy for hepatoma: CT evaluation. Abdom Imaging 1993;18:352–6 [DOI] [PubMed] [Google Scholar]