Abstract
Unlike hospital-based clinicians, general practitioners (GPs) lack direct contact with radiologists, and the radiology report is usually the sole method of communication from the radiologist to the GP. It is important to gain feedback regarding what GPs perceive as a good-quality radiology report, especially in the current climate of competition for provision of radiology services. The aims of this study are to determine the level of GP satisfaction with radiology reports, their perception of optimum report content and their preferences regarding the level of detail and report format. A questionnaire was sent to 100 GPs referring to our Trust for radiology services. GPs were generally satisfied with the content and clarity of reports that they receive, and gave suggestions on how reports could be improved. The majority of GPs were unfamiliar with the normal size ranges of frequently measured anatomical structures. Radiologists' recommendations for further treatment, referral and non-radiological investigation were viewed as valuable report components. When asked to rank preferences for ultrasound reports for the same patient with differing formats and levels of detail, GPs favoured detailed reports in a tabulated format. In conclusion, the majority of GPs like detailed reports and value the radiologist's opinion outside the remit of imaging when suggesting further patient management. Reporting the size of a structure without explanation of its significance can potentially cause confusion. It is important to know if GPs are satisfied with the radiology reports they receive so that we can uphold high communication standards and ultimately improve patient care.
The radiology report is usually the sole method of communication from the radiologist to the general practitioner (GP) in the primary care setting. Unlike hospital-based clinicians, GPs do not have the benefit of visiting the radiology department directly and discussing cases at clinicoradiological meetings. This lack of direct contact makes it difficult for GPs to discuss and clarify imaging issues; it also means that radiologists do not get feedback from GPs regarding what they want from a radiology report.
In the current NHS climate, where there is increasing plurality of provision of clinical services, it is important that the end-users of radiology reports are satisfied. Dissatisfaction could potentially cause GPs to find alternative providers for their imaging needs. It is also important for us to know what GPs want from their radiology reports as, ultimately, patient treatment is frequently determined by what is written in the report.
There is a gap in the British literature regarding GPs' opinions of radiology reports that they receive. The objectives of this study are to determine the level of GP satisfaction with radiology reports, their perception of the optimum content of a radiology report and their preferences regarding the level of detail and report format.
Methods
A questionnaire (Appendix 1) was posted to 100 named GPs representing 21 GP surgeries that refer to our Trust for radiology services. The main body of the questionnaire was divided into two sections. The first asked how satisfied GPs were with the radiology reports they receive and what they felt should be included in a report. GPs were asked to rank their satisfaction of report content and clarity on a scale of 1 to 10 and then to indicate whether certain components should be included in a radiology report.
In the second section, GPs were asked to rank several reports with varying levels of detail and format in order of preference. Two separate scenarios were used: a normal ultrasound examination of a patient with right upper quadrant pain and suspected gallstones and an abnormal ultrasound examination of a patient with weight loss and suspected malignancy. For the first scenario, five different styles of report were given (Table 1).
Table 1. Content of different radiology reports for a “normal” ultrasound scan of the abdomen.
| Report A | “Normal examination” |
| Report B | “Standard” prose report |
| Report C | “Standard” report in a tabulated format |
| Report D | Detailed report |
| Report E | Detailed report in a tabulated format |
Report A simply stated “normal examination”. Report B is the standard “short code” report used for normal abdominal ultrasounds in the Trust. A similar choice of reports with varying detail in both tabulated and free text formats was given to GPs in the second scenario with abnormal findings (Table 2).
Table 2. Content of different radiology reports for an ultrasound scan of the abdomen with abnormal findings.
| Report A | Brief prose report |
| Report B | Brief report in a tabulated format |
| Report C | Detailed prose report |
| Report D | Detailed report in a tabulated format |
Throughout the questionnaire, free text comments were encouraged to explain why particular choices or rankings had been made. The replies were entered onto a database and several statistical methods of analysing the ranked data were used to determine the preferred report style. As each participant was able to rank each report in any order, there are potentially 120 different ways of ranking the normal reports and 24 different ways of ranking the abnormal reports. The analysis of preference data for multiple choices has been well explored in the statistical and election/balloting literature [1]. To determine the most popular report from each group (i.e. normal and abnormal reports), taking into account all of the preference ranking data, the Baldwin, Black, Borda, Copeland, Dodgson, Nanson, Raynaud, Schulze, Simpson, Small and Tideman techniques were used. The Kemeny–Young method assigned the absolute order of preference from most popular to least popular for the different reports [2, 3]. To determine if one report was statistically preferred to another report, the Friedman statistic was used with Fisher's multiple comparisons least significant difference test.
Results
Of the 100 questionnaires sent to GPs, 60 returns were received (60% reply rate), representing 19 different GP surgeries. 63% of GPs read up to 10 radiology reports per week.
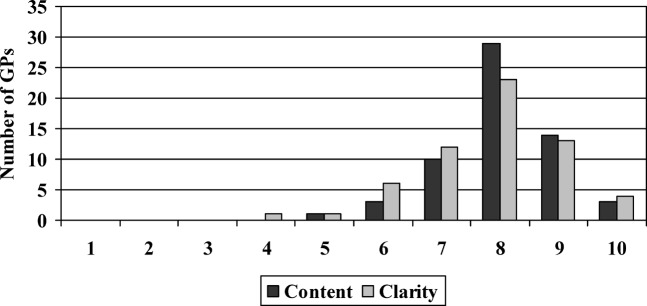
When GPs were asked to rate their satisfaction with the radiology reports they received on a scale of 1 to 10, they gave a mean score of 8.0 for report content (95% confidence interval (CI): 7.8–8.3) and 7.8 for clarity (95% CI: 7.5–8.1; Figure 1).
Figure 1.
General practitioner (GP) satisfaction scores for report content and clarity.
GPs were then asked for any comments regarding report content and clarity. Feedback indicated that most reports were clear and simple with helpful advice. However, some reports did not answer the clinical question, abbreviations were used which GPs were not familiar with and measurements were recorded without their significance being given.
GPs then gave their opinion on which elements should be included in a radiology report (Table 3). The majority felt that the following should be included in a radiology report: clinical scenario, quality of examination, recommendations for further imaging, recommendations for further non-radiological investigation, recommendations for further treatment, recommendations for further referral and a conclusion (or summary/comment) of findings. Only a minority of GPs felt that the following were important in a radiology report: examination technique, route, dose, and name of any contrast media used and the measurement of normal organs.
Table 3. General practitioners' opinions on which components should be included in a radiology report.
| Component | Yes (included) | No (not included) | Not answered |
| Clinical scenario | 57% | 40% | 3% |
| Examination technique | 27% | 70% | 3% |
| Route, dose and name of any contrast media used | 27% | 68% | 5% |
| Quality of examination | 92% | 8% | 0% |
| Measurement of normal organs | 38% | 62% | 0% |
| Recommendations for further imaging | 96% | 2% | 2% |
| Recommendations for further non-radiological investigation | 97% | 3% | 0% |
| Recommendations for further treatment | 88% | 10% | 2% |
| Recommendations for further referral | 90% | 8% | 2% |
| A conclusion (or summary/comment) of the findings | 92% | 3% | 5% |
63% of respondents felt that it is acceptable to have “normal examination” as the full radiology report. 83% of GPs felt that, if further imaging is advised, this should automatically be arranged by the radiology department.
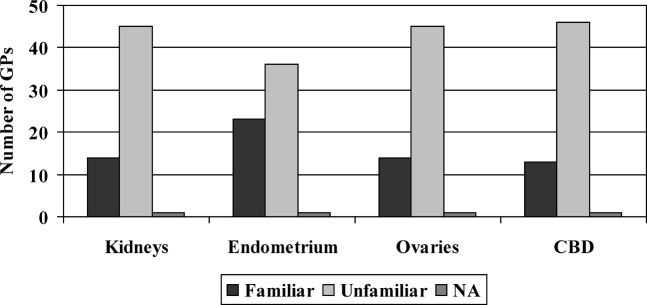
Most GPs are not familiar with the “normal” range in the size of the kidneys, endometrium, common bile duct and ovaries (Figure 2).
Figure 2.
General practitioner (GP) familiarity with “normal” size ranges of structures. NA, not answered.
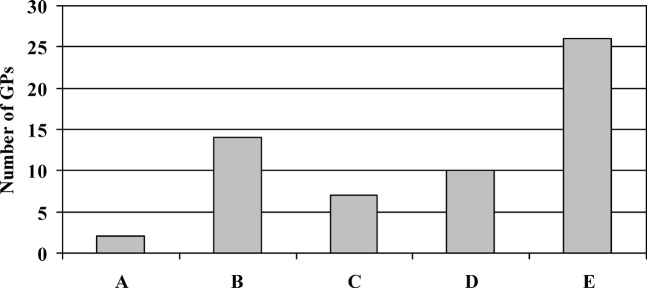
Participants then ranked five different reports (Table 1) for the same clinical scenario for an ultrasound scan of the abdomen where the result was normal. Report E, the most detailed report in a tabulated format, was most frequently ranked as the preferred report (by 44% of respondents; Figure 3).
Figure 3.
Preferred report for a “normal” abdominal ultrasound. GP, general practitioner.
By all statistical methods used and taking into account all of the ranking data (i.e. not just the most preferred report), Report E remained the most popular style. The Kemeny–Young method gave the order of popularity from most to least favourite as E–B–D–C–A. Report E was found to be statistically the best (p<0.05); Report A was the least liked (p<0.05); and there was no significant difference between Reports B, C and D.
Reasons given for Report E's popularity were that it was easy to read, clear, more thorough, answered the clinical question and reports could be shown to the patient on the computer screen. A reason given for dislike of Report A, which simply stated “normal examination”, was not knowing which organs had been examined.
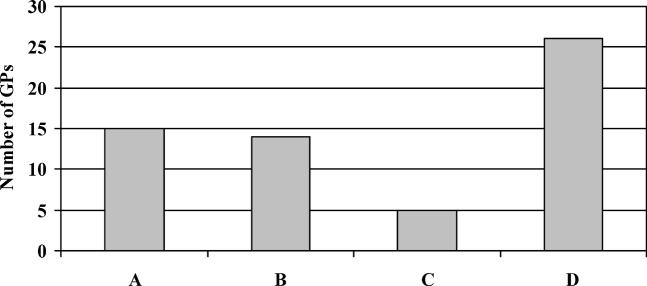
When asked to rank their order of preference for abdominal ultrasound reports that contained pathological findings, GPs most frequently ranked D the highest – the most detailed report in a tabulated format (Figure 4). The Kemeny–Young method returned the order D–B–A–C from most to least favourite. Although D is statistically better than A and C (p<0.05), there is no significant difference between D and B. Report C is statistically the worst of all (p<0.05).
Figure 4.
Preferred report for an abdominal ultrasound with abnormal findings. GP, general practitioner.
Reasons given for Report D's popularity were that they liked the clarity and detail and that patients liked the detail too. However, in contrast to the preferences given for the “normal” scan reports, respondents in this scenario least liked Report C, the detailed prose report. Reasons given were that it was too detailed, contained superfluous information and required too much concentration to read.
Discussion
The Royal College of Radiologists published “Standards for the Reporting and Interpretation of Imaging Investigations” in January 2006 [4]. This document outlines the essential steps in producing an imaging report, with sections on understanding the clinical information, technical knowledge, observation, analysis of the images, medical interpretation and advice, communication with the referrer and patient, and taking appropriate action, although specific advice is not given regarding report content and the level of detail and format. The American College of Radiologists published the “Practice Guideline for Communication of Diagnostic Imaging Findings”, which gives more detailed information on the components of a report and the communication of its findings to the referrer [5]. The Royal College of Radiologists recently undertook a “National Audit of Generic Reporting and Effective Communication” [6]. This audit involves radiologists themselves assessing the quality of communication in radiology reports sent to GPs, specifically looking at whether the clinical question has been addressed, and the clarity and appropriateness of clinical advice given.
Several authors have given their opinion regarding report content, style and structure [7–10]. These reflect the views of radiologists rather than the clinicians for whom the reports are intended. Those studies that have asked the referring clinician what they want from a radiology report are North American and Canadian [11–14]. Naik et al [12] found that Canadian referring clinicians like detailed reports in an “itemised” format. With the introduction of voice-recognition dictation systems and the possibility that computer-generated itemised reports may become commonplace in this country, we asked the GPs in our questionnaire whether they preferred a prose or itemised (tabulated) format. Sistrom and Honeyman-Buck [15] showed that there was no difference in information transfer between subjects reading free text reports and itemised reports. It has been shown that referring clinicians prefer differing levels of detail in reports depending on the clinical scenario and the type of examination [13]. A very brief report was preferred for a normal chest radiograph in an asymptomatic patient but, when a patient was symptomatic, the clinician liked more detail even though the radiograph was still normal.
It appears that the GPs replying to our questionnaire were generally satisfied with the quality of the reports they receive. However, there is always room for improvement and we can take on board the comments made regarding answering the clinical question, avoiding jargon and abbreviations, and commenting on the significance of our observations. We found that most GPs did not value the inclusion of examination technique, details of contrast media and the measurements of normal organs in a report. A probable explanation for this is that these report components are of little significance to the GP. This does not mean that radiologists should exclude them from the report, and indeed they are important pieces of documentation. Most GPs stated that they were not familiar with the normal size ranges of different anatomical structures, so reporting the size of an organ without explanation of its significance is confusing. The overwhelming majority of GPs value the radiologist's opinion outside the remit of imaging, when recommending further treatment, referral and non-radiological investigation. This differs from hospital-based clinicians, a smaller proportion of who value the radiologist's advice on these matters [16].
Reports in a tabulated format were favoured over free text, as they were considered easier to read. In general, the feedback from GPs regarding the length of report was that they liked a high level of detail and sometimes showed the reports directly to patients, who also like detail. For a “normal” scan, GPs ranked the briefest report as the worst, and not knowing what organs had been examined was given as a reason for this. In contrast, when pathological findings were included in the report, the respondents ranked the detailed report in a free text format as the least favoured. An explanation for this is that, as the report length increases, finer detail becomes less important to the reader.
There is scope for further studies to examine preferences regarding content and format of plain film, CT and MR reports and to obtain the opinions of other healthcare professionals, such as physiotherapists, who request imaging and have little direct contact with radiologists. In conclusion, it is important that radiology reports contain information that is desired by the referring clinician in a format which they find clear and easy to assimilate, and radiologists should be vigilant to respond to the needs of the clinician. Contacting GPs for their opinion allows us to optimise our radiology reports by knowing our audience and there is no reason why our results are not translatable across a wider area to radiologists, reporting radiographers and sonographers in other regions.
Appendix 1. Questionnaire sent to GPs
Section 1
Please circle answers where appropriate:
How satisfied are you with the content of radiology reports you receive (on a scale of 1–10)?
1 2 3 4 5 6 7 8 9 10
Please indicate the clarity of radiology reports you receive (on a scale of 1–10)?
Confusing 1 2 3 4 5 6 7 8 9 10 Clear
Please give reasons for any dissatisfaction below.
____________________________________________________________________________________________________________________________________________________
Section 2
The following are different reports for the same abdominal ultrasound examination with a clinical scenario of “RUQ pain, ? gallstones”.
Please indicate your order of preference for these reports below.
Report A
Normal examination.
Report B
Normal liver, pancreas, gallbladder, biliary tree, spleen and kidneys. The aortic dimensions are within normal limits.
Report C
Report D
Normal appearances of the liver, intrahepatic biliary tree, gallbladder, common bile duct, spleen, kidneys, pancreas. The right kidney measures 8.4 cm in bipolar length, the left 9.0 cm. No gallstones seen. No intrahepatic biliary duct or common bile duct dilatation (CBD diameter 3 mm).
Comment: No cause for pain identified.
Report E
Most preferred 1____ 2____ 3____ 4____ 5____ Least preferred
Please give any reasons for your answer.
____________________________________________________________________________________________________________________________________________________
The following are different reports for the same abdominal ultrasound examination with a clinical scenario of “Upper abdo pain & weight loss, ? malignancy”.
Please indicate your order of preference for these reports below.
Report A
Three solid-appearing masses within the right lobe of the liver. The largest of these measures 3.0 × 2.5 cm. Appearances are in keeping with liver metastases. Normal pancreas, gallbladder, biliary tree, spleen and kidneys. The aortic dimensions are within normal limits.
CT thorax, abdomen and pelvis has been arranged.
Report B
Report C
Three solid-appearing masses within the right lobe of the liver. These lesions measure 3.0 × 2.5 cm, 2.5 × 2.8 cm and 2.3 × 2.6 cm. Appearances are in keeping with liver metastases. Normal appearances of the intrahepatic biliary tree, gallbladder and common bile duct. No biliary tree dilatation (CBD 4 mm diameter). Normal appearances of the spleen, kidneys and pancreas. The right kidney measures 8.8 cm in bipolar length, the left 9.4 cm
Comment: Likely hepatic metastases. No further intra-abdominal abnormality identified. CT thorax, abdomen and pelvis has been arranged.
Report D
Most preferred 1____ 2____ 3____ 4____ Least preferred
Please give any reasons for your answer.
____________________________________________________________________________________________________________________________________________________
Section 3
Regarding yourself (please circle where appropriate):
Speciality: ____________________________ Number of years practising: ________
Grade: Consultant/GP Staff Grade SpR Clinical Fellow SHO FY2 FY1
Average number of radiology reports read per week:
0–10 10–20 20–30 30–40 >40
Would you like to receive feedback from this questionnaire? yes / no
Thank you for your time.
References
- 1.Nurmi H. Voting procedures: a summary analysis. Br J Polit Sci 1983;13:181–208 [Google Scholar]
- 2.Kemeny J. Mathematics without numbers. Daedalus 1959;88:571–91 [Google Scholar]
- 3.Young HP, Levenglick A. A consistent extension of condorcet's election principle. SIAM J Appl Math 1978;35:285–300 [Google Scholar]
- 4.Royal CollegeofRadiologists Standards for the Reporting and Interpretation of Imaging Investigations. London, UK: The Royal College of Radiologists, 2006 [Google Scholar]
- 5.ACR PracticeGuidelineforCommunicationofDiagnosticImaging Reston, Virginia, USA: American College of Radiologists, 2005. [Google Scholar]
- 6.Royal CollegeofRadiologists National Audit of Generic Reporting and Effective Communication. London, UK: Royal College of Radiologists, 2007/2008. [Google Scholar]
- 7.Hall FM. Language of the radiology report: primer for residents and wayward radiologists. AJR Am J Roentgenol 2000;175:1239–42 [DOI] [PubMed] [Google Scholar]
- 8.Friedman PJ. Radiologic reporting: structure. AJR Am J Roentgenol 1983;140:171–2 [DOI] [PubMed] [Google Scholar]
- 9.Style guidelines for radiology reporting: a manner of speaking. AJR Am J Roentgenol 2003;180:327–8 [DOI] [PubMed] [Google Scholar]
- 10.Berlin L. Radiology reports. AJR Am J Roentgenol 1997;169:943–6 [DOI] [PubMed] [Google Scholar]
- 11.Clinger NJ, Hunter TB, Hillman BJ. Radiology reporting: attitudes of referring physicians. Radiology 1988;169:825–6 [DOI] [PubMed] [Google Scholar]
- 12.Naik SS, Hanbidge A, Wilson SR. Radiology reports: examining radiologist and clinician preferences regarding style and content. AJR Am J Roentgenol 2001;176:591–8 [DOI] [PubMed] [Google Scholar]
- 13.McLoughlin RF, So CB, Gray RR, Brandt R. Radiology reports: how much descriptive detail is enough? AJR Am J Roentgenol 1995;165:803–6 [DOI] [PubMed] [Google Scholar]
- 14.Lafortune M, Breton G, Baudouin JL. The radiological report: what is useful for the referring physician? Can Assoc Radiol J 1988;39:140–3 [PubMed] [Google Scholar]
- 15.Sistrom CL, Honeyman-Buck J. Free text versus structured format: information transfer efficiency of radiology reports. AJR Am J Roentgenol 2005;185:804–12 [DOI] [PubMed] [Google Scholar]
- 16.Plumb AAO, Grieve FM, Khan SH. Survey of hospital clinicians' preferences regarding the format of radiology reports. Clin Radiol 2009;64(4):386–94 [DOI] [PubMed] [Google Scholar]


