

Abstract
High aspect ratio peptide nanofibers have potential as biodegradable vehicles for drug delivery. We report here the synthesis of four self-assembling peptide amphiphiles (PAs) containing a lysine ε-amine-derivatized hydrazide that was systematically placed at different positions along the backbone of the peptide sequence C16V2A2E2 (where C16 = palmitic acid). Hydrazones were formed from each hydrazide by condensation with the solvatochromic dye 6-propionyl-2-dimethylaminonaphthalene (Prodan), which is typically used to probe cell membranes. All four compounds were found to self-assemble into nanofibers, and Prodan release was measured from filamentous gels prepared by screening PA charges with divalent cations. Near zero-order release kinetics were observed for all nanofibers, but release half-lives differed depending on the position of the fluorophore in the PA sequence. Dye release kinetics were rationalized through the use of cryogenic transmission electron microscopy, small-angle X-ray scattering, fluorescence spectroscopy, fluorescence anisotropy, circular dichroism, and partition coefficient calculations. Relative release rates were found to correlate directly with fluorophore mobility, which varied inversely with packing density, degree of order in the hydrophobic PA core, and the β-sheet character of the peptide.
Introduction
Drug delivery using implantable materials has revolutionized several areas of medicine by facilitating the release of medication at predetermined, characteristic rates.1–3 However, the need remains for increased control of drug release rates and greater biocompatibility and biodegradability of the delivery vehicles. Self-assembling small molecules that form nanoscale supramolecular filaments can gel in the presence of electrolytes and offer an attractive alternative to traditional polymeric hydrogels.4–6 These self-assembling filaments can also be easily coated on the surfaces and internal pores of implantable scaffolds.7,8 One major advantage of low molecular weight gelators is the possibility of injecting them as free flowing solutions that gel quickly in vivo at a desired location.9,10 Biodegradable low molecular weight gelators are especially promising since they do not require use of potentially toxic crosslinking agents and can easily have tunable mechanical properties.11,12 Moreover, a completely biodegradable scaffold eliminates the need to remove the drug-releasing implant after the drug supply is exhausted, and the biologically relevant components of these matrices (e.g., peptides) can be completely characterized at a molecular scale, decomposing in vivo into predictable, small molecule metabolites.
Small molecule gelators rely on supramolecular interactions to form 3D networks of one-dimensional nanostructures.13 One broad class of self-assembling, small molecule gelators that has received significant attention in recent years is a family of compounds known as peptide amphiphiles. (PAs).14,15 Our laboratory has shown that a subset of PAs that form self-assembled nanofibers holds promise as bioactive materials in applications such as spinal cord injury,16 cardiovascular disease,17,18 bone,19 cartilage,20 and enamel regeneration21 and cancer therapeutics.22
PAs are synthesized using solid-phase peptide synthesis by conjugating a hydrophobic tail to a short peptide sequence. When dissolved in water, PAs tend to self-assemble into cylindrical aggregates that contain three distinct structural regions in their cross-section (Figure 1).23 Region I contains a hydrophobic tail, which forms the core of the PA nanofiber. Moving outwardly, region II consists of β-sheet forming amino acids that induce formation of a filamentous nanostructure with hydrogen bonds that in many PAs tend to be oriented along the long axis of the fiber.24 Region III consists of one or more charged residues to impart water solubility. Additionally, a bioactive sequence can be added to the solvent-exposed end of the peptide sequence.25–27 PA nanofibers are typically 5–15 nm in width and microns in length. Under charge screening conditions, PAs gel at low (<1 wt. %) concentration and resemble the fibrous mesh of the extracellular matrix.15 Gelation in vivo can be accomplished by injection of a free-flowing PA solution with pre-assembled nanostructures and low charge screening (e.g., low salt concentration) into the high ionic strength environment of biological tissues.16 To customize systems to specific applications, the mechanical properties of PA assemblies can be tuned by changing the amino acids in region II of these molecules.12
Fig 1.

(A) Chemical structure of PA E2 (C16V2A2E2). (B) The different regions of the PA are highlighted in a space-filling model. (C) Schematic illustration of a self-assembled PA nanofiber.
In addition to their cell signaling capabilities, in vivo-gelling peptide materials are good candidates for delivery of drugs and proteins.10,28–31 In previously reported systems designed to release small molecule drugs from supramolecular gels, drug encapsulation and release are usually regulated by the hydrophobic and ionic interactions between the drug and the hydrogel.4 Small molecule drugs that are more favorably sequestered by the hydrogel are released more slowly than those that are less favorably sequestered. Our laboratory previously sequestered diazeniumdiolates by this method to slow the release of nitric oxide.32 Other groups have also used the sequestration method for protein release, including work from both Schneider and Zhang demonstrating that both electrostatics and sterics affect release kinetics.28,29 A better controlled, more modular technique for controlling drug release is to tether drugs to a scaffold or carrier using pH-sensitive bonds such as acetals, orthoesters and hydrazones. Of these linkages, the hydrazone bond has seen widespread use due to its specific reactivity with aldehydes and ketones.33 Many important drugs contain ketone functionalities, including cancer therapeutics (doxorubicin, paclitaxel), anti-inflammatories (dexamethasone, ketoprofen), analgesics (methadone, steroids), and others. Additionally, hydrazone linkages are used in clinical therapies to conjugate antibodies to small molecule drugs and are considered safe.34 Drug release using hydrazones has become a common method of delivering therapeutics in preclinical nanoscale drug delivery systems, but extensions of this chemistry to hydrogels are rare.35
We recently reported a method for site-specifically installing hydrazides into PA molecules by addition of a triply-protected hydrazino acid to a lysine ε-amine.31 Covalent tethering of a ketone-containing drug to the PA by formation of a hydrazone was successful, and near zero-order release of the drug by hydrazone hydrolysis was observed. However, we found that control over drug release rate at neutral pH was only possible by changing the drug. As a result, little control is afforded from the hydrazone itself when a specific drug is to be delivered. In a unique demonstration of structure-dependent drug release, Fréchet and co-workers observed in dendrimers that pH-sensitive acetal bonds show an environmental dependence on hydrolysis rate.36 In this report, acetal hydrolysis was slowed by increasing the hydrophobicity of the local environment surrounding the acetal linkage. This study suggests that hydrazone hydrolysis, and therefore drug release kinetics, could be controlled by the chemical environment surrounding the hydrazone.
PA nanofibers are believed to be well-hydrated throughout the peptidic portion of the nanostructure,37,38 but hydrophobicity and water dynamics within the peptide compartment should vary significantly from the tightly-packed region II to the hydrophilic, charged region III. Based on the concept of environmentally dependent hydrolysis, we hypothesized that the release rate of a hydrazone-tethered model drug covalently bound to PAs might be controlled by its position within the nanostructure. We report here on the release of the fluorescent molecule Prodan as a drug model tethered to PA molecules through a hydrolyzable hydrazone bond. We probed the release kinetics of Prodan by changing the position of the lysine-hydrazone-Prodan residue in the PA sequence.
Results
PA Synthesis
Four PAs (1–4) (Table 1), each containing a free hydrazide, were synthesized using standard Fmoc-based solid-phase peptide synthesis conditions with a protected hydrazido acid, as previously described.31 PAs 1–4 were designed based on the C16V2A2E2 (E2) sequence used previously by our laboratory (Figure 1).39 The ketone-containing fluorescent dye Prodan (6-propionyl-2-(N,N-dimethyl)aminonaphthalene) was chosen as the model delivery molecule because of the possibility of using it as a dielectric probe of the PA nanostructure.40 Condensation of Prodan with PAs 1–4 yielded Prodan-containing PAs 5–8 (Scheme 1, Table 1). E2 PA was used as a non-fluorescent diluent PA in release experiments to ensure robust hydrogel formation. Diluent PAs such as E2 have also been used in other studies by our laboratory to space epitopes through co-assembly with bioactive PAs.26,27 E2 PA was coassembled with PAs 5–8 using a previously reported method.31
Table 1.
Structures of PAs 1–4 and 5–8
| PA number | Hydrazide PA | PA number | Prodan PAa |
|---|---|---|---|
| 1 | C16V2A2E2K(Hyd) | 5 | C16V2A2E2K(Hyd-Prodan) |
| 2 | C16V2A2K(Hyd)E2 | 6 | C16V2A2K(Hyd-Prodan)E2 |
| 3 | C16V2K(Hyd)A2E2 | 7 | C16V2K(Hyd-Prodan)A2E2 |
| 4 | C16K(Hyd)V2A2E2 | 8 | C16K(Hyd-Prodan)V2A2E2 |
Synthesized according to conditions given in Scheme 1 and purified by HPLC.
Scheme 1.

Condensation of Prodan with hydrazide-containing PA 1 to form Prodan PA 5. PAs 6, 7, and 8 were made using the same conditions from PAs 2, 3, and 4, respectively. Reagents and conditions: (i) DMSO/MeOH (1:1), AcOH, 40 °C, 8–16 h.
Cryogenic TEM and SAXS
PAs 5–8 were analyzed by cryogenic transmission electron microscopy (cryoTEM), with and without the addition of diluent PA E2. Figure 2 shows cryoTEM micrographs of PAs 5–8 with PA E2 and CaCl2 in non-gelling concentrations. Twisted structures were observed in all cases, with fiber widths ranging from 8 to 12 nm. As previously reported, one-dimensional, twisted nanostructures are typical of the C16V2A2E2 sequence.39 Samples of pure PAs 5–8 with CaCl2 also appear as flat ribbons (Figure S1). Analysis of similar solutions by SAXS provided a more precise comparison of nanostructural features. SAXS curves show slopes of -1 in the Guinier region for pure PAs 5–8 without CaCl2, indicative of cylindrical nanofiber morphologies (Figures S2 and S3 and Table S1). Addition of diluent PA E2 and gelling with CaCl2 leads the formation of twisted nanostructures, and SAXS scattering patterns whose analysis was beyond the scope of this manuscript (Figure S4). However, estimation of the cross sectional diameter of these structures can be made based on the position of the scattering curve minima (Table 2).41 The fibrous gel made with PA 5 exhibits the largest diameter (10.8 nm), while PAs 6 and 7 show similar sizes (both 10.5 nm), and PA 8 has the smallest dimension (10.4 nm). The cryoTEM and SAXS data indicate that one-dimensional aggregates are formed in all cases, with only slight differences in morphologies and dimensions among samples.
Fig 2.
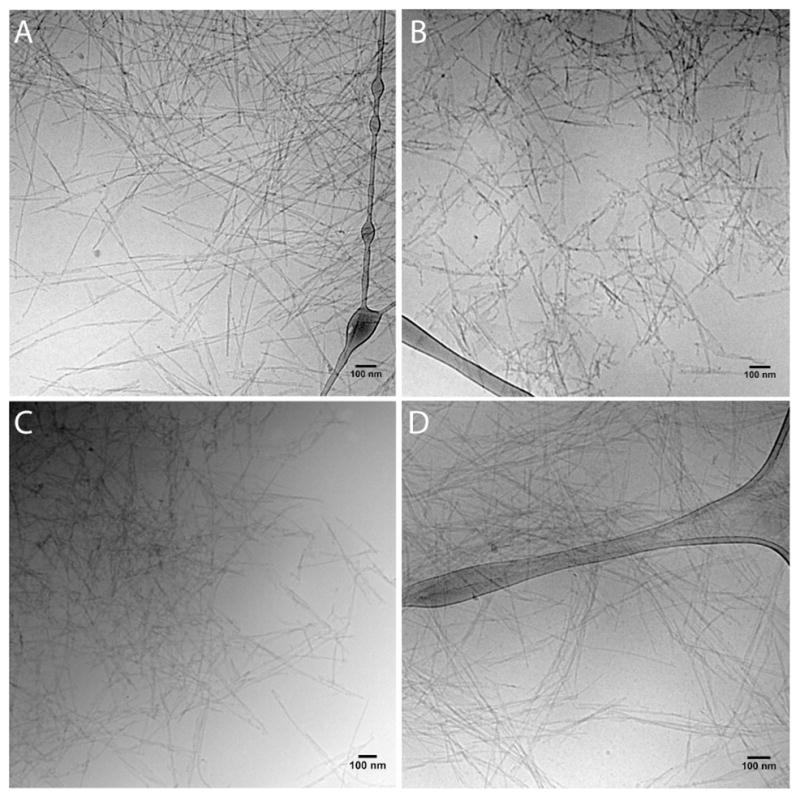
Cryogenic TEM of (A) PA 5, (B) PA 6, (C) PA 7, and (D) PA 8 as 1:3 mixtures with E2 PA.
Table 2.
Cross sectional diameter of gels of PAs 5–8 with diluent PA E2 (1:3 w/w).a
| PA | 5 | 6 | 7 | 8 |
| Diameter (nm) | 10.8 | 10.5 | 10.5 | 10.4 |
Determined by SAXS using Bessel function fitting of the scattering minima.
Prodan Release
Bound Prodan
The release of Prodan from gels of PAs 5–8 with a 3-fold excess of diluent PA E2 are shown in Figure 3. Though hydrazones are known to be acid sensitive, we chose to study release into a sink solution at neutral pH because we are interested in using PA gels to deliver drugs and signals in vivo under physiological conditions. Interestingly, the release curves did not show the expected relative rates. We expected that PA 5 would hydrolyze at the highest rate, as the hydrazone on the PA nanofiber surface should have the most solvent exposure. In contrast, we expected based on previous work37 that PA 8 would exhibit the slowest hydrolysis due to sequestration in the hydrophobic PA core. Release experiments were performed by exposing the gels to pH 7.4 phosphate buffer containing 5% DMSO. The buffer was replaced at each timepoint, and Prodan content was measured by fluorescence. DMSO was added to ensure that the low solubility of Prodan in water did not limit release. Experiments revealed that Prodan release from PA 8 was in fact the fastest and that release from PA 6 was the slowest. Applying zero-order release kinetics to the near-linear portion of the release curves gave t1/2 values ranging from 47 d in the case of PA 8 to nearly 70 d in the case of PA 6 (Table 3). We attribute the initial burst release (2–5% at the first time point) to a small amount of hydrolysis during workup after PA purification. After completion of the release studies, the balance of the initial Prodan mass in each PA gel was found to remain within the gel.
Fig. 3.

Release of Prodan from gels of PAs 5–8 with diluent PA E2 (1:3 w/w; 1 wt. % total PA) into a sink solution of 5% DMSO in pH 7.4 phosphate buffer (100 mM). Error bars represent standard deviation of the mean (n=5).
Table 3.
Release half-life data
Release of bound Prodan, which requires hydrazone hydrolysis and diffusion from the gel.
Release of unbound Prodan, which requires only diffusion from the gel.
We suspected that the deviation of the observed relative release rates from the expected trend might be a result of reduced order in the alkyl tail and β-sheet regions of the PA imparted by the long lysine-hydrazone-Prodan residues. Placement of the bulky branch near the PA core could disrupt the ideal packing of the nanostructure, as our group has previously observed.42 To test this idea we chose to remove the hydrolysis reaction from the release kinetics by following release of sequestered Prodan from PA gels using PAs 1–4.
Unbound Prodan
A modified version of the systems described above was designed by coassembling PAs 1–4 with diluent PA E2 and unbound Prodan. This would allow us to follow the single variable of Prodan diffusion from the gel (Figure 4). Each of PAs 1–4 was mixed in a 1:3 ratio with diluent PA E2, adding to the mixture the same amount of free Prodan as was present in the earlier release experiments. Release rate was measured in a similar manner to the previously described experiments on bound Prodan. Several interesting aspects of the release kinetics are observed (Table 3): first, release is 2.1 to 2.4 times faster when the step of hydrazone hydrolysis is excluded; second, the differences in rate are negligible for PAs 1–3, though diffusion from the gel containing PA 4 is somewhat faster than the others; and third, the variability among gels is greater in the case of unbound Prodan (larger error bars).
Fig. 4.

Release of Prodan from gels of PAs 5–8 with diluent PA E2 (1:3 w/w; 1 wt. % total PA) into a sink solution of 5% DMSO in pH 7.4 phosphate buffer (100 mM). Error bars represent standard deviation of the mean (n=5).
Taken together, the release profiles from bound and unbound Prodan indicate that positioning the bulky branch at the internal position in PAs 4 and 8 leads to faster diffusion of Prodan from the gel. When the derivatized lysine residue is placed further away from the hydrophobic tail (PAs 1–3), only minor differences in Prodan diffusion are observed, indicating that the rate of hydrazone hydrolysis plays a greater role in determining release rates in PAs 5, 6 and 7. It should be noted, however, that relative diffusion rates of unbound Prodan from PAs 1–4 do not match the trends in PAs 5–8. The Prodan group itself is likely to affect nanostructure packing differently than the free hydrazide. To further understand differences in release rates among PAs 5–8, we studied both sets of PAs by fluorescence spectroscopy, fluorescence anisotropy, and circular dichroism (CD).
Fluorescence Spectroscopy and Anisotropy
Bound Prodan
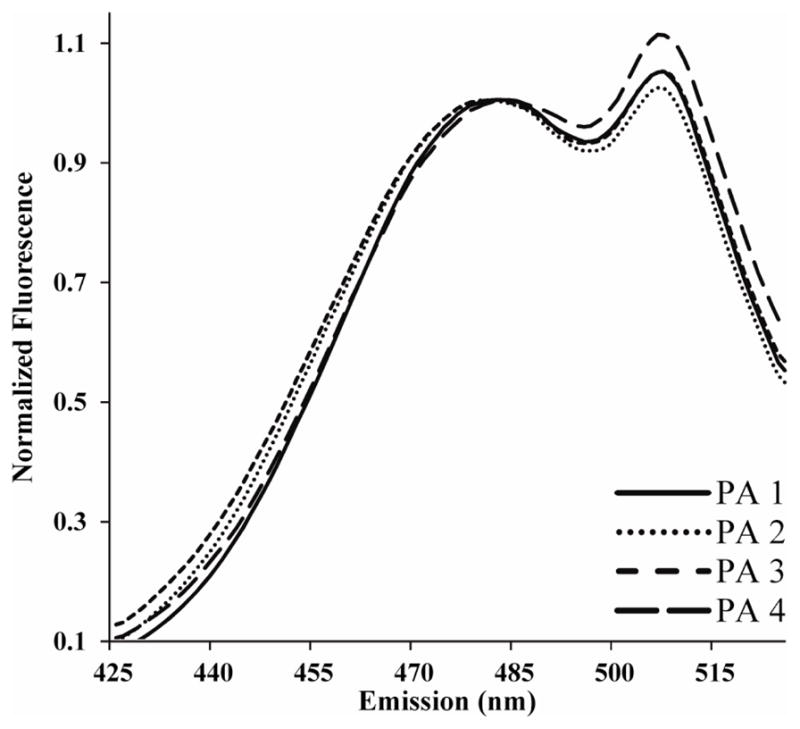
Prodan’s strong solvatochromism, first reported by Weber and Farris,43 has led to use of this molecule as a reporter in lipid bilayer membranes,44 proteins,45 and DNA46 due to the environmental dependence of its peak emission over the range from ~390 nm to ~520 nm.47 Solvatochromism has previously been used to probe the microenvironment in nanostructures,48 and we expected that the hydrophobicity of the environment surrounding the hydrazone bond might vary throughout the nanofiber structure. The solvatochromic effects of Prodan are well known—low dielectric environments lead to a blue-shifted peak emission relative to high dielectric environments.43 We anticipated that the fluorescence spectra of PAs 5–8 compared with known spectra of Prodan in lipid bilayer systems would allow us to investigate the local environment of the Prodan PAs.
For fluorescence spectroscopy experiments, Prodan PAs 5–8 were mixed with diluent PA E2 in a ratio of 1:3, as in the dye release experiments. As seen in Figure 5, only minor differences between the different PA mixtures are observed, with peak emissions ranging from 466 nm to 472 nm. This peak emission corresponds approximately to the dielectric constant of acetonitrile or to Prodan bound to the surface of bovine serum albumin47,49 (the shoulder at approximately 506 nm is due to a small amount of free Prodan that was released during sample preparation). Studies on Prodan partitioning in lipid bilayers show that Prodan generally resides near the interface of the charged phosphates and the hydrophobic tails due to the hydrogen-bonding capacity of the aniline group.50,51 The exact position of Prodan in the lipid bilayer, which determines its peak emission, is not dependent on the nature of the polar head group, but rather on the phase state of the bilayer.52 In gel-phase phospholipid bilayers, a shorter wavelength peak emission (~440 nm) is observed, while a longer wavelength peak emission (~490 nm) is observed in more ordered liquid-crystalline bilayers.53 This effect is explained by the tendency of Prodan to intercalate deeper into a more fluid gel phase bilayer while remaining closer to the hydrophilic surface of a highly ordered liquid crystalline bilayer.
Fig. 5.

Fluorescence spectroscopy (λex=350 nm) of Prodan PAs 5–8 mixed with diluent PA E2 (1:3) at 0.02 wt. % PA and 0.2 mM CaCl2. The shoulder at 506 nm is due to free Prodan as an artifact of sample preparation.
In our experiments, the peak emission is near 470 nm for all PAs (Table 4). This value falls between values typically observed for gel-core phospholipid membranes and liquid-crystalline phospholipid membranes. From these data we conclude that the covalently bound Prodan fluorophore in our PAs does not penetrate deeply into the hydrophobic PA nanofiber core. The order parameter of the alkyl segments may explain this observation, as previous studies from our group have observed internal order in PA cores.24,42 In an analogous fashion to lipid bilayers, this ordering in the hydrophobic segments of PAs may limit intercalation of Prodan into the hydrophobic space, forcing it to occupy the moderately hydrophobic β-sheet region of the PA nanofibers. Also, because PAs 5–8 have nearly identical emission spectra, it can be concluded that the Prodan fluorophores occupy similar environments in the PA nanostructure.
Table 4.
Fluorescence maxima of PAs 5–8a
| PA | 5 | 6 | 7 | 8 |
| λem max (nm) | 466 | 472 | 470 | 470 |
Determined from Figure 5 spectra.
Supporting the hypothesis that alkyl tail ordering limits Prodan penetration into the hydrophobic core are additional fluorescence experiments where the percentage of E2 PA and the overall concentration of the PA solution is varied (Figure S5). Here we find that PAs 5–8 without E2 PA show blue-shifted peak emissions (458–462 nm), indicative of a less ordered, more penetrable core. In contrast, increasing the total PA concentration to 0.1% (but maintaining a 1:3 ratio of Prodan PA to PA E2) shows a red-shift of the peak emissions to 475–477 nm and a narrowing of the spectra, suggesting increased core ordering.
Overall, the fluorescence emission peaks of PAs 5–8 did not explain their differences in release rates as we had expected. The slight differences in peak emission of PAs 5–8 are likely due to minor differences in the environment of the fluorophores near the alkyl tail-peptide boundary. As solvatochromism did not explain the observed differences in release rate, we turned to fluorescence anisotropy.
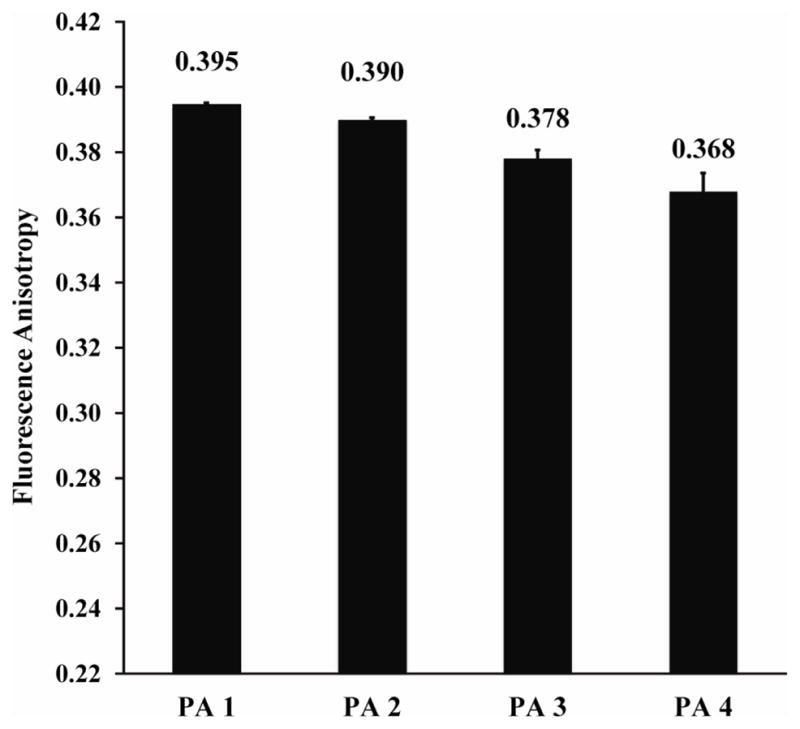
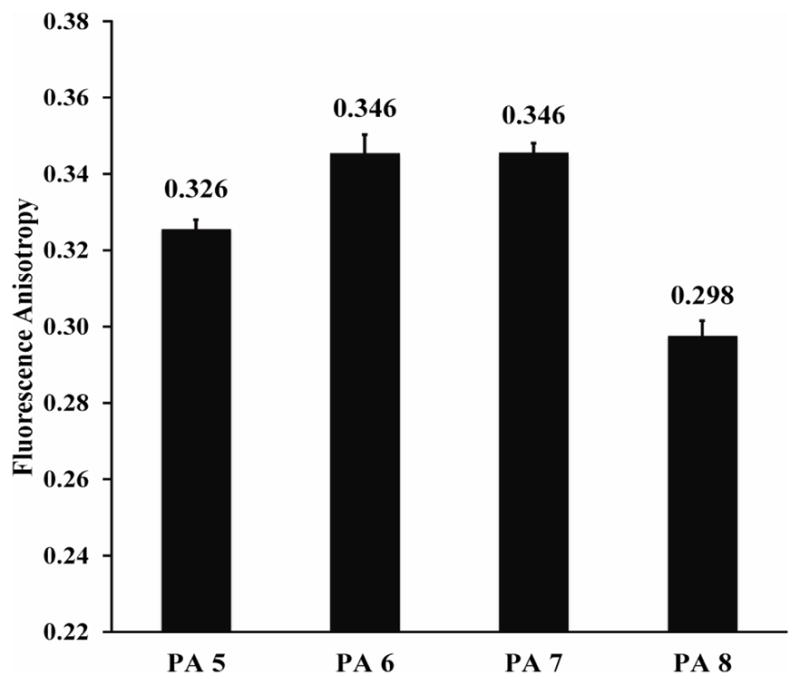
To measure the dynamics of the Prodan fluorophores in the PAs, fluorescence anisotropy experiments were performed. Fluorescence anisotropy is used to measure the mobility of a fluorophore, with higher values indicative of less mobile fluorophores, up to the theoretical limit of 0.40. A report on Laurdan (a Prodan derivative with a C12 alkyl tail instead of a C3 alkyl tail) in 1,2-dipalmitoyl-sn-glycero-3-[phosphor-rac-(1-glycerol)] (DPPG) lipid bilayers observed anisotropy values of ~0.28 in bilayers in the gel phase (below 41 °C) and ~0.08 for bilayers in the more mobile fluid phase (above 41 °C).54 In our experiments (1:3 Prodan PA/diluent PA; 0.02 wt. % total), fluorescence anisotropy values are quite high, ranging from 0.30 to 0.35. These values are substantially higher than those reported for Prodan tethered to proteins and polymers.55,56 We believe that the high fluorescence anisotropy values are due to the extreme length and rigidity of CaCl2-gelled PA nanofibers, which are expected to greatly limit rotation of the entire nanostructure on the fluorescence timescale, as previously suggested.57 Additionally, these fluorescence anisotropy data further support our conclusion that the Prodan fluorophores reside in the β-sheet region of the PA nanofiber—a constrained environment of moderate polarity. However, unlike the fluorescence spectroscopy data, differences among PAs 5–8 are apparent in this experiment. The fluorescence anisotropy value for PA 8 (0.298) is lower than the values for PAs 5–7 (0.33 to 0.35), indicating the fluorophore is more mobile in PA 8 than in the other PAs. This observation is consistent with the faster release kinetics of PA 8 compared with PAs 5–7. We speculate that the observed differences in the fluorescence anisotropy between PAs 5–8 are due to differences in the rotational mobility of the fluorophore within the PA nanofiber. This conclusion implies that PA 8 assembles into a less dense nanofiber (fewer PA molecules per unit cross-sectional area) than PAs 5–7, allowing for greatly mobility of the fluorophore within the nanostructure. The reason for the smaller increase in mobility of Prodan in PA 5 compared to PAs 6 and 7 may be due to reduced intrafiber Ca2+ bridges, as suggested by CD (see below).
Unbound Prodan
To determine the partitioning coefficient of Prodan in different PA nanostructures, fluorescence spectra of free Prodan in mixtures of PAs 1–4 with PA E2 were measured. The fluorescence spectra (Figure 7) each have two peaks—one for sequestered Prodan that is associated with the PA at approximately 480 nm and one at 506 nm corresponding to unsequestered Prodan in water. Spectra were taken as 1:3 mixtures with PA E2, adding the equivalent amount of Prodan as was present in PAs 5–8. Using the equation below adapted from Parasassi,51 we determined ratio of fluorescence (RF) values corresponding to the ratio between Prodan fluorescence in the PA and in water.
Fig. 7.
Fluorescence spectroscopy (λex=350 nm) of PAs 1–4 mixed with diluent PA E2 (1:3) at 0.02 wt. % PA and free Prodan equivalent to PAs 5–8 and 0.2 mM CaCl2. The peak at ~480 nm corresponds to sequestered Prodan while the peak at 506 nm is due to unassociated Prodan in water.
The equation considers the fluorescence intensity at the two maxima with corrections for peak overlap, and the equation parameters are defined as follows: FM is the sequestered faction, FW is the water fraction, Ipeak is the observed intensity at the sequestered Prodan peak (near 480 nm), I506 is the observed intensity at 506 nm, kw is the free Prodan constant (Ipeak/I506 for free Prodan in water) and km is the bound Prodan constant for each PA (I506/Ipeak for covalently bound Prodan). RF values for PAs 1–4 are shown in Figure 8, and their values mirror the release rates shown in Figure 4. These data indicate that Prodan release in the case of PAs 1–4 is a result of the partition coefficients of Prodan.
Fig. 8.

Ratio of fluorescence (RF) values of Prodan sequestered in mixtures of PAs 1–4 with diluent PA E2 (1:3 w/w). Higher values indicate greater partitioning of Prodan into the PA nanofibers vs. unassociated Prodan in water.
Fluorescence anisotropy values (Figure 9) were observed to be very high for PAs 1–4, nearing the theoretical limit. Values were on average 0.05 units higher for PAs 1–4 than for PAs 5–8, implying that fluorophore mobility is reduced when Prodan is not covalently bound to the PA. Reduced fluorophore mobility indicates that sequestered (not covalently bound) Prodan is capable of packing more efficiently into the PA nanofiber. PAs functionalized at the interior position (PA 4 and 8) also show decreased fluorescence anisotropy compared with the other PAs in each group, which is consistent with release data.
Fig. 9.
Fluorescence anisotropy of PAs 1–4 mixed with diluent PA E2 (1:3) and Prodan at 0.02 wt. % PA and free Prodan equivalent to PAs 5–8 and 0.2 mM CaCl2. λem = 350 nm, λex = 480 nm.
Circular Dichroism
Bound Prodan
In CD experiments, PAs 5–8 were mixed with PA E2 (in a 1:3 ratio at 0.05% total PA content) and gelled with CaCl2. CD traces were normalized to absorbance to eliminate small errors in concentration, and all PAs show β–sheet signatures in the peptide region (190–250 nm), as is typically observed for these PA systems (Figure 10). As in the fluorescence anisotropy experiments, CD absorption of PA 8 is different than PAs 5–7. PA 8 exhibits a less intense positive peak at 200 nm than PAs 5, 6 and 7, indicating a less ordered β–sheet structure.58,59 This conclusion is consistent with release data, signaling the presence of a less well-packed structure in PA 8 than in PAs 5–7. Previous studies from our group and from Hartgerink and co-workers have shown that the nature of the amino acid residue closest to the alkyl tail has a large effect on the ultimate properties of the nanostructure.59,60 Our observations here are consistent with these previous reports, as PA 8, the only PA without a V residue adjacent to the alkyl tail, has the least β-sheet character. The outermost E residues may also have an impact on β-sheet character. Addition of CaCl2 to PA nanofibers is thought to bridge negatively charged surface residues, reducing the Debye screening length of the molecules and allowing closer packing into nanofibers.61 In PA 5 the outermost placement of the long linker of the lysine-hydrazone-Prodan residue may restrict Ca2+ bridging and reduce the overall β-sheet character compared with PA 6, whose linker is placed inside the charged residue domain. This conclusion is supported by the observed results.
Fig. 10.

CD spectra of Prodan PAs 5–8 mixed with diluent PA E2 (1:3) at 0.05 wt.% PA and 0.5 mM CaCl2. All exhibit β-sheet character.
Unbound Prodan
CD was also performed on 1:3 mixtures of PAs 1–4 with diluent PA E2 in the same manner as was performed for the bound Prodan PAs. Prodan was added to the mixtures in an equivalent amount to that of PAs 5–8. CD traces (Figure 11) for PAs 1–4 were normalized to absorbance and show strong β-sheet signatures similar to PAs 5–8. Though the difference is less dramatic than in Figure 10, PA 4 exhibits slightly less β-sheet character than do PAs 1–3, indicated by the less intense maximum. PA 1 has the highest maximum, consistent with its slow release and high fluorescence anisotropy.
Fig. 11.

CD spectra of Prodan PAs 1–4 mixed with diluent PA E2 (1:3) at 0.05 wt.% PA and 0.5 mM CaCl2. All exhibit strong β-sheet character.
Most importantly, PAs 1–4 show substantially greater mean residue elipticity values than PAs 5–8, implying greater β-sheet character for PAs without bound Prodan. This is an expected result considering that packing is likely to be more constrained in the case of bound Prodan (PAs 5–8) than unbound Prodan (PAs 1–4). Removing the bulky Prodan group from the PA allows the hydrophilic hydrazide to position itself in a more hydrophilic environment, an effect we have observed previously.31 The mobility of the hydrazide and the linker permits increased order in the β-sheet-driven self-assembly of the PAs compared with the hydrophobic Prodan-hydrazone moiety. Unbound Prodan can presumably be sequestered into the available space, minimizing disruption of the ordered β-sheet hydrogen bonding motif.
Discussion
Combining the structural data from cryoTEM and SAXS with the fluorescence and CD data, we conclude that the packing density of the assembled nanofibers of PAs 5–8 is the most significant factor controlling release kinetics. The position of the lysine branch determines the density within the nanofiber by restricting ordering of the PA nanostructure in regions II and III. The packing density regulates the mobility of the fluorophore and the accessibility of the hydrazone to the solvent. Considering the conclusion that the Prodan component in each PA resides in a similar environment, we have generated space-filling models of the PAs that demonstrate their different shapes and their abilities to pack into nanofibers (Figure 12). Two components appear to determine the packing constraints in the PAs investigated here: 1) the availability of E residues to participate in intrafiber crosslinking with neighboring PA molecules; and 2) the conical shape of PA molecules.
Fig. 12.

Proposed structural models of PA packing arrangements. (Alkyl tail shown in gray, β-sheet region in blue, charged residues in red and lysine-hydrazone-Prodan group in green).
The effect of shielding of the E residues is most significant in PA 5. The charged residues of nanofiber region III are responsible for both intra- and interfiber crosslinking upon addition of CaCl2. In the case of PA 5, CD data indicate that the long lysine branch may restrict nanofiber packing. In contrast, the internal branch in PA 6 leaves the charged residues of region III free to interact with charged residues in neighboring PA molecules, leading to a more densely packed structure for PA 6 compared with PA 5.
The differences in the conical shape of the PA are most apparent in PAs 7 and 8. As the Prodan component does not penetrate the hydrophobic PA nanofiber core, a wider cone is generated in PA 8 than in PA 7. The wide cone in PA 8 likely limits the packing density in region I of the PA nanofiber. We believe that a balance of these two forces controlling packing—Ca2+ bridge-promoted intrafiber crosslinking of PA molecules and the distribution of steric bulk in the β-sheet region—determines the overall molecular density of the assembled PA nanostructures and the Prodan release rates.
Removing the covalent attachment of the bulky Prodan group and instead studying PAs 1–4 with free Prodan, we observe that release rates are approximately two-fold faster in the case of unbound Prodan. Additionally, the differences in release rate are much less pronounced. Only PA 4, with its branch directly adjacent to the hydrophobic tail, exhibits markedly different release kinetics from the others. Fluorescence data are consistent with this observation, and these combined data support the conclusion that the bulky Prodan fluorophore affects packing and therefore release rate when covalently bound to the PA.
Conclusions
Ketone-containing model drugs can be tethered to PAs via a hydrazone linkage, and hydrolysis of the hydrazones leads to controlled, sustained release of the drug into aqueous media at physiological pH. Release kinetics of PAs with the model drug Prodan bound at different sites in the PA nanostructure show that release rate increases with decreasing packing density, decreasing order in the hydrophobic PA core, and decreasing β-sheet character in the peptide. This study demonstrates the capacity to control drug release by exploiting supramolecular structure, which further expands the possibilities for peptide-based gels in regenerative medicine.
Experimental Section
Materials
Rink Amide MBHA resin and Fmoc-protected amino acids were purchased from Novabiochem Corporation or Anaspec Inc. Tri-Boc hydrazino adipic acid was prepared as previously reported.31 All other reagents and solvents were purchased from Aldrich or Novabiochem and used as received.
PA Synthesis
PAs 1–4 were synthesized manually using standing Fmoc solid-phase synthesis conditions. Coupling reactions were performed using Fmoc-amino acids (4 equiv), HBTU (3.95 equiv) and DIEA (6 equiv) in DMF (HBTU = 2-(1H-benzotriazole-1-yl)-1,1,3,3-tetramethyluronium hexafluorophosphate and DIEA = N,N-diisopropylethylamine). Free amines were generated on-resin by addition of an Fmoc-Lys(Mtt)-OH residue (Mtt = 4-methyltrityl) with selective removal of the Mtt protecting group using 4% TFA + 4% triisopropylsilane (TIPS) in CH2Cl2. Tri-Boc hydrazino adipic acid was added on resin to lysine ε-amines using HBTU and DIEA as above. N-terminal palmitic acid was added under the same conditions to form the hydrophobic PA tail. Following cleavage using a TFA/TIPS/H2O mixture (95:2.5:2.5), PAs 1–4 were purified by HPLC. Condensation of Prodan with PAs 1–4 was carried out in MeOH/DMSO (1:1) at 40 °C overnight using AcOH as a catalyst. Conversions were typically around 80–95%. HPLC purification of the reaction mixture yielded pure hydrazone-containing PAs 5–8.
Release Studies
Release studies for PAs 5–8 were performed by mixing stock solutions of each PA in hexafluoroisopropanol (HFIP) with E2 in HFIP (1:3 w/w). The solutions were lyophilized to afford PA mixtures as a white powder. PA gels were made by dissolving the lyophilized PA powders in 10 mM NaOH, dividing the solution into six 45 μL aliquots in 1.5 mL tubes, and gelling each with 5 μL CaCl2 solution (100 mM) to afford 1 wt.% gels. One gel from each group was dissolved using EDTA to measure initial Prodan content. After standing for 2 h to allow gels to set, a release solution containing 5% DMSO in phosphate buffer (1 mL; pH 7.4) was layered on top of the PA gel to simulate sink conditions. The release solution was removed completely at each time point, replaced with fresh buffer, and analyzed by fluorescence to determine the amount of Prodan released. To account for differences in peptide content each curve was normalized to the total amount of Prodan released over the course of the study by measuring total Prodan content in the gels after the release and comparing to initial Prodan content. Five gels of PAs 5–8 were averaged for the final release curves (Figure 3). Release studies for PAs 1–4 were performed in a similar manner, adding free Prodan equivalent to the amount present in PAs 5–8.
Instrumentation
Purification by preparative-scale HPLC was carried out on a Varian Prostar 210 HPLC system, eluting with of 2% ACN to 100% ACN in water on a Phenomenex C18 Gemini NX column (150 × 30 mm) with 5 μm pore size and 110Å particle size. 0.1% NH4OH was added to both mobile phases to aid PA solubility. Product-containing fractions were confirmed by ESI mass spectrometry (Agilent 6510 Q-TOF LC/MS), combined, and lyophilized after removing ACN by rotary evaporation.
CryoTEM was performed on a JEOL 1230 microscope with an accelerating voltage of 100 kV. A Vitrobot Mark IV equipped with controlled humidity and temperature was used for plunge freezing samples. A small volume (5–10 μL) of PA solution at 0.1–0.3% (w/v) in 2 mM NaOH with 1–3 mM CaCl2 was deposited on a copper TEM grid with holey carbon support film (Electron Microscopy Sciences) and held in place with tweezers mounted to the Vitrobot. The specimen was blotted in an environment with 90–100% humidity and plunged into a liquid ethane reservoir that was cooled by liquid nitrogen. The vitrified samples were transferred in a nitrogen environment into liquid nitrogen and transferred to a Gatan 626 cryo-holder using a cryo-transfer stage. Samples were imaged using a Gatan 831 bottom-mounted camera.
SAXS measurements were performed using beam line 5ID-D, in the DuPont-Northwestern-Dow Collaborative Access team (DND-CAT) Synchrotron Research Center at the Advanced Photon Source, Argonne National Laboratory. An energy of 15 keV corresponding to a wavelength λ=0.83 Å was selected using a double-crystal monochromator. The data were collected using a CCD detector (MAR) positioned 245 cm behind the sample. The scattering intensity was recorded in the interval 0.005 < q < 0.23 Å−1. The wave vector defined as q = (4π/λ) sin(θ/2), where θ is the scattering angle. Samples were analyzed in 1 mm quartz capillaries at 1.0% by weight in 10 mM NaOH with 10 mM CaCl2. The two-dimensional SAXS images were azimuthally averaged to produce one-dimensional profiles of intensity (I) vs q, using the two-dimensional data reduction program FIT2D. Scattering of a capillary containing only solvent was also collected and subtracted from the corresponding data. No attempt was made to convert the data to an absolute scale.
Fluorescence measurements were performed on an ISS PC1 photon counting steady-state fluorescence spectrometer equipped with a 300 W xenon arc lamp with power set to 18 A. Excitation slit widths of 1 mm (8 nm bandwidth) and emission slit widths of 0.5 mm (4 nm bandwidth) were used. Samples were prepared by dissolving PAs in 2 mM NaOH with CaCl2. Spectra (λex = 350 nm) were recorded, smoothed using the average method (width 3), and normalized to their maximum emission intensity in the bound Prodan region (460–485 nm). Fluorescence anisotropy measurements were performed on the same system with λex = 350 nm and λem = 480 nm according to the equation:
Where F|| is the intensity parallel to the excitation plane, F⊥ is the intensity perpendicular to the excitation plane, and g is the g-factor, which accounts for differences in emissions between the perpendicular and parallel gratings. Emission slit widths were 2 mm (16 nm bandwidth). Data shown are the average of three measurements.
CD data were obtained on a Jasco J-715 spectropolarimeter in the range of 190–300 nm and 315–415 nm (see Supporting Information). Samples were prepared as 0.05 wt. % solutions in 4 mM NaOH + 0.5 mM CaCl2 and taken in a 0.1 cm quartz cell for acquisitions in the 190–300 nm range. Samples were prepared as 0.025 wt. % solutions in 4 mM NaOH + 0.25 mM CaCl2 and taken in a 1 cm quartz cell in the 315–415 nm range. Data shown are the averages of three runs, normalized to peak absorbances at 196 nm or 345 nm.
Supplementary Material
Fig. 6.
Fluorescence anisotropy of PAs 5–8 mixed 1:3 (w/w) with diluent PA E2 at 0.02 wt.% + 0.2 mM CaCl2. λem = 350 nm, λex = 480 nm.
Acknowledgments
This work was supported by the National Institutes of Health through grants 2R01DE015920-06 from NIDCR and 2R01EB003806-06A2 from NIBIB. JBM was supported by a Baxter Early Career Development Award in Bioengineering and an NIH postdoctoral fellowship. We are grateful to the following experimental facilities at Northwestern University: the Peptide Synthesis Core in the Institute for BioNanotechnology in Medicine (IBNAM), the Biological Imaging Facility (BIF), the Integrated Molecular Structure Education and Research Center (IMSERC), and the Keck Biophysics Facility. We acknowledge Dr Steven Weigand and the DuPont-Northwestern-Dow Collaborative Access Team (DND-CAT) Synchrotron Research Center at the Advanced Photon Source (APS) at Argonne National Lab for assistance with SAXS measurements. Use of the APS was supported by the U.S. Department of Energy, Office of Science, Office of Basic Energy Sciences, under Contract No. DE-AC02-06CH11357. We are grateful to Dr Liam Palmer for helpful discussions and Mark Seniw for illustrations.
Footnotes
Electronic Supplementary Information (ESI) available: [Full experimental details, characterization data on new compounds, additional cryoTEM and fluorescence data, SAXS curves and fittings]. See DOI: 10.1039/b000000x/
Notes and references
- 1.Peppas NA, Bures P, Leobandung W, Ichikawa H. Eur J Pharm Biopharm. 2000;50:27–46. doi: 10.1016/s0939-6411(00)00090-4. [DOI] [PubMed] [Google Scholar]
- 2.LaVan DA, McGuire T, Langer R. Nat Biotechnol. 2003;21:1184–1191. doi: 10.1038/nbt876. [DOI] [PubMed] [Google Scholar]
- 3.Peppas NA, Hilt JZ, Khademhosseini A, Langer R. Adv Mater. 2006;18:1345–1360. [Google Scholar]
- 4.Sangeetha NM, Maitra U. Chem Soc Rev. 2005;34:821–836. doi: 10.1039/b417081b. [DOI] [PubMed] [Google Scholar]
- 5.Estroff LA, Hamilton AD. Chem Rev. 2004;104:1201–1217. doi: 10.1021/cr0302049. [DOI] [PubMed] [Google Scholar]
- 6.Matson JB, Stupp SI. Chem Commun. 2012;48:26–33. doi: 10.1039/c1cc15551b. [DOI] [PMC free article] [PubMed] [Google Scholar]
- 7.Harrington DA, Cheng EY, Guler MO, Lee LK, Donovan JL, Claussen RC, Stupp SI. J Biomed Mater Res, Part A. 2006;78A:157–167. doi: 10.1002/jbm.a.30718. [DOI] [PubMed] [Google Scholar]
- 8.Sargeant TD, Guler MO, Oppenheimer SM, Mata A, Satcher RL, Dunand DC, Stupp SI. Biomaterials. 2008;29:161–171. doi: 10.1016/j.biomaterials.2007.09.012. [DOI] [PubMed] [Google Scholar]
- 9.Haines-Butterick L, Rajagopal K, Branco M, Salick D, Rughani R, Pilarz M, Lamm MS, Pochan DJ, Schneider JP. Proc Natl Acad Sci U S A. 2007;104:7791–7796. doi: 10.1073/pnas.0701980104. [DOI] [PMC free article] [PubMed] [Google Scholar]
- 10.Rajangam K, Behanna HA, Hui MJ, Han XQ, Hulvat JF, Lomasney JW, Stupp SI. Nano Lett. 2006;6:2086–2090. doi: 10.1021/nl0613555. [DOI] [PubMed] [Google Scholar]
- 11.Branco MC, Schneider JP. Acta Biomater. 2009;5:817–831. doi: 10.1016/j.actbio.2008.09.018. [DOI] [PMC free article] [PubMed] [Google Scholar]
- 12.Pashuck ET, Cui HG, Stupp SI. J Am Chem Soc. 2010;132:6041–6046. doi: 10.1021/ja908560n. [DOI] [PMC free article] [PubMed] [Google Scholar]
- 13.Palmer LC, Stupp SI. Acc Chem Res. 2008;41:1674–1684. doi: 10.1021/ar8000926. [DOI] [PMC free article] [PubMed] [Google Scholar]
- 14.Yu YC, Berndt P, Tirrell M, Fields GB. J Am Chem Soc. 1996;118:12515–12520. [Google Scholar]
- 15.Cui HG, Webber MJ, Stupp SI. Biopolymers. 2010;94:1–18. doi: 10.1002/bip.21328. [DOI] [PMC free article] [PubMed] [Google Scholar]
- 16.Tysseling-Mattiace VM, Sahni V, Niece KL, Birch D, Czeisler C, Fehlings MG, Stupp SI, Kessler JA. J Neurosci. 2008;28:3814–3823. doi: 10.1523/JNEUROSCI.0143-08.2008. [DOI] [PMC free article] [PubMed] [Google Scholar]
- 17.Webber MJ, Han XQ, Murthy SNP, Rajangam K, Stupp SI, Lomasney JW. J Tissue Eng Regen M. 2010;4:600–610. doi: 10.1002/term.273. [DOI] [PMC free article] [PubMed] [Google Scholar]
- 18.Webber MJ, Tongers J, Newcomb CJ, Marquardt KT, Bauersachs J, Losordo DW, Stupp SI. Proc Natl Acad Sci U S A. 2011;108:13438–13443. doi: 10.1073/pnas.1016546108. [DOI] [PMC free article] [PubMed] [Google Scholar]
- 19.Mata A, Geng YB, Henrikson KJ, Aparicio C, Stock SR, Satcher RL, Stupp SI. Biomaterials. 2010;31:6004–6012. doi: 10.1016/j.biomaterials.2010.04.013. [DOI] [PMC free article] [PubMed] [Google Scholar]
- 20.Shah RN, Shah NA, Lim MMD, Hsieh C, Nuber G, Stupp SI. Proc Natl Acad Sci U S A. 2010;107:3293–3298. doi: 10.1073/pnas.0906501107. [DOI] [PMC free article] [PubMed] [Google Scholar]
- 21.Huang Z, Newcomb CJ, Bringas P, Jr, Stupp SI, Snead ML. Biomaterials. 2010;31:9202–9211. doi: 10.1016/j.biomaterials.2010.08.013. [DOI] [PMC free article] [PubMed] [Google Scholar]
- 22.Standley SM, Toft DJ, Cheng H, Soukasene S, Chen J, Raja SM, Band V, Band H, Cryns VL, Stupp SI. Cancer Res. 2010;70:3020–3026. doi: 10.1158/0008-5472.CAN-09-3267. [DOI] [PMC free article] [PubMed] [Google Scholar]
- 23.Hartgerink JD, Beniash E, Stupp SI. Science. 2001;294:1684–1688. doi: 10.1126/science.1063187. [DOI] [PubMed] [Google Scholar]
- 24.Jiang HZ, Guler MO, Stupp SI. Soft Matter. 2007;3:454–462. doi: 10.1039/b614426h. [DOI] [PubMed] [Google Scholar]
- 25.Silva GA, Czeisler C, Niece KL, Beniash E, Harrington DA, Kessler JA, Stupp SI. Science. 2004;303:1352–1355. doi: 10.1126/science.1093783. [DOI] [PubMed] [Google Scholar]
- 26.Storrie H, Guler MO, Abu-Amara SN, Volberg T, Rao M, Geiger B, Stupp SI. Biomaterials. 2007;28:4608–4618. doi: 10.1016/j.biomaterials.2007.06.026. [DOI] [PubMed] [Google Scholar]
- 27.Webber MJ, Tongers J, Renault MA, Roncalli JG, Losordo DW, Stupp SI. Acta Biomater. 2010;6:3–11. doi: 10.1016/j.actbio.2009.07.031. [DOI] [PMC free article] [PubMed] [Google Scholar]
- 28.Gelain F, Unsworth LD, Zhang SG. J Controlled Release. 2010;145:231–239. doi: 10.1016/j.jconrel.2010.04.026. [DOI] [PubMed] [Google Scholar]
- 29.Branco MC, Pochan DJ, Wagner NJ, Schneider JP. Biomaterials. 2010;31:9527–9534. doi: 10.1016/j.biomaterials.2010.08.047. [DOI] [PMC free article] [PubMed] [Google Scholar]
- 30.Koutsopoulos S, Unsworth LD, Nagaia Y, Zhang SG. Proc Natl Acad Sci U S A. 2009;106:4623–4628. doi: 10.1073/pnas.0807506106. [DOI] [PMC free article] [PubMed] [Google Scholar]
- 31.Matson JB, Stupp SI. Chem Commun. 2011;47:7962–7964. doi: 10.1039/c1cc12570b. [DOI] [PMC free article] [PubMed] [Google Scholar]
- 32.Kapadia MR, Chow LW, Tsihlis ND, Ahanchi SS, Hrabie JA, Murar J, Martinez J, Popowich DA, Jiang Q, Saavedra JE, Keefer LK, Hulvat JF, Stupp SI, Kibbe MP. J Vasc Surg. 2008;47:173–182. doi: 10.1016/j.jvs.2007.09.005. [DOI] [PMC free article] [PubMed] [Google Scholar]
- 33.West KR, Otto S. Curr Drug Discov Technol. 2005;2:123–160. doi: 10.2174/1570163054866882. [DOI] [PubMed] [Google Scholar]
- 34.Wu AM, Senter PD. Nat Biotechnol. 2005;23:1137–1146. doi: 10.1038/nbt1141. [DOI] [PubMed] [Google Scholar]
- 35.Haag R, Kratz F. Angew Chem-Int Edit. 2006;45:1198–1215. doi: 10.1002/anie.200502113. [DOI] [PubMed] [Google Scholar]
- 36.Gillies ER, Jonsson TB, Frechet JMJ. J Am Chem Soc. 2004;126:11936–11943. doi: 10.1021/ja0463738. [DOI] [PubMed] [Google Scholar]
- 37.Tovar JD, Claussen RC, Stupp SI. J Am Chem Soc. 2005;127:7337–7345. doi: 10.1021/ja043764d. [DOI] [PubMed] [Google Scholar]
- 38.Lee OS, Stupp SI, Schatz GC. J Am Chem Soc. 2011;133:3677–3683. doi: 10.1021/ja110966y. [DOI] [PubMed] [Google Scholar]
- 39.Goldberger JE, Berns EJ, Bitton R, Newcomb CJ, Stupp SI. Angew Chem Int Ed. 2011;50:6292–6295. doi: 10.1002/anie.201100202. [DOI] [PMC free article] [PubMed] [Google Scholar]
- 40.Mennucci B, Caricato M, Ingrosso F, Cappelli C, Cammi R, Tomasi J, Scalmani G, Frisch MJ. J Phys Chem B. 2008;112:414–423. doi: 10.1021/jp076138m. [DOI] [PubMed] [Google Scholar]
- 41.Bang J, Jain SM, Li ZB, Lodge TP, Pedersen JS, Kesselman E, Talmon Y. Macromolecules. 2006;39:1199–1208. [Google Scholar]
- 42.Hsu L, Cvetanovich GL, Stupp SI. J Am Chem Soc. 2008;130:3892–3899. doi: 10.1021/ja076553s. [DOI] [PMC free article] [PubMed] [Google Scholar]
- 43.Weber G, Farris FJ. Biochemistry. 1979;18:3075–3078. doi: 10.1021/bi00581a025. [DOI] [PubMed] [Google Scholar]
- 44.Demchenko AP, Mely Y, Duportail G, Klymchenko AS. Biophys J. 2009;96:3461–3470. doi: 10.1016/j.bpj.2009.02.012. [DOI] [PMC free article] [PubMed] [Google Scholar]
- 45.Cohen BE, McAnaney TB, Park ES, Jan YN, Boxer SG, Jan LY. Science. 2002;296:1700–1703. doi: 10.1126/science.1069346. [DOI] [PubMed] [Google Scholar]
- 46.Kimura T, Kawai K, Majima T. Chem Commun. 2006:1542–1544. doi: 10.1039/b600026f. [DOI] [PubMed] [Google Scholar]
- 47.Kucherak OA, Didier P, Mely Y, Klymchenko AS. J Phys Chem Lett. 2010;1:616–620. [Google Scholar]
- 48.Hawker CJ, Wooley KL, Frechet JMJ. J Am Chem Soc. 1993;115:4375–4376. [Google Scholar]
- 49.Haskard CA, Li-Chan ECY. J Agric Food Chem. 1998;46:2671–2677. [Google Scholar]
- 50.Krasnowska EK, Gratton E, Parasassi T. Biophys J. 1998;74:1984–1993. doi: 10.1016/S0006-3495(98)77905-6. [DOI] [PMC free article] [PubMed] [Google Scholar]
- 51.Krasnowska EK, Bagatolli LA, Gratton E, Parasassi T. Biochim Biophys Acta-Biomembr. 2001;1511:330–340. doi: 10.1016/s0005-2736(01)00286-3. [DOI] [PubMed] [Google Scholar]
- 52.Parasassi T, De Stasio G, Ravagnan G, Rusch RM, Gratton E. Biophys J. 1991;60:179–189. doi: 10.1016/S0006-3495(91)82041-0. [DOI] [PMC free article] [PubMed] [Google Scholar]
- 53.Parasassi T, Krasnowska EK, Bagatolli L, Gratton E. J Fluoresc. 1998;8:365–373. [Google Scholar]
- 54.De Vequi-Suplicy CC, Benatti CR, Lamy MT. J Fluoresc. 2006;16:431–439. doi: 10.1007/s10895-005-0059-3. [DOI] [PubMed] [Google Scholar]
- 55.Thouvenin M, Linossier I, Sire O, Peron JJ, Vallee-Rehel K. Macromolecules. 2002;35:489–498. [Google Scholar]
- 56.Moreno F, Cortijo M, Gonzalez-Jimenez J. Photochem Photobiol. 1999;69:8–15. [PubMed] [Google Scholar]
- 57.Guler MO, Hsu L, Soukasene S, Harrington DA, Hulvat JF, Stupp SI. Biomacromolecules. 2006;7:1855–1863. doi: 10.1021/bm060161g. [DOI] [PMC free article] [PubMed] [Google Scholar]
- 58.Behanna HA, Rajangam K, Stupp SI. J Am Chem Soc. 2007;129:321–327. doi: 10.1021/ja062415b. [DOI] [PubMed] [Google Scholar]
- 59.Paramonov SE, Jun HW, Hartgerink JD. J Am Chem Soc. 2006;128:7291–7298. doi: 10.1021/ja060573x. [DOI] [PubMed] [Google Scholar]
- 60.Muraoka T, Cui H, Stupp SI. J Am Chem Soc. 2008;130:2946–2947. doi: 10.1021/ja711213s. [DOI] [PubMed] [Google Scholar]
- 61.Greenfield MA, Hoffman JR, de la Cruz MO, Stupp SI. Langmuir. 2010;26:3641–3647. doi: 10.1021/la9030969. [DOI] [PubMed] [Google Scholar]
Associated Data
This section collects any data citations, data availability statements, or supplementary materials included in this article.