Abstract
Purpose.
To compare follistatin (FST) and activin (Act) expression in normal and glaucomatous trabecular meshwork (TM) cells and tissues and determine if exogenous TGF-β2 regulates the expression of FST and Act in TM cells.
Methods.
Total RNA was isolated from TM cell strains, and mRNA expression for FST 317/344 isoforms and Act was determined via RT-PCR and quantitative PCR (qPCR). Western immunoblotting and immunocytochemistry determined FST and Act A protein levels in normal TM (NTM) and glaucomatous TM (GTM) cells. Cells were treated with recombinant human TGF-β2 protein at 0 to 10 ng/mL for 0 to 72 hours. qPCR, Western immunoblotting, immunocytochemistry, and ELISA immunoassay were utilized to determine changes in FST and Act A mRNA and protein levels. In addition, NTM and GTM tissue samples were examined by immunohistochemistry for expression of FST, FST 315, FST 288, and Act A.
Results.
Both FST mRNA and protein levels were significantly elevated in GTM cells. FST mRNA transcripts FST 317/344 were also significantly elevated in GTM cells. Immunohistochemistry showed FST levels were significantly elevated in GTM tissues. Exogenous TGF-β2 significantly induced FST mRNA and protein expression. Immunohistochemistry demonstrated that Act A protein levels were significantly higher in NTM tissues compared to GTM tissues.
Conclusions.
FST is elevated in GTM cells and tissues. FST is known to be an inhibitor of bone morphogenetic proteins (BMPs), which, coupled with the ability of TGF-β2 to upregulate FST levels, may indicate a possible role of FST in the pathogenesis of glaucoma. These results suggest that additional endogenous molecules in human TM may regulate TGF-β2 signaling via inhibition of BMP family members.
This study identifies the expression of TGF-β/BMP signaling molecules in the TM.
Introduction
Glaucoma is a group of progressive optic neuropathies affecting approximately 1% of the population worldwide.1–3 POAG, the most prevalent form of glaucoma, results in irreversible blindness and is estimated to affect more than 60 million people.2 Important risk factors for POAG include age, race, and elevated IOP. Elevated IOP results from increased resistance of aqueous humor (AH) outflow through the trabecular meshwork (TM) due to excess accumulation of extracellular matrix (ECM) proteins.4–6
TGF-β2 is the most abundant TGF-β isoform in the eye.7,8 A number of studies have reported elevated levels of TGF-β2 (2–5ng/mL) in the AH of patients with POAG.7,9–11,51 Endogenous TGF-β2 levels are elevated in both cultured glaucomatous TM (GTM) cell stains and GTM tissues.12,48,49 In other tissues, TGF-β signaling has been shown to mediate fibrotic changes, including increased ECM protein deposition.13–15 Our laboratory and others have suggested a similar role for TGF-β2 in the TM, reporting increased synthesis and secretion of ECM proteins and a potential role for ECM deposition in POAG.16–19 In addition, TGF-β2 treatment of cultured human TM cells induces cross-linking of fibronectin via induction of tissue transglutaminase.20,21,50 We have also recently reported that TGF-β2 simulates the synthesis and secretion of lysyl oxidases, enzymes that also cross-link ECM collagen and elastin fibers.22 In the human anterior segment organ culture model, perfusion with TGF-β2 promotes a focal accumulation of fine fibrillar extracellular material in the TM, increased fibronectin levels, and elevated IOP. 23–25 In addition, intraocular injection of a viral vector encoding bioactive TGF-β2 induced ocular hypertension in rats and mice and significantly decreased AH outflow facility in the mouse.25
Our laboratory has previously reported that TM cells express several members of the bone morphogenetic protein (BMP) family, including BMP ligands (BMP2, BMP4, BMP5, and BMP7), receptors (BMPR1a, BMPR1b, and BMPR2), and BMP antagonists gremlin, noggin, and follistatin.26–28 BMPs elicit multiple functions in a variety of ocular tissues28 and other cell types.29,30 For example, BMP4 and BMP7 blocked TGF-β2 induction of a variety of ECM proteins, including fibronectin-1, collagens IV and VI, TSP-1, and PAI-1.19,31 BMP antagonists tightly regulate BMP cellular activity by either binding directly to BMP ligands or to the type I BMP receptor.32–34 We reported greater levels of the BMP antagonist gremlin in GTM cells and tissues.19 In addition, gremlin antagonizes BMP4 inhibition of TGF-β2–induced cellular ECM proteins FN and PAI-1 and elevates IOP in perfusion-cultured human anterior segment.19 We have proposed that gremlin potentiates the profibrotic effects of TGF-β2 in the TM by blocking BMP4 regulation of TGF-β2 activity.19 However, whether gremlin is the only mediator that blocks BMP activity in the TM is currently unknown, and the role(s) of other potential BMP antagonists in the TM has not been reported.
Follistatin (FST) is also a secreted BMP antagonist whose mRNA expression has been previously reported in TM cells.26 FST was first identified as a follicle-stimulating hormone inhibiting molecule present in ovarian follicle fluid. It has since been shown to be a multifactorial regulatory protein that exerts a majority of its effects by neutralization of activin (Act) molecules or by inhibition of BMPs.35–38 FST and Act are usually coexpressed, and FST is known to bind and inhibit Act with high affinity.
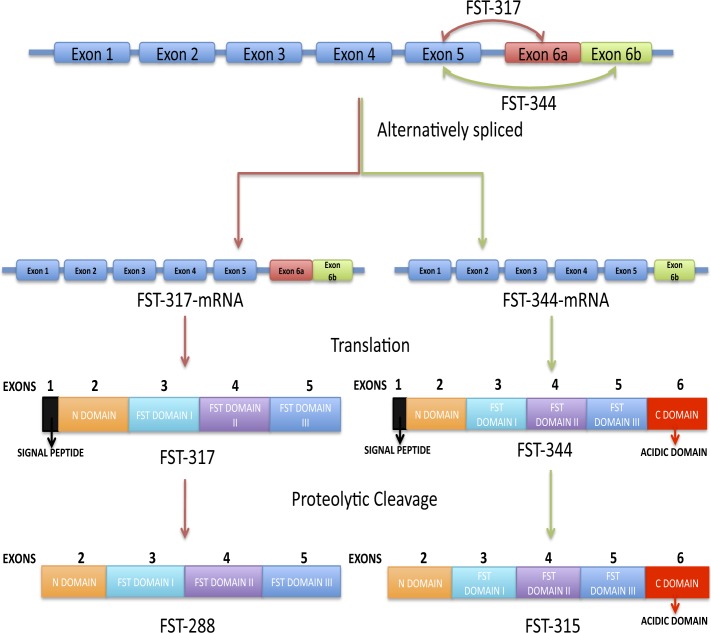
The primary FST transcript undergoes alternative splicing to produce mRNAs (FST 317/344) that encode two FST proteins, FST 288 and FST 315 (Fig. 1).39,40 The FST 315 isoform is encoded by all six exons, whereas the FST 288 isoform lacks expression of exon 6, which encodes the acidic C-terminal tail. Both isoforms contain the heparin-binding sequence (HBS) of basic residues, which is essential for binding to cell-surface heparin-sulfated proteoglycans.41–43 It has been proposed that the acidic tail in FST 315 interacts with the basic residues within the HBS, thereby suppressing the cell-surface binding activity of FST 315.44 These biochemical distinctions suggest that each isoform may be responsible for different subsets of biological activities, depending on their degree of cell-surface localization and subsequent compartmentalization within tissues. The finding that FST 315 is the predominant circulating FST isoform in human serum supports this concept.45
Figure 1. .
Schematic representation of nuclear and protein processing of the follistatin (FST) gene, including alternative splicing and posttranslational modification. The human FST gene is composed of six exons alternatively spliced to produce FST 317 and FST 344 mRNA transcripts. These mRNA transcripts are then translated into preproteins FST 317 (translated from FST 317 mRNA) and FST 344 (translated from FST 344 mRNA). Preproteins FST 317 and FST 344 signal peptides are cleaved, yielding FST active forms FST 288 and FST 315, respectively. FST 288 and FST 315 can undergo further proteolytic cleavage and glycosylation. Both active proteins contain an N-domain, FST I, II, and III domains, and an additional C-domain (acidic tail) in FST 315. Figure modified from Lin SY, Morrison JR, Phillips DJ, de Kretser DM. Regulation of ovarian function by the TGF-beta superfamily and follistatin. Reproduction. 2003;126:133–148. Copyright 2003 Society for Reproduction and Fertility. Reproduced by permission.
The biological activities as well as the underlying mechanisms for FST and Act involvement in the TM have not been explored. The purpose of this study was to (1) assess FST and Act expression in NTM and GTM cells and tissues and (2) determine whether exogenous TGF-β2 regulates the expression of FST in cultured NTM and GTM cells. A better understanding of the role of BMP antagonists in human TM may identify potential therapeutic targets for the treatment of glaucoma.
Methods
Trabecular Meshwork Cell Culture
Well-characterized, primary human TM cell strains were obtained from Alcon Research, Ltd. (Fort Worth, TX) as previously reported.12,21,22,24–26,46 Human TM cells were grown in Dulbecco's Modified Eagle's Medium (DMEM) (low glucose) supplemented with 10% fetal bovine serum (HyClone Labs, Logan, UT), L-glutamine (0.292 mg/mL), penicillin (100 units/mL), streptomycin (0.1 mg/mL), and amphotericin B (4 mg/mL). Antibiotics were purchased from Gibco BRL (Grand Island, NY). Cells were maintained at 37°C in 5% CO2, 95% air, and fresh medium was exchanged every 2 to 3 days. No evidence of cellular senescence was observed.
When the cells were 80 to 90% confluent, they were washed with serum-free DMEM and cultured in serum-free DMEM for 24 hours. They were then treated with or without recombinant TGF-β2 protein (#302-B2; R&D Systems, Minneapolis, MN) at selected concentrations (0, 1, 2.5, 5.0, 7.5, and 10 ng/mL) for 6, 12, 24, 48, or 72 hours.
RNA Extraction and PCR
RNA was isolated using TRI reagent RT (MRC, Inc., Cincinnati, OH), and cDNA was synthesized using a Superscript c-DNA kit (Invitrogen, Grand Island, NY). PCR primers were designed using Primer 3 software (http://frodo.wi.mit.edu/) (Table 1) and were obtained from Sigma-Aldrich (St. Louis, MO). RT-PCR reactions were run in a PTC-100 thermal cycler (MJ Research, Inc., Ramsey, MN) for 28 to 35 cycles. PCR amplified products were run on 1% agarose gels and analyzed with the Fluorchem 8900 UVP system (Alpha Innotech, Logan, UT).
Table 1. .
PCR Primers
|
Gene Name |
Primer Pair |
Product Size, bp |
| Follistatin | ctctgccagttcatggagga | 107 |
| tccttgctcagttcggtctt | ||
| Activin A | tctcctgggcaagaagaaga | 195 |
| atgttgaccttgccatcaca | ||
| Activin B | tgaaactcctgccctacgtc | 208 |
| tgcacgtctaggttgagtcg | ||
| Activin C | ggagctgcttcttgatctgg | 165 |
| tcctgttccctgttgtcctc | ||
| Activin E | caatgtggtcaagacggatg | 202 |
| tcccataggggtcaagtgag | ||
| Beta-actin | cctgtacggtccactgctta | 350 |
| tggacttgcatccaggttca |
Primers for FST 317 and FST 344 mRNA analysis are tagged with TaqMan probes provided in the TaqMan gene expression assays. Specific primer sequences are not applicable.
In addition, quantitative PCR (qPCR) was performed as previously described,26 using PCR primers (Table 1). Briefly, 2.5 μL of cDNA was used in a reaction consisting of 1.5 units of antibody-bound Taq enzyme (Jump Start; Sigma-Aldrich), 10× PCR buffer, 1.5 mM MgCl2, 200 nM dNTP mix, 100 nM PCR primers (Table 1), 2.5 μL green nucleic acid dye (EvaGreen; Biotium, Hayward, CA), as well as 30 nM passive reference dye (Rox; USB, Cleveland, OH) per 50-μL reaction. PCR was performed on a real-time thermal cycler (model Mx3000p; Stratagene, La Jolla, CA), with cycling parameters of initial denaturation at 95°C; 40 cycles of 95°C for 30 seconds, 60°C for 30 seconds, and 72°C for 60 seconds, and a denaturation cycle for creation of a dissociation curve. Reactions for each sample and gene of interest were run in duplicate, cycle thresholds were normalized to β-actin expression as a housekeeping gene, and comparative quantitation was performed using MxPro version 4.0 software (Stratagene). PCR samples with single-peak dissociation curves were selected for data analysis. TaqMan gene expression probes were used to analyze the presence of FST 317 and FST 344 in TM cells. TaqMan gene expression assays (Applied BioSystems, Carlsbad, CA) were used according to the manufacturer's instructions.
Enzyme-Linked Immunosorbent Assay (ELISA) Testing
Briefly, cells were placed in serum-free DMEM for 24 hours, followed by treatment with or without TGF-β2 at 2.5 ng/mL for 48 hours. Conditioned medium was collected from primary TM cells and centrifuged at 2000 rpm for 5 minutes to remove cellular debris. FST secretion was quantified using a commercially available ELISA kit (#DFN00; R&D Systems) as directed by the manufacturer's instructions. Quantification of FST was measured using a SpectraMax 340PC (Molecular Devices, Sunnyvale, CA). Data were plotted and analyzed using Graph-Pad Prism 5.
Protein Extraction and Western Blot Analysis
Total cellular protein was isolated from cultured TM cells using either (1) M-PER extraction buffer (#78501; Pierce Biotech, Rockford, IL) and Protease Inhibitor Cocktail (#78415; Pierce Biotech) or (2) Laemmli sample buffer (#161-0737; Bio-Rad, Hercules, CA) containing 5% beta-mercaptoethanol. Protein concentrations were determined using the Bio-Rad Dc protein assay system according to the manufacturer's instructions (Bio-Rad) or the EZQ protein quantitation kit according to the manufacturer's instructions (#R33200; Molecular Probes, Grand Island, NY).
A total of 60 μg of protein was loaded per well and separated by denaturing SDS–polyacrylamide gel electrophoresis and then transferred by electrophoresis to polyvinylidene difluoride (PVDF) membranes. The PVDF membranes were incubated in 5% milk in Tris Buffered Saline Tween (TBST; 20mM Tris, 0.5M NaCl, and 0.05% Tween 20, pH 7.4) for 60 minutes in order to block nonspecific binding. Blots were processed using primary antibodies and appropriate secondary antibodies (Table 2). The Super Signal West Femto Maximus sensitivity substrate (#34095; Pierce Biotech) was used for detection of proteins, and blots were exposed in a Fluorchem 8900 Imager (Alpha Innotech, San Leandro, CA).
Table 2. .
Antibodies
|
Antibody (catalog no.) |
IHC |
Western Blot |
Source |
| Follistatin (AF669) | 1:7 | 1:500 | R&D Systems |
| Follistatin (ab64490) | … | 1:500 | Abcam (Cambridge, MA) |
| Follistatin 288 (mca4736ga) | 1:100 | … | AbD Serotec |
| Follistatin 315 (mca4735ga) | 1:100 | … | AbD Serotec |
| Activin A (NB110-61019) | 1:50 | … | Novus Biological (St. Charles, MO) |
| Beta-actin (MAB1501) | … | 1:1,000 | Millipore (Billerica, MA) |
| Donkey anti-goat Alexa-568 (A11011) | 1:200 | … | Molecular Probes |
| Donkey anti-rabbit Alexa-488 (A21206) | 1:200 | … | Molecular Probes |
| Goat anti-mouse FITC-488 (STAR70) | 1:100 | … | AbD Serotec |
| Mouse IgG (I-2000) | 1:100 | … | Vector Labs (Burlingame, MA) |
| Rabbit IgG (I-1000) | 1:50 | … | Vector Labs |
| Goat IgG (I-5000) | 1:7 | … | Vector Labs |
| Donkey anti-goat (sc-2020) | … | 1:10,000 | Santa Cruz Biotechnology (Santa Cruz, CA) |
| Goat anti-mouse (sc-2005) | … | 1:10,000 | Santa Cruz Biotechnology |
| Goat anti-rabbit (32460) | … | 1:10,000 | Thermo Scientific (Pittsburgh, PA) |
IHC, immunohistochemistry.
Immunohistochemistry of TM Tissues
Three pairs of normal human eyes (ages 79, 80, and 82 years) and three pairs of glaucoma age-matched eyes (ages 79, 80, and 82 years) were used to demonstrate the presence of full-length FST, FST 288, FST 315, and Act A proteins in TM tissues. Paraffin sections were deparaffinized, rehydrated, and placed in 0.1% Trition-X100 or citrate buffer (pH 6) for antigen retrieval, followed by 20 mM glycine for 15 minutes. Sections were blocked in 10% normal serum. Subsequently, primary antibodies for FST 288, FST 315, full-length FST, and Act A were incubated at 4°C overnight. Secondary staining was performed for 1 hour at room temperature with either goat anti-mouse IgG FITC antibody (AbD Serotec, Raleigh, NC), or goat anti-rabbit Alexa 568 conjugated secondary antibody (Molecular Probes). Antibodies used and respective dilutions are provided in Table 2. Visualization of cell nuclei was performed by staining tissue sections with DAPI (300 nM) for 10 minutes. Images were captured using a Zeiss 510 confocal microscope (Carl Zeiss, Thornwood, NY) or an Eclipse Ti-U microscope (Nikon, Melville, NY) containing the Nuance FX imaging system (CRI, Burlington, MA). Analysis of staining intensity was performed using Image J software (NIH, Bethesda, MD). Two images were quantified per sample, and no primary antibody controls were used for background subtraction. The background was subtracted based on the primary controls corresponding to each sample. The area extending from Schlemm's canal to the uveal scleral layer of the TM was used for quantification.
Immunocytochemistry of TM Cells
Primary human TM cells were grown on glass coverslips in 24-well plates. At 90% confluence, cells were fixed with 3.5% formaldehyde (Fisher Scientific, Pittsburgh, PA) in 1× PBS for 20 minutes. Cells were treated with 0.2% Triton X-100 in PBS for 20 minutes. Cells were then blocked for 1 hour with 5% normal blocking serum in 1× PBS. Cells were then incubated with primary antibodies overnight at 4°C. The next day, cells were washed three times with 1× PBS solution and then incubated with secondary antibodies in 1% BSA\PBS at a 1:200 dilution for 1 hour at room temperature. To visualize nuclei, cells were treated with DAPI (300 nM) nuclear stain for 10 minutes and coverslips were mounted using Aqua-Mount (Lerner Laboratories, Pittsburgh, PA). Slides were stored in the dark at 4°C until visualized with a Nikon Eclipse Ti-U microscope containing the Nuance FX imaging system (CRI).
Statistical Analysis
For comparison of statistical difference between two groups, Student's t-test was performed. One-way ANOVA was used for comparison of results between more than two groups. Statistical significance was evaluated with P values less than or equal to 0.05.
Results
FST mRNA Expression in NTM and GTM Cells
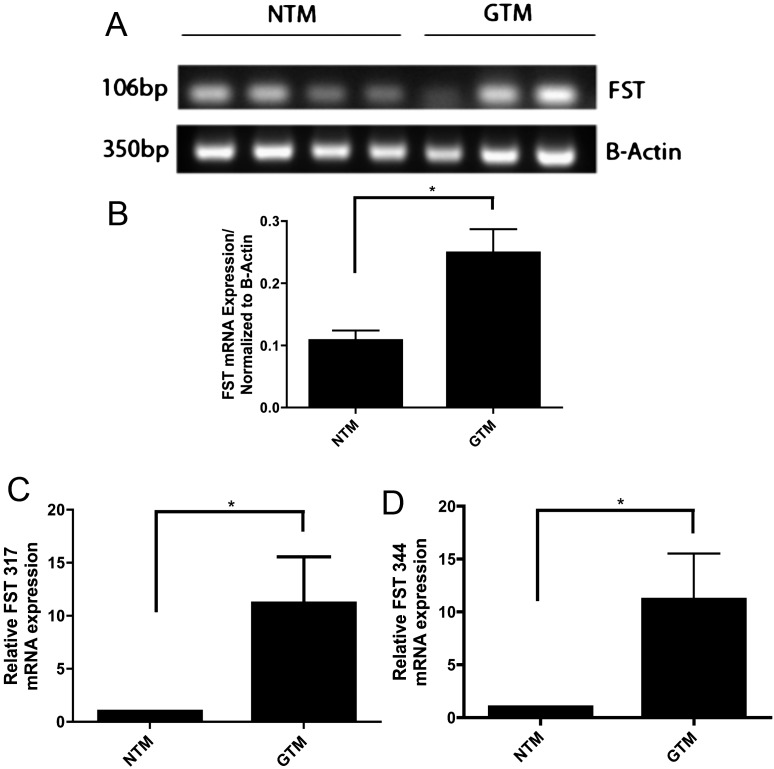
Four NTM and three GTM cell strains were examined for the presence of FST mRNA by RT-PCR (Fig. 2A). FST was expressed in all seven TM cell strains, and densitometry showed that total FST mRNA expression was significantly higher in GTM cells compared to NTM cells (Fig. 2B; P < 0.05).
Figure 2. .
Follistatin mRNA is present in NTM and GTM cell strains. (A) Ethidium bromide–stained agarose gel of RT-PCR amplified products for FST and actin from cultured NTM and GTM cells. (B) Densitometric analysis of FST mRNA expression. Expression was significantly higher in GTM as compared to NTM cells (*P < 0.05; n = 7). (C–D) FST 317 and FST 344 isoforms are expressed in NTM and GTM cells. (C) TaqMan qPCR products of FST 317 normalized to actin showed expression in NTM and GTM cells. FST 317 expression in GTM cells was significantly higher than in NTM cells (*P < 0.05; n = 10) (D) TaqMan qPCR products of FST 344 normalized to actin showed expression in NTM and GTM cells. FST 344 expression in GTM cells was significantly higher than in NTM cells (*P < 0.05; n = 10).
Specific FST 317 and FST 344 PCR assays by qPCR were used to further analyze FST isoform expression in TM cells. mRNA expression of each cell strain was normalized to its β-actin control. Both FST 317 (Fig. 2C) and FST 344 (Fig. 2D) mRNAs were expressed in both NTM and GTM cells. The expression of each isoform was greater in GTM in comparison to NTM cells (P < 0.05).
FST Protein Expression in NTM and GTM Cells
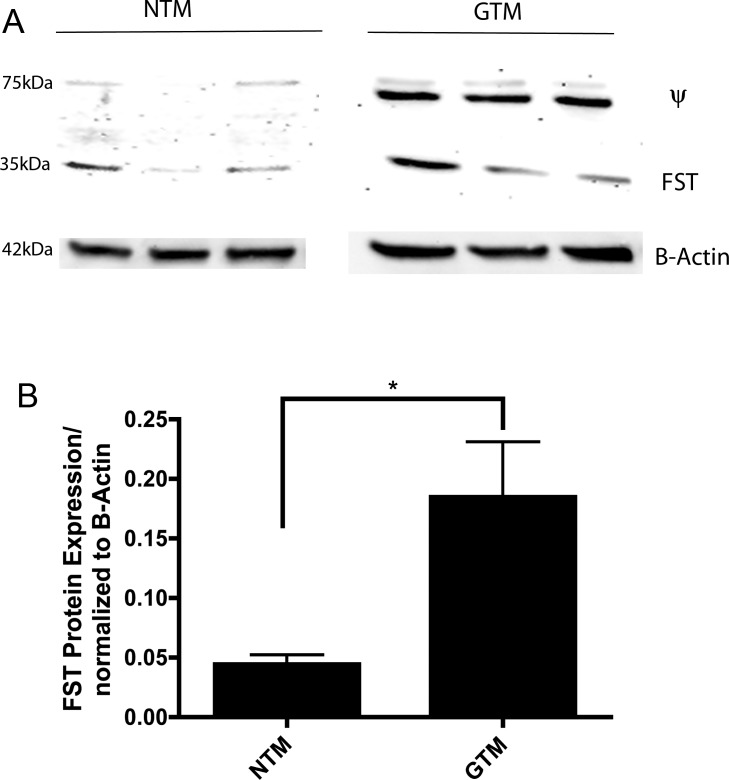
Western immunoblotting analyses confirmed FST protein expression with a band of 35 kDa in primary cultured NTM (n = 3) and GTM (n = 3) cells (Fig. 3A). A nonspecific 75 kDa band (Ψ), as reported by the manufacturer, was apparent. Densitometry analyses of FST protein levels demonstrated significantly more expression of FST protein in GTM cells as compared to NTM cells (Fig. 3B; P < 0.05). Positive controls were used to confirm specific binding of an FST antibody to FST isoforms (data not shown).
Figure 3. .
Follistatin protein is present in NTM and GTM cells. (A) Western immunoblot of cellular FST protein in TM cells with bands at 35 kDa. A nonspecific 75-kDa band (Ψ) was apparent. (B) FST protein expression normalized to actin was measured by densitometry. FST expression was significantly higher in GTM cells. (*P < 0.05; n = 4).
FST Expression in NTM and GTM Tissues
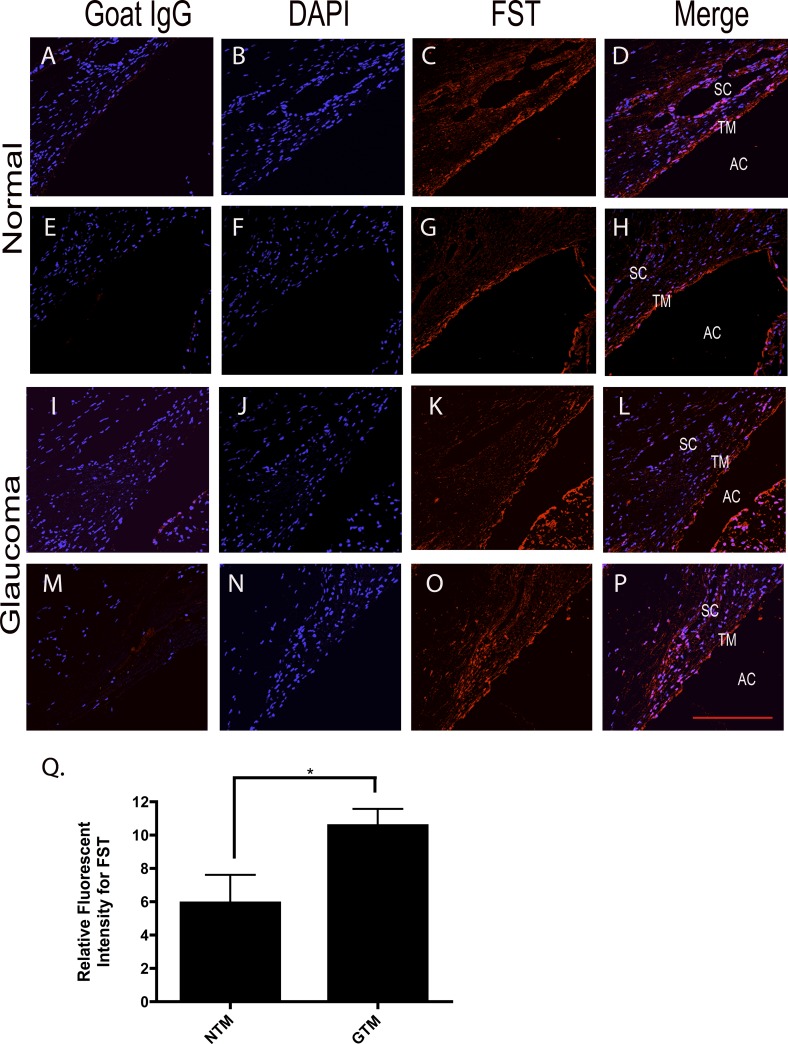
Representative images of FST expression in human TM tissues were taken from three normal and three glaucoma age-matched donor eyes. All sections were stained with DAPI to visualize nuclei. FST was expressed in NTM (Figs. 4C, 4G) and GTM (Figs. 4K, 4O) tissues. FST expression was dispersed throughout the TM with more intense staining in the uveal region of the TM. Image J software (NIH) was used to quantify staining intensity in order to evaluate the difference in expression of FST in NTM versus GTM tissues. FST expression levels were significantly higher (P < 0.05) in GTM tissues as compared to NTM tissues (Fig. 4Q). No primary antibody or goat IgG (Figs. 4A, 4E, 4I, 4M) were used as negative controls, and rat testes were used as a positive control for FST staining (data not shown).
Figure 4. .
Immunohistochemical staining of FST expression in NTM and GTM tissues. Representative images (200×) of FST expression in the TM from six age-matched normal and glaucomatous ocular tissues. Negative goat IgG control (A, E, I, M). DAPI stained nuclei (B, F, J, N). FST expression in NTM (C, G) and GTM (K, O) tissues. FST staining merged with DAPI in normal TM (D, H) and glaucomatous (L, P) TM tissues. (Q) Relative intensity measurements of FST in six age-matched NTM and GTM tissues. FST expression was significantly greater in GTM tissues (*P < 0.05; n = 6). Scale bar = 100 μm.
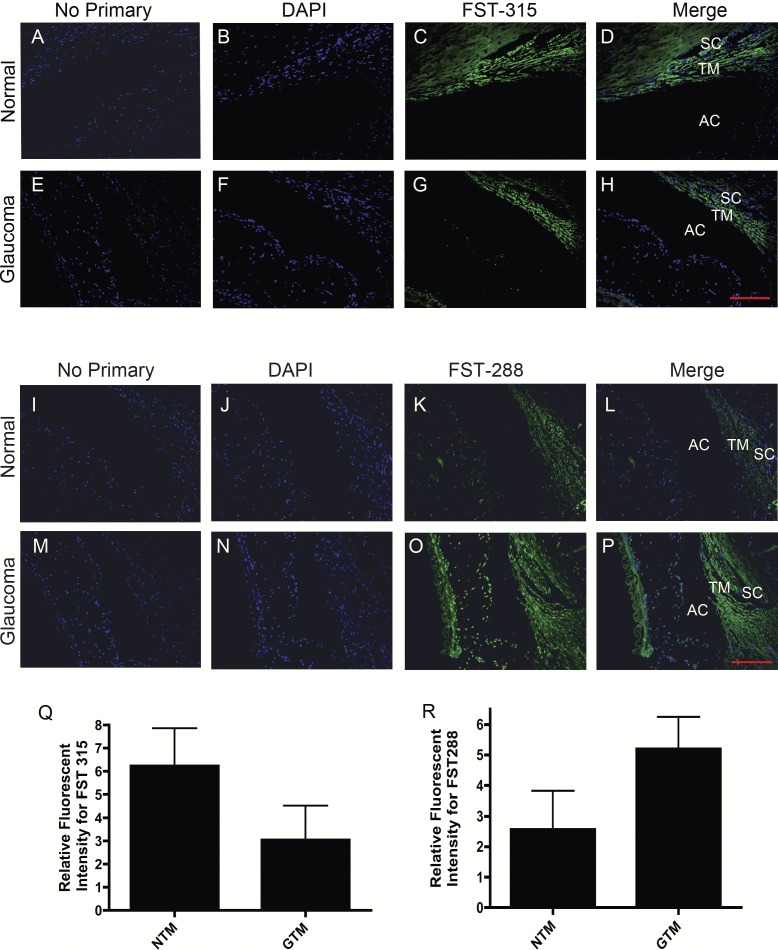
We next wanted to assess the expression of specific FST isoforms in TM tissues. Two normal and two glaucomatous age-matched samples were subjected to immunohistochemical staining using antibodies specific for FST 288 and FST 315. FST 315 expression appeared to be greater in NTM tissues (Fig. 5C) as compared to GTM tissue (Fig. 5G), although when quantified by imaging the difference was not statistically significant (Fig. 5Q). FST 288 was also present in NTM tissue (Fig. 5K) but appeared to have greater expression in GTM tissue (Fig. 5O). In contrast to FST 315 results, FST 288 protein levels appeared higher in GTM tissue compared to NTM tissue (Fig. 5R), but this difference was not statistically significant.
Figure 5. .
Representative images (200×) of immunohistochemical staining for FST 315 and FST 288 proteins in four age-matched NTM and GTM tissues. No primary control (A, E, I, M). DAPI stained nuclei (B, F, J, N). FST 315 expression in NTM (C) and GTM (G) tissues. FST 288 expression in NTM (K) and GTM (O) tissues. FST 315 and FST 288 staining merged with DAPI in NTM (D, L) and GTM (L, P) TM tissues. Relative intensity measurements of FST 315 in four age-matched NTM and GTM tissues (Q). Relative intensity measurements of FST 288 in four age-matched NTM and GTM tissues (R). The relative differences in staining intensities between NTM and GTM were not statistically significant. Scale bar = 100 μm.
TGF-β2 Induction of FST in TM cells
We previously have shown that there is cross-talk between TGF-β and BMP signaling pathways in TM cells19 and that TGF-β2 increases the expression of the BMP antagonist gremlin.47 To evaluate the effects of TGF-β2 on FST expression, we treated NTM and GTM cells with or without TGF-β2 (2.5 ng/mL) for 48 hours, and mRNA levels of FST 317 and FST 344 were subsequently quantified by qPCR. There was a significant increase of FST 317 (P < 0.01) (Fig. 6A) and FST 344 (P < 0.05) (Fig. 6B) expression following exogenous TGF-β2 treatment.
Figure 6. .
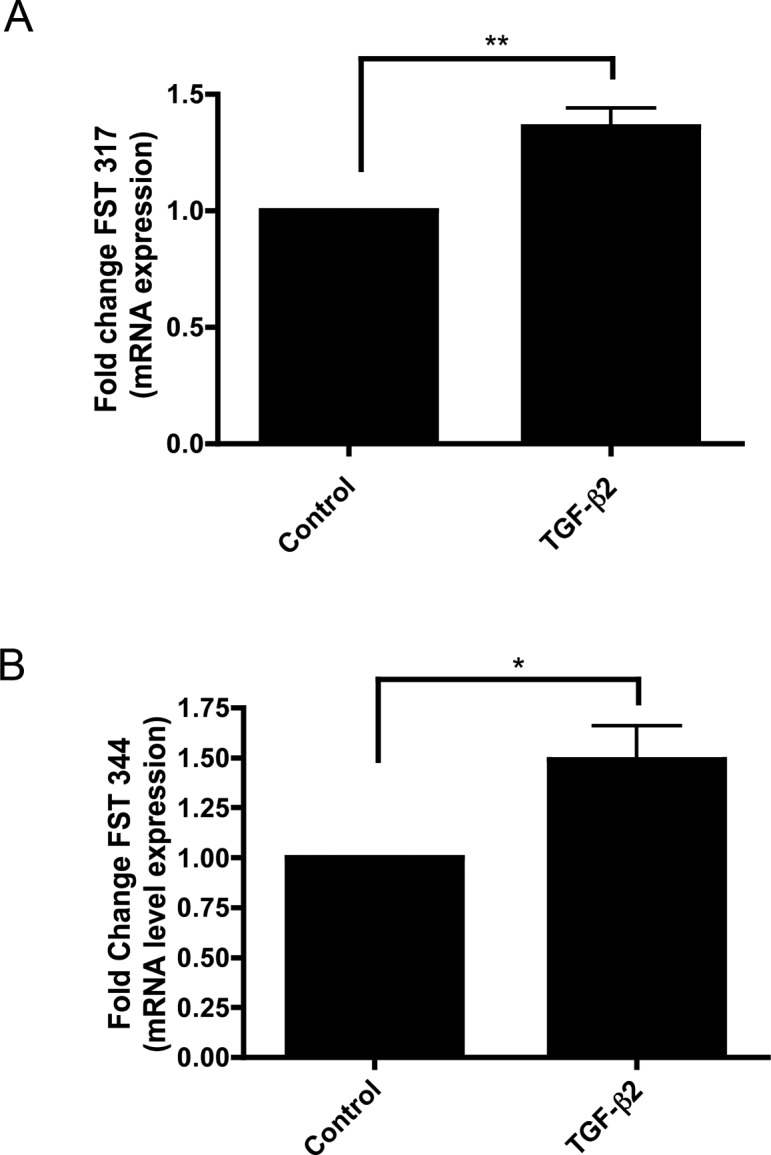
TGF-β2 stimulates FST 317 and FST 344 mRNA expression in cultured primary TM cells. (A) FST 317 mRNA is significantly increased in primary cultured TM cells upon TGF-β2 (2.5 ng/mL) treatment (**P < 0.01; n = 5). (B) FST 344 mRNA is significantly increased in primary cultured TM cells upon TGF-β2 (2.5 ng/mL) treatment (*P < 0.05 ; n = 5).
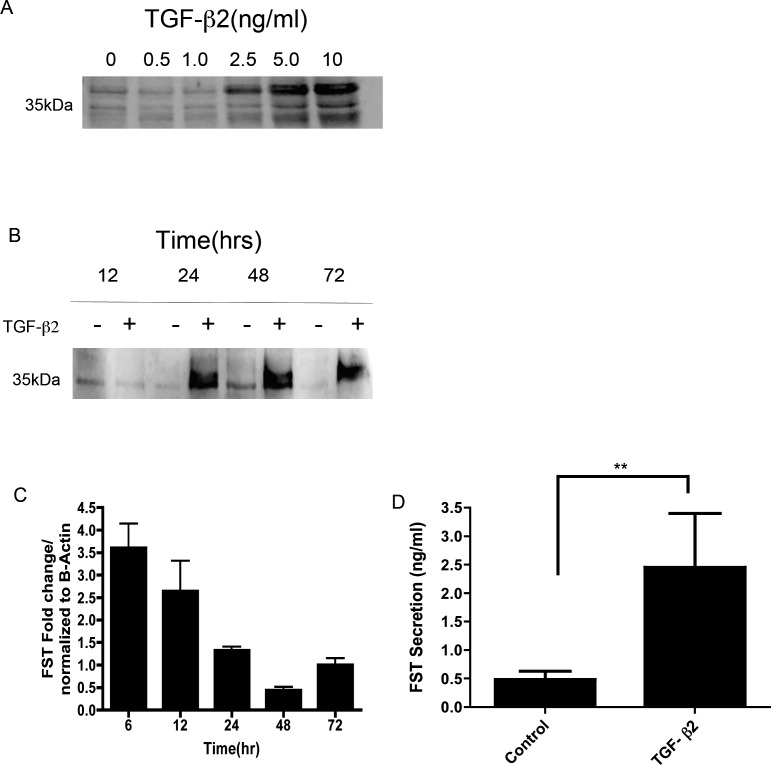
To further evaluate whether TGF-β2 could modulate FST protein expression in TM cells, we treated TM cells with varying concentrations of TGF-β2 (0–10 ng/mL) at different time points (0–72 hours). Representative immunoblots of conditioned medium showed a dose-dependent increase of FST secretion (Fig. 7A) and a time-dependent increase of FST secretion (Fig. 7B). qPCR analysis also showed a TGF-β2 mediated increase in FST expression, peaking at 6 hours (Fig. 7C). FST ELISA results confirmed increased FST secretion by TM cells after TGF-β2 treatment (P < 0.05) (Fig. 7D). These results demonstrated that exogenous TGF-β2 increased FST mRNA expression and FST protein secretion in both a time- and dose-dependent manner in TM cells.
Figure 7. .
TGF-β2 dose- and time-dependent increases in FST mRNA and protein expression in cultured TM cells. (A) Representative Western immunoblot images of TM cell conditioned medium. TM cells treated with varying concentrations (0.5, 1.0, 2.5, 5.0, or 10 ng/mL) of human recombinant TGF-β2 for 24 hours (n = 3). (B) TM cells treated with or without 2.5 ng/mL of TGF-β2 for 12, 24, 48, and 72 hours (n = 5). (C) qPCR amplified products of TM cells treated with and without 2.5 ng/mL of TGF-β2 for 6, 12, 24, 48, and 72 hours. FST mRNA expression was normalized to actin and compared to the zero time control (n = 3). (D) Effects of TGF-β2 (0 and 2.5 ng/mL for 48 hours) on FST secretion measured by ELISA in six different human TM cell lines (**P < 0.01; n = 6).
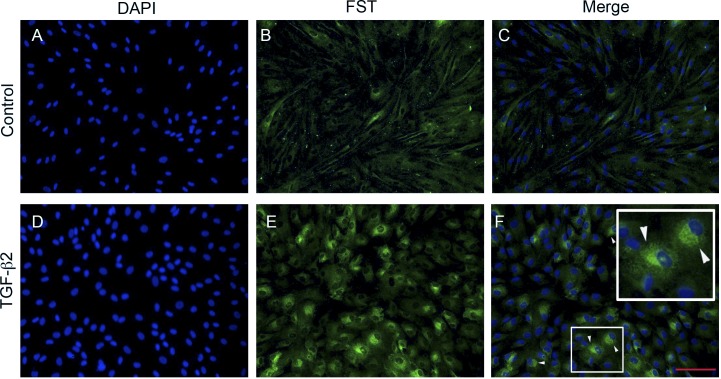
We also examined the immunocytochemical localization of FST following TGF-β2 treatment using an antibody that recognizes all isoforms of FST (Fig. 8). There was low expression of FST in untreated control TM cells (Fig. 8B). Treatment with TGF-β2 (5 ng/mL) for 48 hours markedly upregulated FST protein levels (Fig. 8E). This increased FST protein expression was localized in the perinuclear region (Fig. 8F), suggesting increased synthesis of FST within the secretory pathway as a result of TGF-β2 treatment.
Figure 8. .
TGF-β2 induces FST protein expression in primary cultured primary TM cells assessed by immunostaining. DAPI staining of nuclei (A, D). FST staining in human TM cells treated without (B) or with (E) TGF-β2 (5 ng/mL) for 48 hours. Merge of FST staining and DAPI in control (C) and TGF-β2–treated cells. (F) FST staining was increased in the perinuclear region (arrowheads) in the TM cells. Scale bar = 100 μm.
Act mRNA Expression in Human TM Cells
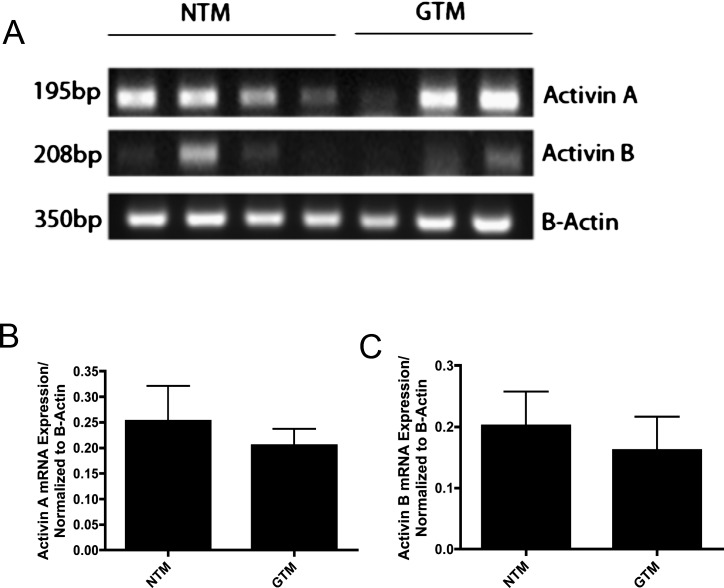
We evaluated the mRNA expression of Acts using seven TM cells strains (four NTM and three GTM). Act A and Act B were expressed in most of the NTM and GTM cell strains (Fig. 9). Act A expression appeared to be greater than that of Act B in both cell types (Fig. 9A). mRNA expression of each cell strain was normalized to its β-actin control. Densitometry of RT-PCR amplified products showed no statistically significant differences in the expression of Act A (Fig. 9B) or Act B (Fig. 9C) in NTM versus GTM cells. Act C and Act E mRNA was not expressed in NTM or GTM cell strains. Commercially available human normal liver tissue was used as a positive control (data not shown).
Figure 9. .
Act A and Act B mRNA expression in cultured NTM and GTM cells. (A) Ethidium bromide–stained gel of RT-PCR amplified products for Act A and B, and actin from cultured NTM (n = 4) and GTM (n = 3) cells. (B) Act A mRNA expression in NTM versus GTM was not significantly different. (C) Act B mRNA expression in NTM versus GTM was not significantly different.
Act A Protein Expression in NTM and GTM Tissues
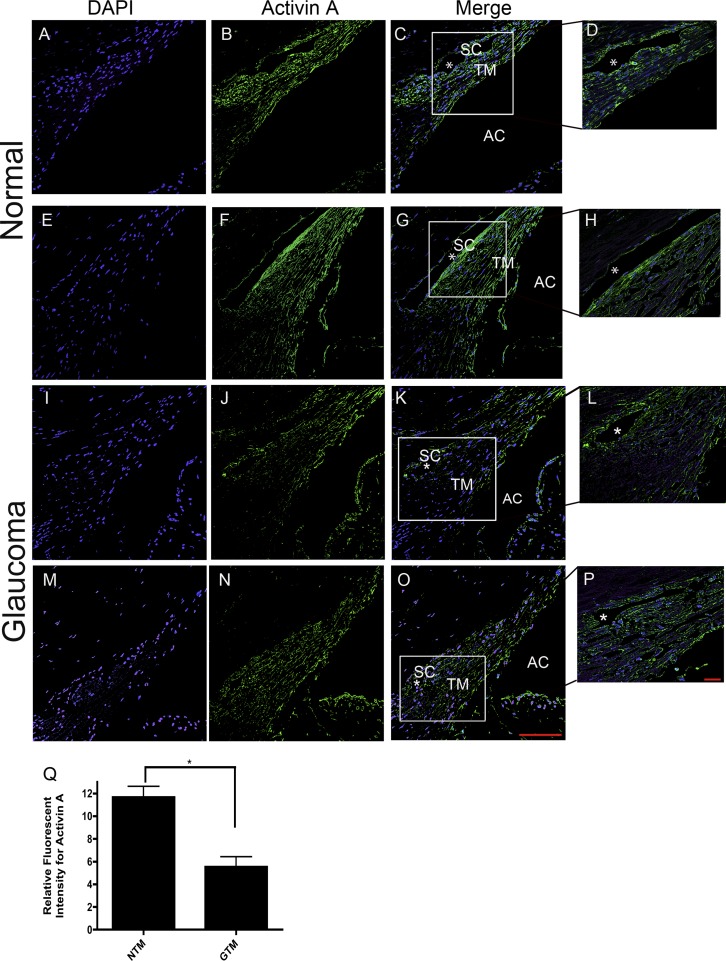
Since FST and Act A have been reported to be coexpressed in many tissues, we wanted to determine whether Act A protein was also expressed in human TM tissues (Fig. 10). The absence of primary antibody and/or rabbit IgG was used as a negative control, while human liver was used as a positive control for Act A staining (data not shown). Act A was expressed in NTM tissues (Figs. 10B, 10F). The expression appeared to be concentrated in the juxtacanalicular region of the TM and the inner and outer wall endothelium of Schlemm's canal (Figs. 10D, 10H). In contrast, FST has a more uniform distribution throughout all regions of the TM. Act A was also expressed in GTM tissues (Figs. 10J, 10N). Act A protein levels were significantly lower in GTM as compared to NTM tissues (P < 0.05) (Fig. 10Q).
Figure 10. .
Representative (200×) images of Act A in four age-matched (79 and 82 years) NTM and GTM tissues. DAPI stained nuclei (A, E, I, M). Act A expression in NTM (B, F) and GTM (J, N) tissues. Act A staining merged with DAPI in NTM (C, G) and GTM (K, O) tissues. Scale bar = 100 μm. Higher magnification images (400×) of Act A staining merged with DAPI in NTM (D, H) and GTM (L, P) tissues. (Q) Relative staining intensity measurements of Act A expression in age-matched NTM (n = 2) and GTM (n = 2) tissues demonstrated significantly decreased expression of Act A in GTM tissues (*P < 0.05; n = 4). Scale bar = 20 μm.
Discussion
Our current results demonstrated that the BMP antagonist FST is present in both TM cells and tissues. The primary FST transcript undergoes alternative splicing to produce mRNAs (FST 317/344) that encode for proteins that are proteolytically cleaved, yielding FST 288 and FST 315.39,40 Both FST mRNA and protein are expressed in human NTM and GTM cells, with significantly higher expression in GTM cells as compared to NTM cells. In addition, FST isoforms, FST 288 and FST 315, are present in human NTM and GTM tissues. Our results were the first to demonstrate FST 288 and FST 315 protein expression in TM tissues.
Immunohistochemical staining also suggested a difference in FST isoform protein levels in human NTM versus GTM tissues. FST 288 is bound by heparin on the cell surface and FST 315 is present in the extracellular space,41,52,53 which may be responsible for the expression patterns of the FST isoforms in TM tissues. FST 315 expression appeared to be less in GTM versus NTM tissues.This may be due to lower cellularity in the glaucomatous TM. Also, the profibrotic growth factor TGF-β2 induced FST mRNA and protein expression in a dose- and time-dependent manner in cultured TM cells. TGF-β2 induction of FST is similar to our previous report of gremlin induction by TGF-β2 in TM cells.19 Thus it is possible that, similar to gremlin, the upregulation of FST may also block BMP-4 inhibition of TGF-β2 induction of ECM proteins in the TM. In addition, the potential role(s) of FST 288 and FST 315 in the pathophysiology of glaucoma is currently not known and will form the basis of future studies.
Although FST is a BMP antagonist, it also inhibits Act signaling.35,54 We demonstrated mRNA expression for Act A and Act B in both NTM and GTM cells. mRNA expression of other Act genes was not detected. To our knowledge, this is the first report of the presence of Act A and B mRNA and Act A protein in human TM tissues. These findings are not totally unexpected, since previous studies have reported that FST and Act A are usually coexpressed.54,55 Due to the low expression of Act B in TM cells, we focused our attention on Act A, whose mRNA expression was robust in TM cells. Act A protein was significantly lower in GTM compared to NTM tissues. Since TGF-β2 increased FST expression and TGF-β2 protein levels are elevated in glaucomatous AH, this may allow elevated levels of FST to function primarily as a BMP antagonist in the glaucomatous TM. Furthermore, the FST/Act complex can potentially bind BMPs and the BMP type I receptor, thus also inhibiting BMP activity in the TM.56
Taken together, our results highlight the complex relationship of TGF-β2, BMPs, and BMP antagonists in human TM. Additional studies will further assess the relationship of Act A and TGF-β2, the function of FST in TM cells, and their potential role in the pathophysiology of glaucoma.
Acknowledgments
We thank Anne-Marie Brun for providing valuable assistance with immunohistochemical staining and I-fen Chang for assistance with confocal imaging.
Footnotes
Supported by NIH Grant EY-017374 (RJW).
Disclosure: A.M. Fitzgerald, None; C. Benz, None; A.F. Clark, None; R.J. Wordinger, None
References
- 1.Quigley HA. Number of people with glaucoma worldwide. Br J Ophthalmol. 1996;80:389–393 [DOI] [PMC free article] [PubMed] [Google Scholar]
- 2.Quigley HA. The search for glaucoma genes—implications for pathogenesis and disease detection. N Engl J Med. 1998;338:1063–1064 [DOI] [PubMed] [Google Scholar]
- 3.Quigley HA, Broman AT. The number of people with glaucoma worldwide in 2010 and 2020. Br J Ophthalmol. 2006;90:262–267 [DOI] [PMC free article] [PubMed] [Google Scholar]
- 4.Rohen JW, Lutjen-Drecoll E, Flugel C, Meyer M, Grierson I. Ultrastructure of the trabecular meshwork in untreated cases of primary open-angle glaucoma (POAG). Exp Eye Res. 1993;56:683–692 [DOI] [PubMed] [Google Scholar]
- 5.Furuyoshi N, Furuyoshi M, Futa R, Gottanka J, Lutjen-Drecoll E. Ultrastructural changes in the trabecular meshwork of juvenile glaucoma. Ophthalmologica. 1997;211:140–146 [DOI] [PubMed] [Google Scholar]
- 6.Tane N, Dhar S, Roy S, Pinheiro A, Ohira A. Effect of excess synthesis of extracellular matrix components by trabecular meshwork cells: possible consequence on aqueous outflow. Exp Eye Res. 2007;84:832–842 [DOI] [PubMed] [Google Scholar]
- 7.Ochiai Y, Ochiai H. Higher concentration of transforming growth factor-beta in aqueous humor of glaucomatous eyes and diabetic eyes. Jpn J Ophthalmol. 2002;46:249–253 [DOI] [PubMed] [Google Scholar]
- 8.Stefan C, Dragomir L, Dumitrica DM, Ursaciuc C, Dobre M, Surcel M. TGF-beta2 involvements in open angle glaucoma [in Romanian]. Oftalmologia. 2008;52:110–112 [PubMed] [Google Scholar]
- 9.Tripathi RC, Li J, Chan WF, Tripathi BJ. Aqueous humor in glaucomatous eyes contains an increased level of TGF-beta 2. Exp Eye Res. 1994;59:723–727 [DOI] [PubMed] [Google Scholar]
- 10.Inatani M, Tanihara H, Katsuta H, Honjo M, Kido N, Honda Y. Transforming growth factor-beta 2 levels in aqueous humor of glaucomatous eyes. Graefes Arch Clin Exp Ophthalmol. 2001;239:109–113 [DOI] [PubMed] [Google Scholar]
- 11.Min SH, Lee TI, Chung YS, Kim HK. Transforming growth factor-beta levels in human aqueous humor of glaucomatous, diabetic and uveitic eyes. Korean J Ophthalmol. 2006;20:162–165 [DOI] [PMC free article] [PubMed] [Google Scholar]
- 12.Tovar-Vidales T, Clark AF, Wordinger RJ. Transforming growth factor-beta2 utilizes the canonical Smad-signaling pathway to regulate tissue transglutaminase expression in human trabecular meshwork cells. Exp Eye Res. 2011;93:442–451 [DOI] [PMC free article] [PubMed] [Google Scholar]
- 13.Huggins JT, Sahn SA. Causes and management of pleural fibrosis. Respirology. 2004;9:441–447 [DOI] [PubMed] [Google Scholar]
- 14.Bataller R, Brenner DA. Liver fibrosis. J Clin Invest. 2005;115:209–218 [DOI] [PMC free article] [PubMed] [Google Scholar]
- 15.Liu Y. Renal fibrosis: new insights into the pathogenesis and therapeutics. Kidney Int. 2006;69:213–217 [DOI] [PubMed] [Google Scholar]
- 16.Li J, Tripathi BJ, Tripathi RC. Modulation of pre-mRNA splicing and protein production of fibronectin by TGF-beta2 in porcine trabecular cells. Invest Ophthalmol Vis Sci. 2000;41:3437–3443 [PubMed] [Google Scholar]
- 17.Zhao X, Ramsey KE, Stephan DA, Gene Russell P. and protein expression changes in human trabecular meshwork cells treated with transforming growth factor-beta. Invest Ophthalmol Vis Sci. 2004;45:4023–4034 [DOI] [PubMed] [Google Scholar]
- 18.Zhao X, Russell P. Versican splice variants in human trabecular meshwork and ciliary muscle. Mol Vis. 2005;11:603–608 [PubMed] [Google Scholar]
- 19.Wordinger RJ, Fleenor DL, Hellberg PE, et al. Effects of TGF-beta2, BMP-4, and gremlin in the trabecular meshwork: implications for glaucoma. Invest Ophthalmol Vis Sci. 2007;48:1191–1200 [DOI] [PubMed] [Google Scholar]
- 20.Welge-Lussen U, May CA, Lutjen-Drecoll E. Induction of tissue transglutaminase in the trabecular meshwork by TGF-beta1 and TGF-beta2. Invest Ophthalmol Vis Sci. 2000;41:2229–2238 [PubMed] [Google Scholar]
- 21.Tovar-Vidales T, Roque R, Clark AF, Wordinger RJ. Tissue transglutaminase expression and activity in normal and glaucomatous human trabecular meshwork cells and tissues. Invest Ophthalmol Vis Sci. 2008;49:622–628 [DOI] [PMC free article] [PubMed] [Google Scholar]
- 22.Sethi A, Mao W, Wordinger RJ, Clark AF. Transforming growth factor-beta induces extracellular matrix protein cross-linking lysyl oxidase (LOX) genes in human trabecular meshwork cells. Invest Ophthalmol Vis Sci. 2011;52:5240–5250 [DOI] [PMC free article] [PubMed] [Google Scholar]
- 23.Gottanka J, Chan D, Eichhorn M, Lutjen-Drecoll E, Ethier CR. Effects of TGF-beta2 in perfused human eyes. Invest Ophthalmol Vis Sci. 2004;45:153–158 [DOI] [PubMed] [Google Scholar]
- 24.Fleenor DL, Shepard AR, Hellberg PE, Jacobson N, Pang IH, Clark AF. TGFbeta2-induced changes in human trabecular meshwork: implications for intraocular pressure. Invest Ophthalmol Vis Sci. 2006;47:226–234 [DOI] [PubMed] [Google Scholar]
- 25.Shepard AR, Millar JC, Pang IH, Jacobson N, Wang WH, Clark AF. Adenoviral gene transfer of active human transforming growth factor-{beta}2 elevates intraocular pressure and reduces outflow facility in rodent eyes. Invest Ophthalmol Vis Sci. 2010;51:2067–2076 [DOI] [PubMed] [Google Scholar]
- 26.Wordinger RJ, Agarwal R, Talati M, Fuller J, Lambert W, Clark AF. Expression of bone morphogenetic proteins (BMP), BMP receptors, and BMP associated proteins in human trabecular meshwork and optic nerve head cells and tissues. Mol Vis. 2002;8:241–250 [PubMed] [Google Scholar]
- 27.Fuchshofer R, Stephan DA, Russell P, Tamm ER. Gene expression profiling of TGFbeta2- and/or BMP7-treated trabecular meshwork cells: identification of Smad7 as a critical inhibitor of TGF-beta2 signaling. Exp Eye Res. 2009;88:1020–1032 [DOI] [PMC free article] [PubMed] [Google Scholar]
- 28.Wordinger RJ, Clark AF. Bone morphogenetic proteins and their receptors in the eye. Exp Biol Med (Maywood). 2007;232:979–992 [DOI] [PubMed] [Google Scholar]
- 29.Balemans W, Van Hul W. Extracellular regulation of BMP signaling in vertebrates: a cocktail of modulators. Dev Biol. 2002;250:231–250 [PubMed] [Google Scholar]
- 30.Glister C, Kemp CF, Knight PG. Bone morphogenetic protein (BMP) ligands and receptors in bovine ovarian follicle cells: actions of BMP-4, -6 and -7 on granulosa cells and differential modulation of Smad-1 phosphorylation by follistatin. Reproduction. 2004;127:239–254 [DOI] [PubMed] [Google Scholar]
- 31.Fuchshofer R, Yu AH, Welge-Lussen U, Tamm ER. Bone morphogenetic protein-7 is an antagonist of transforming growth factor-beta2 in human trabecular meshwork cells. Invest Ophthalmol Vis Sci. 2007;48:715–726 [DOI] [PubMed] [Google Scholar]
- 32.Hsu DR, Economides AN, Wang X, Eimon PM, Harland RM. The Xenopus dorsalizing factor Gremlin identifies a novel family of secreted proteins that antagonize BMP activities. Mol Cell. 1998;1:673–683 [DOI] [PubMed] [Google Scholar]
- 33.Shimasaki S, Moore RK, Otsuka F, Erickson GF. The bone morphogenetic protein system in mammalian reproduction. Endocr Rev. 2004;25:72–101 [DOI] [PubMed] [Google Scholar]
- 34.Nohe A, Keating E, Knaus P, Petersen NO. Signal transduction of bone morphogenetic protein receptors. Cell Signal. 2004;16:291–299 [DOI] [PubMed] [Google Scholar]
- 35.Abe Y, Abe T, Aida Y, Hara Y, Maeda K. Follistatin restricts bone morphogenetic protein (BMP)-2 action on the differentiation of osteoblasts in fetal rat mandibular cells. J Bone Miner Res. 2004;19:1302–1307 [DOI] [PubMed] [Google Scholar]
- 36.Fainsod A, Deissler K, Yelin R, et al. The dorsalizing and neural inducing gene follistatin is an antagonist of BMP-4. Mech Dev. 1997;63:39–50 [DOI] [PubMed] [Google Scholar]
- 37.Iemura S, Yamamoto TS, Takagi C, et al. Direct binding of follistatin to a complex of bone-morphogenetic protein and its receptor inhibits ventral and epidermal cell fates in early Xenopus embryo. Proc Natl Acad Sci U S A. 1998;95:9337–9342 [DOI] [PMC free article] [PubMed] [Google Scholar]
- 38.Avsian-Kretchmer O, Hsueh AJ. Comparative genomic analysis of the eight-membered ring cystine knot-containing bone morphogenetic protein antagonists. Mol Endocrinol. 2004;18:1–12 [DOI] [PubMed] [Google Scholar]
- 39.Shimasaki S, Koga M, Esch F, et al. Primary structure of the human follistatin precursor and its genomic organization. Proc Natl Acad Sci U S A. 1988;85:4218–4222 [DOI] [PMC free article] [PubMed] [Google Scholar]
- 40.Lin SY, Morrison JR, Phillips DJ, de Kretser DM. Regulation of ovarian function by the TGF-beta superfamily and follistatin. Reproduction. 2003;126:133–148 [DOI] [PubMed] [Google Scholar]
- 41.Sidis Y, Mukherjee A, Keutmann H, Delbaere A, Sadatsuki M, Schneyer A. Biological activity of follistatin isoforms and follistatin-like-3 is dependent on differential cell surface binding and specificity for activin, myostatin, and bone morphogenetic proteins. Endocrinology. 2006;147:3586–3597 [DOI] [PubMed] [Google Scholar]
- 42.Sumitomo S, Inouye S, Liu XJ, Ling N, Shimasaki S. The heparin binding site of follistatin is involved in its interaction with activin. Biochem Biophys Res Commun. 1995;208:1–9 [DOI] [PubMed] [Google Scholar]
- 43.Sidis Y, Schneyer AL, Keutmann HT. Heparin and activin-binding determinants in follistatin and FSTL3. Endocrinology. 2005;146:130–136 [DOI] [PubMed] [Google Scholar]
- 44.Sugino K, Kurosawa N, Nakamura T, et al. Molecular heterogeneity of follistatin, an activin-binding protein. Higher affinity of the carboxyl-terminal truncated forms for heparan sulfate proteoglycans on the ovarian granulosa cell. J Biol Chem. 1993;268:15579–15587 [PubMed] [Google Scholar]
- 45.Schneyer AL, Wang Q, Sidis Y, Sluss PM. Differential distribution of follistatin isoforms: application of a new FS315-specific immunoassay. J Clin Endocrinol Metab. 2004;89:5067–5075 [DOI] [PubMed] [Google Scholar]
- 46.Wordinger RJ, Clark AF, Agarwal R, et al. Cultured human trabecular meshwork cells express functional growth factor receptors. Invest Ophthalmol Vis Sci. 1998;39:1575–1589 [PubMed] [Google Scholar]
- 47.Sethi A, Jain A, Zode GS, Wordinger RJ, Clark AF. Role of TGFbeta/Smad signaling in gremlin induction of human trabecular meshwork extracellular matrix proteins. Invest Ophthalmol Vis Sci. 2011;52:5251–5259 [DOI] [PMC free article] [PubMed] [Google Scholar]
- 48.Fuchshofer R. The pathogenic role of transforming growth factor-β2 in glaucomatous damage to the optic nerve head. Exp Eye Res. 2011;93:165–169 [DOI] [PubMed] [Google Scholar]
- 49.Lutjen-Drecoll E. Morphological changes in glaucomatous eyes and the role of TGFbeta2 for the pathogenesis of the disease. Exp Eye Res. 2005;81:1–4 [DOI] [PubMed] [Google Scholar]
- 50.Tovar-Vidales T, Clark AF, Wordinger RJ. Transforming growth factor-beta2 utilizes the canonical Smad-signaling pathway to regulate tissue transglutaminase expression in human trabecular meshwork cells. Exp Eye Res. 2011;93:442–451 [DOI] [PMC free article] [PubMed] [Google Scholar]
- 51.Picht G, Welge-Luessen U, Grehn F, Lutjen-Drecoll E. Transforming growth factor beta 2 levels in the aqueous humor in different types of glaucoma and the relation to filtering bleb development. Graefes Arch Clin Exp Ophthalmol. 2001;239:199–207 [DOI] [PubMed] [Google Scholar]
- 52.Keutmann HT, Schneyer AL, Sidis Y. The role of follistatin domains in follistatin biological action. Mol Endocrinol. 2004;18:228–240 [DOI] [PubMed] [Google Scholar]
- 53.Lin SY, Craythorn RG, O'Connor AE, et al. Female infertility and disrupted angiogenesis are actions of specific follistatin isoforms. Mol Endocrinol. 2008;22:415–429 [DOI] [PMC free article] [PubMed] [Google Scholar]
- 54.Ejilemele AA. Inhibins, activins and follistatins: a review. Niger Postgrad Med J. 2008;15:130–136 [PubMed] [Google Scholar]
- 55.Kreidl E, Ozturk D, Metzner T, Berger W, Grusch M. Activins and follistatins: emerging roles in liver physiology and cancer. World J Hepatol. 2009;1:17–27 [DOI] [PMC free article] [PubMed] [Google Scholar]
- 56.Thompson TB, Lerch TF, Cook RW, Woodruff TK, Jardetzky TS. The structure of the follistatin:activin complex reveals antagonism of both type I and type II receptor binding. Dev Cell. 2005;9:535–543 [DOI] [PubMed] [Google Scholar]


