Abstract
Two very different sorts of experiments have characterized the field of cardiac energetics over the past three decades. In one of these, Gibbs and colleagues measured the heat production of isolated papillary muscles undergoing isometric contractions and afterloaded isotonic contractions. The former generated roughly linear heat vs. force relationships. The latter generated enthalpy-load relationships, the peak values of which occurred at or near peak isometric force, i.e., at a relative load of unity. Contractile efficiency showed a pronounced dependence on afterload. By contrast, Suga and coworkers measured the oxygen consumption (V̇o2) while recording the pressure-volume-time work loops of blood-perfused isolated dog hearts. From the associated (linear) end-systolic pressure-volume relations they derived a quantity labeled pressure-volume area (PVA), consisting of the sum of pressure-volume work and unspent elastic energy and showed that this was linearly correlated with V̇o2 over a wide range of conditions. This linear dependence imposed isoefficiency: constant contractile efficiency independent of afterload. Neither these data nor those of Gibbs and colleagues are in dispute. Nevertheless, despite numerous attempts over the years, no demonstration of either compatibility or incompatibility of these disparate characterizations of cardiac energetics has been forthcoming. We demonstrate that compatibility between the two formulations is thwarted by the concept of isoefficiency, the thermodynamic basis of which we show to be untenable.
Keywords: pressure-volume-area, V̇o2-PVA relation, load-enthalpy relations, pressure-volume loops, isoefficiency
over the past three decades, two apparently fundamentally different modes of investigation have dominated the study of cardiac energetics. These were developed independently by Colin Gibbs in Australia and Hiroyuki Suga in Japan. Gibbs and colleagues (3, 7, 21) adopted the use of flat-bed thermopiles to measure the heat production and work performance of one-dimensional isolated papillary muscles. By contrast, Suga and colleagues (11, 23) measured the oxygen consumption (V̇o2) of whole hearts performing pressure-volume work. So, both the experimentally measured variables (heat vs. V̇o2) and the experimental preparations (papillary muscles vs. whole hearts) differed. But more perplexing were the (visually) disparate graphical presentations of results from apparently equivalent interventions: steeply curvilinear enthalpy (i.e., heat plus work) vs. mechanical performance curves from Gibbs and colleagues; strikingly linear V̇o2 vs. mechanical performance relationships from Suga and colleagues. These differences, in turn, generated apparently irreconcilable estimates of efficiency:constant in the case of Suga's group, variable in the case of Gibbs' group.
GIBBS FORMULATION
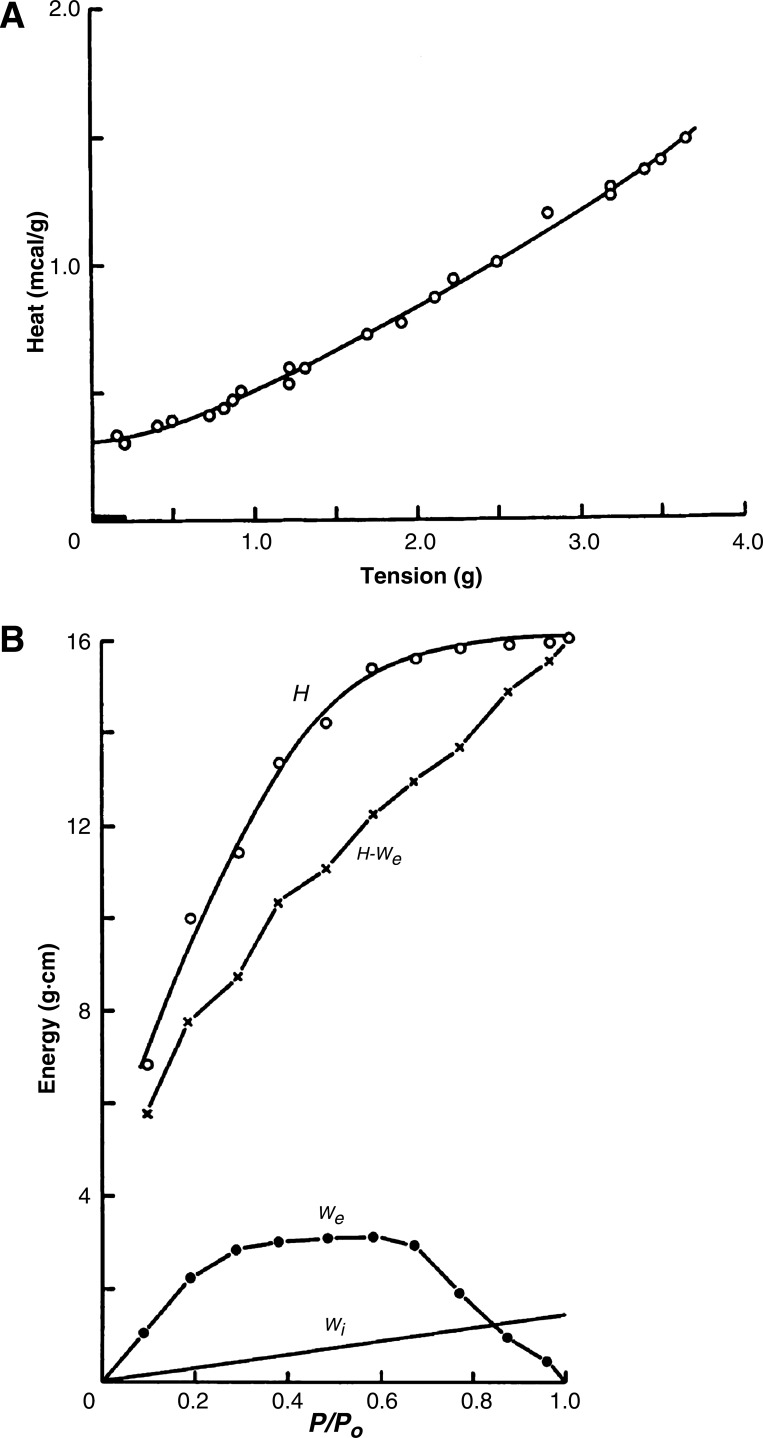
Two protocols have been widely used by Gibbs and coworkers. In one, heat production per twitch was recorded as a function of peak twitch force, which, in turn, was determined either by changing stimulation frequency (5, 21) or, more commonly (7), by reducing muscle length below its optimal value, i.e., the length (Lo) that allowed the development of maximal twitch force (Fo). Results from such experiments were presented as heat-force relationships that tended either to be linear (2, 6) or to display modest positive curvature (Fig. 1A). In either case, extrapolation of the fitted relationship to the ordinate has become a routine method of estimating the cost of activation of contraction (i.e., of excitation-contraction coupling) now attributed primarily to the energy expended by the sarcoplasmic reticular Ca2+ pump and the sarcolemmal Na+-K+ pump. This attribution allows the active (supra-basal) heat production (Q) at any given force to be separated into two components: the heat of activation (QA) and the heat of cross-bridge cycling (QXb).
Fig. 1.
Heat as a function of length-dependent isometric force (A) and energy (or, more strictly, enthalpy) as a function of relative afterload (P/Po, ○ and smooth line, B) of a rabbit papillary muscle. Also shown in B are the external work (We), the internal work against series elasticity (Wi) and the difference between enthalpy and external work (H - We). Note that the ratio W/H yields a measure of efficiency. [Reproduced with permission of the Physiological Society (3, from Figs. 3 and 7).]
Under the other principal protocol developed by Gibbs and colleagues, muscles were held at Lo by a preload and, following stimulation, allowed to shorten against a variable afterload. In this scenario, a variable period of isometric contraction preceded a variable period of isotonic contraction before the muscle relaxed back to resting length. This protocol allowed calculation of external work performance and, hence, the mechanical efficiency. Results from such experiments were presented as enthalpy-load relations (7), where enthalpy (ΔH) is the sum of work (W) plus heat (Q): ΔH = W + Q (Fig. 1B). Enthalpy-load relations, such as those shown in Fig. 1B, have been demonstrated repeatedly by Gibbs and colleagues (12, 14, 16, 18).
SUGA FORMULATION
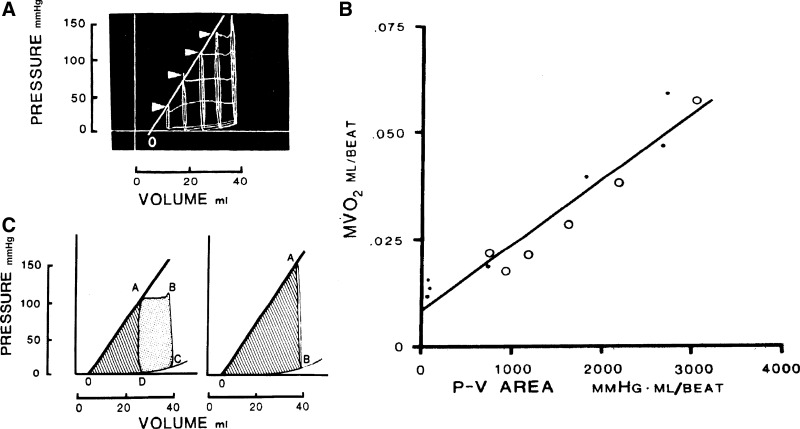
Suga and colleagues (11, 23, 24) adopted a fundamentally different approach to that of Gibbs and colleagues. Instead of using isolated papillary muscle bathed in a crystalloid medium, their preparation was the isolated, blood-circulated, cross-perfused dog heart. By using a variety of ingenious techniques to measure left-ventricular volume (8, 10, 19, 20, 32–34), they recorded the oxygen consumption per beat as the heart underwent normal pressure-volume loops or contracted isovolumically. Work was given as the area within the closed loop. By capitalizing on the behavior of the end-systolic pressure-volume relation, which remained linear under variation of chronotropy (31) and inotropy (22, 30), the pressure-volume-area (PVA) could be readily defined. This area is given by the sum of that of the work loop and the triangular area to its left between the end-systolic and end-diastolic pressure-volume relations (Fig. 2, A and C). The striking empirical observation is that a plot of V̇o2 (the equivalent of enthalpy in the Gibbs formulation) per beat is consistently a linear function of PVA (Fig. 2B) for both ejecting and isovolumic contractions (29).
Fig. 2.
Experimentally measured pressure-volume loops and isovolumic contractions recorded from an isolated, cross-perfused, dog heart, and their stylized representations (A and C, respectively). PVA is given by the sum of the shaded triangular regions plus the rectangular pressure-volume region (C). B: linear relationship between myocardial oxygen consumption per beat (MVO2) and PVA for both isovolumic and ejecting contractions. [Reproduced with permission from (11).]
It should be noted that both axes of Suga's V̇o2-PVA relation provide measures of energy. Hence, the inverse of the slope of this linear relation provides an index of efficiency. Its value is in the range 40–50% (23, 24, 27, 28), some two to four times greater than the peak value resulting from Gibbs' more conventional definition of efficiency. Because the slope of the V̇o2-PVA relation is constant, isoefficiency obtains.
ALGEBRAIC MODEL OF THE SUGA FORMULATION
Over the years, numerous authors, including proponents of both methodologies have attempted to reconcile these apparently disparate results. The sole advance was made by Gibbs and Chapman (4), who, using graphical techniques and exploiting Suga's concept of isoefficiency, produced a plot of PVA as a function of relative ejection pressure, noting that “… the curvature of the relationship is strikingly similar to that measured in an enthalpy-load diagram.” By adopting a comparable geometric model, we demonstrate mathematically the generality of these authors' prescience.
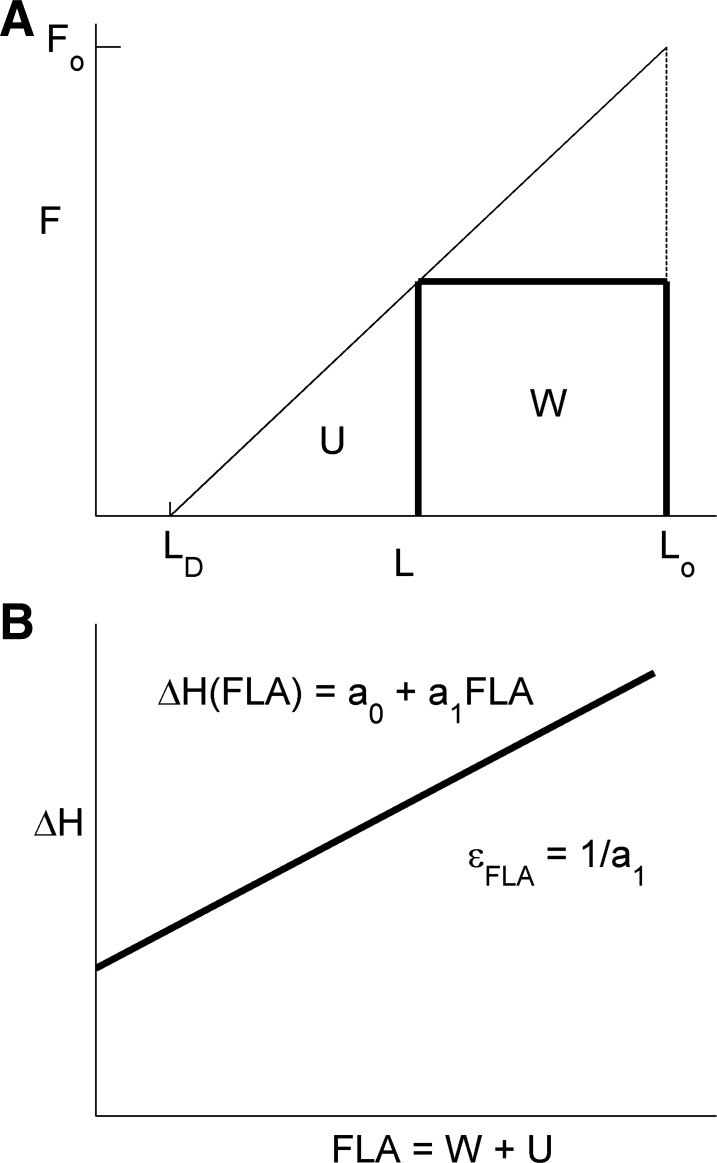
We commence with the stylized graphs shown in Fig. 3, reverting to a 1-D development, in which force-length area (FLA) is the 1-D correlate of PVA, and the enthalpy-FLA relation is the 1-D equivalent of the V̇o2-PVA relationship of the whole heart. For simplicity, we ignore the passive (end-diastolic) force-length relation and assume linearity of both the end-systolic force-length [F = F(L)] relation (Fig. 3A) and the enthalpy-FLA [H = H(FLA)] relation (Fig. 3B).
Fig. 3.
Schematic representation of the linear force-length (A) and the enthalpy-FLA (B) relations of cardiac muscle. Lo is muscle length (L) at which force (F) is optimal (Fo); LD is muscle length at which force is zero (corresponding to dead-space volume, VD, in the whole heart). W = work; U = Suga's potential energy; FLA = W + U is force-length-area; a0 and a1 are arbitrary parameters describing the phenomenological linear relationship between change of enthalpy (ΔH) and FLA; εFLA, the inverse of the slope of the ΔH-FLA relation, is the contractile efficiency, as defined by Suga.
Algebraic development consists of deriving analytical expressions for each of the variables in Fig. 4:
| (1’) |
| (2’) |
| (3’) |
Fig. 4.
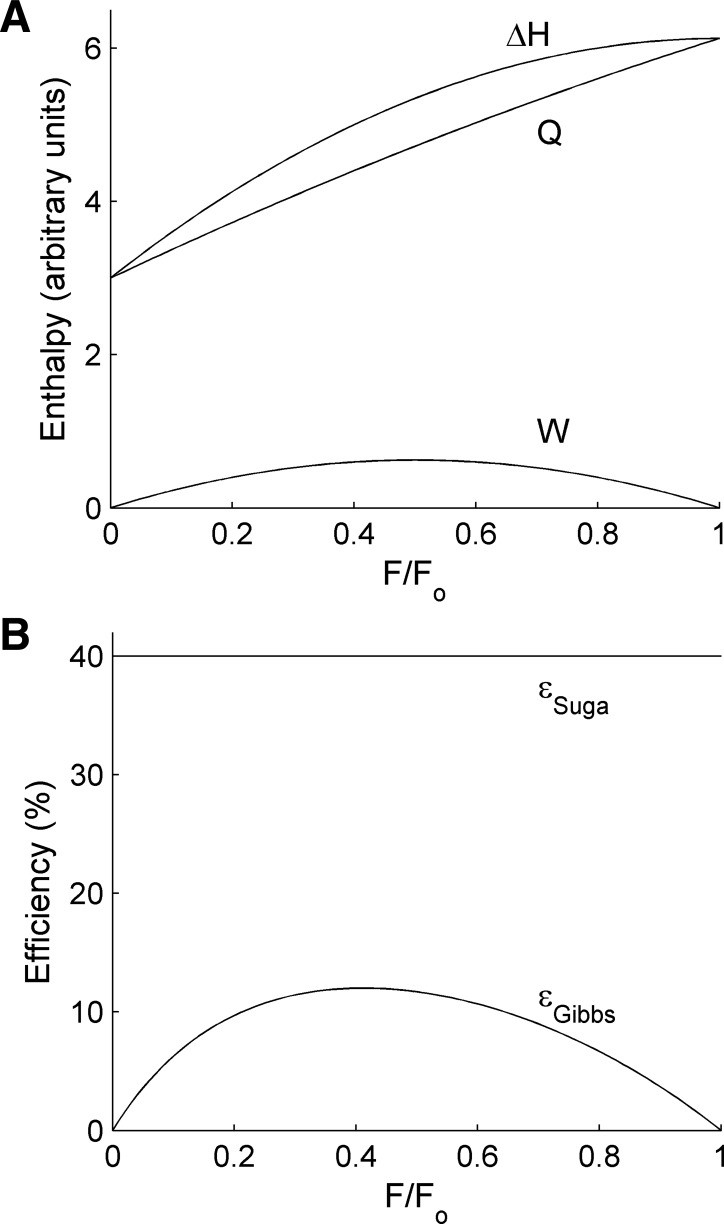
Graphical output from the algebraic model (Equations 1–6; arbitrary units: a0 = 3, a1 = 2.5, Lo = 1, LD = 0.75, Fo = 1). A: change of enthalpy (ΔH, Eq 5), active heat (Q, Eq 6) and work (W, Eq 2) as functions of relative load (F/Fo). B: Gibbs efficiency (εGibbs = W/ΔH) as a function of relative load for the same arbitrary parameters used in A; εSuga is the corresponding ‘isoefficiency’ value arising from the Suga formulation.
To make comparison with Gibbs' formulation, in which energy expenditure is expressed in terms of relative force production (i.e., the isotonic afterload as a proportion of Fo), we rearrange each of the above equations to achieve functions of F rather than L:
| (1) |
| (2) |
| (3) |
| (4) |
Substituting the expression for FLA in terms of relative isotonic force production, Eq. 4, into the expression for enthalpy as a function of FLA given in Fig. 4B, we have:
| (5) |
Finally, we make use of the 1st law of thermodynamics, which relates heat (Q) to enthalpy and work:
| (6) |
Equations 5 and 6 allow us to plot graphs of enthalpy, heat, and work as functions of isotonic afterload for arbitrary values of a0 and a1 (Fig. 4A).
It is clear that the qualitative profile of the enthalpy-load relation in Fig. 4A is similar to those published by Gibbs and coworkers for papillary muscles (Fig. 1B). Specifically, differentiation of Eq. 5 shows that H is maximal when F/Fo = 1. This result does not depend on the assumption of linearity of the end-systolic force-length (or, equivalently, the end-systolic pressure-volume) relation, for the following reason.
For any monotonically increasing force-length relation, FLA will be a monotonically increasing function of F and will be maximal at L = Lo or, equivalently, F = Fo. Now, if enthalpy is any monotonically increasing function of FLA, then H(FLA) = H[FLA(F)] and (by the chain rule) dH/dF = dH/dFLA × dFLA/dF. But, because H is a monotonically increasing function of FLA, then dH/dFLA has no zeros between F = 0 and F = Fo. Hence dH/dF can be zero only where dFLA/dF is zero, i.e., only where F = Fo. This is the experimentally observed behavior shown in Fig. 1B.
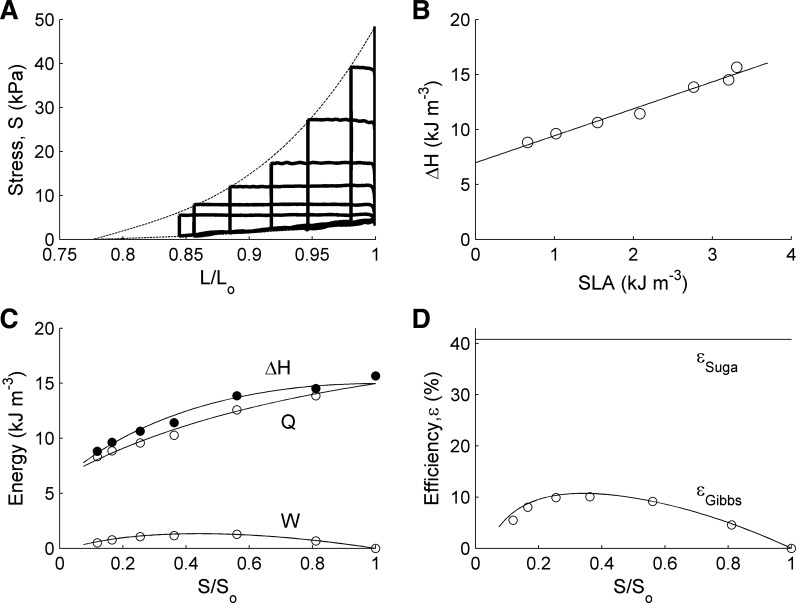
A test of our mathematical development above is provided by data that we obtained from a continuously superfused, right-ventricular trabecula from rat, using our recently developed work-loop calorimeter (37). Fig. 5A shows the non-linear, monotonically increasing, end-systolic and end-diastolic stress-length relations of the preparation undergoing isotonic stress-length loops at various afterloads. Third-order polynomials were fitted through these end-systolic and end-diastolic points. These fitted curves provided the boundaries for integration of the regions comprising W and U.
Fig. 5.
Experimental data and model-derived curves. A: stress-length (where stress = force per cross-sectional area) work loops (thick lines) at various afterloads experienced by a single rat right-ventricular trabecula. Cubic functions (thin lines) were fitted through the end-systolic and end-diastolic points of the individual work loops. B: enthalpy (heat + work) as a function of stress-length area (SLA); symbols: experimental data; straight line results from linear regression. C: the symbols denote the experimentally observed values of enthalpy, work, and heat as functions of relative peak stress (S/So). D: symbols denote εGibbs = W/ΔH as a function of relative peak stress (derived from C). Continuous lines in C and D were derived using the regression parameters arising from the fitted lines in A and B and have been superimposed on the observed experimental data. Trabecula of length 2.63 mm and diameter 275 μm.
Despite the pronounced curvilinearity of the end-systolic and end-diastolic stress-length relations [see, also, Burkhoff et al. (1)], the resulting enthalpy vs. SLA relation (Fig. 5B) remains resolutely linear, whereas the enthalpy-load relation (Fig. 5C, top line) is curvilinear and maximal at maximum load, as predicted by the mathematical model.
The preceding development formalizes a mathematical link between the Gibbs and Suga formulations of cardiac energetics, in accord with the previous insight proffered by Gibbs and Chapman (4). But we are left with the deeply unsatisfying situation that the Suga formulation predicts isoefficiency—in stark contrast to the Gibbs formulation (Figs. 4B and 5D). We address this issue by contrasting the two definitions of efficiency adopted by the Suga and Gibbs groups.
| (7) |
where QXb ≡ (Q – a0) signifies ‘cross-bridge heat’ and
| (8) |
where ‘Q’ signifies active heat (cross-bridge plus activation, a0)
We note immediately that εSuga does not describe mechanical efficiency in the conventional manner, because it has a term (U) other than work (W) in the numerator. Its legitimacy thus depends critically on the meaning of U. We consider three possibilities.
A geometric definition of U.
U is defined geometrically as a region of the pressure-volume diagram. But the area of this region does not correspond to any intrinsic property of muscle, to any thermodynamic quantity, or even to a particular experimental protocol. Rather, it is an extrapolation from a series of previously performed work loops, the end-systolic points of which, when curve-fitted and extended to the volume (or length) axis, define dead-space volume (VD) or its muscle-length equivalent (LD). In this view, U is an abstract entity—a non-physical, geometric construct that, when added to W allows a linear dependence of V̇o2 on PVA to arise.
U as potential energy.
Especially in their later papers, Suga and colleagues (25, 26, 35, 36) referred to the region of the P-V plane that we label U as potential energy. To us, this label implies that some or all of U could be converted into work, under appropriate circumstances. But we stress that experimentally observed end-systolic points are not determined by the experimenter. Rather, they are determined exclusively by the whole heart (Fig. 2) or by the isolated muscle (Fig. 5A) as a result of the combined influences of the afterload and the force-velocity relation that (together with the time course of the Ca2+ transient) indirectly determine the duration of systole. We consider it improbable that a work loop could be contrived to capture any reasonable proportion of U without resorting to an experimental manipulation in which work is performed on the muscle by the experimental apparatus.
U as measure of Q.
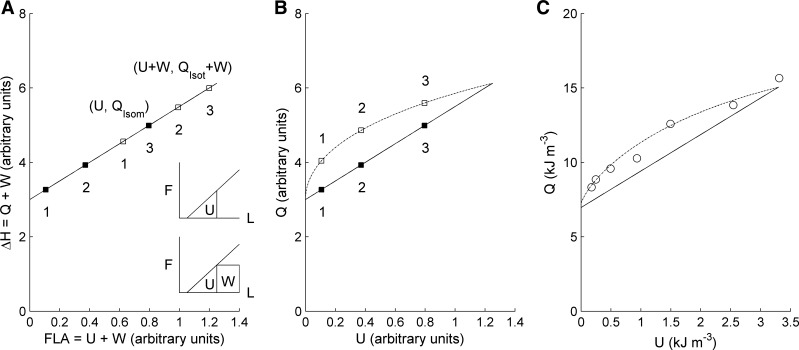
In their early publications, Suga and colleagues (11, 23, 28) suggested that U might be heat (in line with their later conception of it as potential energy, i.e., energy initially available for contraction but unable to be captured by the machinery of the cross bridges). In this view, each individual U and its accompanying W are paired, despite the fact (as described above) that U can be defined only after establishment of the end-systolic and end-diastolic force-length (or pressure-volume) relations. This consideration seems less fanciful when we apply Eq. 7 to the special case of an isometric contraction (in which W = 0). Given that εSuga is a constant (whose value is 40% in Fig. 5D), it appears that, at least under isometric conditions, QXb and U are expected to be proportional (Fig. 6A, solid line). Alas, proportionality does not prevail under isotonic conditions for either the algebraic model (Fig. 6B, dotted line) or for experimental data (Fig. 6C, dotted line). At a given value of U, more heat is generated in an isotonic than in an isometric contraction. This fact can, however, be used to derive one final insight.
Fig. 6.
Simulated (A and B) and measured (C) plots designed to shed light on U. A: stylized Suga relationship (ΔH ≡ V̇o2 vs. FLA) in which the filled symbols (signifying isometric contractions) align with those in B. Insets show an isometric (top) and isotonic (bottom) contraction at identical values of U. B: output from the algebraic model showing active heat, Q, vs. Suga's potential energy (U); arbitrary units on both axes. Solid line denotes isometric contractions; the dotted line denotes isotonic contractions. C: calculated functions superimposed on data (open symbols) from same muscle as in Fig. 5.
Fig. 6A shows a Suga-style enthalpy-FLA relation, arising from three (numbered) pairs of contractions, in which the (filled) symbols, corresponding to isometric contractions, have been aligned to correspond with their equivalents in Fig. 6B. The coordinates of any isometric contraction are (U, Qisom); those for the corresponding isotonic contraction (open symbols) are (U + W, Qisot + W), where the subscripts on Q distinguish the two types of contraction, as shown in Fig. 6A, insets. This immediately allows calculation of isoefficiency (the inverse of the slope of the line joining these two (or any other pair of) points with identical values of U).
| (9) |
Note that, whereas U was employed to derive the expression for Suga efficiency (Eq. 9), it is absent from it. This observation is consistent with the description of U (above) as a geometrical artifact of the PVA diagram, with no discernible physical interpretation. Note, furthermore, that determination of εSuga requires a minimum of two separate experimental interventions (one isometric and one isotonic) and is exquisitely protocol dependent because (as shown in Fig. 6A, insets) the length of the muscle at end systole of the isotonic contraction must be contrived to coincide with its length during the isometric contraction, to achieve the same value of U. The requirement for two independent measurements is consistent with the need for a minimum of two measurements to determine both the end-systolic pressure-volume relation and the slope of the V̇o2-PVA relation, as indicated above. By contrast, εGibbs can be calculated from a single experiment.
The aforementioned protocol dependence inherent in Eq. 9 has an unexpected corollary, as revealed by rearrangement of the equation.
| (10) |
In a Gibbs diagram, such as Fig. 1, A and B, the enthalpy-load and heat-stress relations have been generated from two independent experimental protocols: isotonic and isometric, respectively. It has been a matter of some debate as to how to compare the two relations, because they have arisen from contractions performed at different muscle lengths. The above analysis (Eq. 10) clarifies this issue. To determine the increment of heat generated by an isotonic contraction, in excess of an equivalent isometric contraction, the latter must be performed at a reduced preload. The magnitude of the preload must be such that muscle length is identical to that reached at the instant of end systole of the isotonic contraction. It is only under this unique protocol that both contractions will have been performed at the same value of U in the enthalpy-FLA plane (see Fig. 6A, insets).
The results of Fig. 6 and Eq. 10 provide graphical and algebraic evidence that U is related to Q. This immediately renders improbable the likelihood of reconciling the Gibbs and Suga expressions for mechanical efficiency, because U does not appear in Gibbs' definition. Nevertheless, we make a final attempt by exploring the consequence of redefining Gibbs efficiency to achieve parity with Suga's definition. We begin by noting that the latter can be re-expressed as follows:
| (11) |
We now redefine Gibbs efficiency as
| (12) |
so that the difference between Suga efficiency and the redefined Gibbs efficiency becomes
| (13) |
It is clear that unless U = 0, Suga isoefficiency will always exceed Gibbs efficiency. Thus, not even normalizing the two indices of efficiency to the same component of heat (QXb) achieves equivalence; in fact, it merely amplifies the difference between them.
DISCUSSION
In their insightful 1985 review article, Gibbs and Chapman (4) combined a numerico-graphical approach with the assumptions of linear pressure-volume and V̇o2-FLA relations to show that a plot of normalized PVA vs. fractional pressure produces a line very similar to that measured in an enthalpy-load diagram. We have taken their approach one step further by demonstrating, using a simple algebraic model (Eqs. 1–5), the mathematical basis of that striking similarity. We tested the model in the general case, using arbitrary parameter values (Fig. 4) demonstrating a curvilinear enthalpy-load relation that peaked at F/Fo = 1 (Fig. 4A).
Of more import, we have proven mathematically that the experimentally observed linearities of the pressure-volume and V̇o2-PVA relations are not a necessity; all that is required for this restricted domain of Gibbs-Suga agreement is that both of these relations be monotonically increasing. We provide an experimental test of this assertion, capitalizing on the pronouncedly nonlinear force-length relation of isolated cardiac trabeculae (Fig. 5A). Once again, and as predicted, a curvilinear enthalpy-load relation obtains (Fig. 5C) and the enthalpy vs. stress-length area relation is linear (Fig. 5B). Furthermore, our analysis proves that the maximum of the enthalpy-load relation must occur at Fo (or, equivalently, Lo), as is commonly observed experimentally, even in the face of higher-order polynomial force-length relations (13, 15). With decreasing afterload below Fo, enthalpy diminishes. This diminution reflects the diminishing number of available cross bridges due to increased overlap of the contractile filaments and shortening-dependent deactivation, i.e., reduced affinity of troponin-C for Ca2+.
The above considerations provide assurance that our simple algebraic model captures the essence of the Suga formulation. This gives us confidence to explore the ramifications of both the model and our experimental observations, with a view to comprehending isoefficiency, the hallmark of the Suga formulation of cardiac energetics. Exploration reveals that U, which appears in the numerator of εSuga, is (nonlinearly) related to the heat that appears in the denominator (Fig. 6). Its nonlinearity ensures that isoefficiency prevails but, in our opinion, its presence cannot be justified on thermodynamic grounds. The fundamental difference between Suga's phemonological isoefficiency and Gibbs' load-dependent efficiency cannot be reconciled.
It gives us little pleasure to conclude that isoefficiency is a chimera, arising as an algebraic consequence of the now apparent fact that U is related to a measureable quantity of heat. In retrospect, it is sobering to ponder that a generation of cardiac investigators (including the senior author of this paper), could have overlooked the appearance of a term relating to heat in the numerator of a definition of efficiency. Furthermore, the only way that U could represent potential elastic energy [note that we implicitly disregard the possibility of storage of biochemical energy (17)] would be if the long-since abandoned elastic model of Weber (38) (in which the potential energy for muscular contraction was presumed to be quantified by the product of isometric force and muscle length) were to prevail. That it does not was demonstrated experimentally by A. V. Hill a century ago (9).
CONCLUSION
Our finding that the potential energy term, U, in the numerator of Suga's PVA efficiency is a proxy for heat abrogates its usefulness as a measure of thermodynamic efficiency. Nevertheless, the phenomenological V̇o2-PVA relation remains tenable and will continue to find application, particularly in the clinical setting where, in a given inotropic state, its behavior is largely insensitive to changes of either preload or afterload. Furthermore, a thorough analysis of the U region of PVA reveals the experimental protocol required to quantify the excess of heat production during an isotonic contraction (vis-à-vis that of an isometric contraction). But we conclude that inferring isoefficiency from the inverse of the slope of the V̇o2-PVA relation is thermodynamically untenable, thereby rendering the Gibbs and Suga interpretations of cardiac energetics fundamentally irreconcilable.
GRANTS
This work was supported by the Health Research Council of New Zealand (Project Grant: 11/585); the Marsden Fund Council from New Zealand government funding, administered by the Royal Society of New Zealand (Project Grant: UOA0607); and the Virtual Physiological Rat Centre for the Study of Physiology and Genomics funded through NIH Grant P50-GM094503.
DISCLOSURES
No conflicts of interest, financial or otherwise, are declared by the authors.
AUTHOR CONTRIBUTIONS
Author contributions: J.-C.H., A.J.T., K.T., S.G., D.P.N., M.P.N., P.M.N., E.J.C., and D.S.L. conception and design of research; J.-C.H. and S.G. performed experiments; J.-C.H., S.G., E.J.C., and D.S.L. analyzed data; J.-C.H., A.J.T., K.T., S.G., D.P.N., M.P.N., P.M.N., E.J.C., and D.S.L. interpreted results of experiments; J.-C.H. prepared figures; J.-C.H., E.J.C., and D.S.L. drafted manuscript; J.-C.H., A.J.T., K.T., S.G., D.P.N., M.P.N., P.M.N., E.J.C., and D.S.L. edited and revised manuscript; J.-C.H., A.J.T., K.T., S.G., D.P.N., M.P.N., P.M.N., E.J.C., and D.S.L. approved final version of manuscript.
ACKNOWLEDGMENTS
We thank Associate Professor C. J. Barclay for his supportive comments on an early draft of this paper.
REFERENCES
- 1. Burkhoff D, Sugiura S, Yue DT, Sagawa K. Contractility-dependent curvilinearity of end-systolic pressure-volume relations. Am J Physiol Heart Circ Physiol 252: H1218–H1227, 1987 [DOI] [PubMed] [Google Scholar]
- 2. Chapman JB, Gibbs CL, Gibson WR. Effects of calcium and sodium on cardiac contractility and heat production in rabbit papillary muscle. Circ Res XXVII: 601–610, 1970 [DOI] [PubMed] [Google Scholar]
- 3. Gibbs CL. Role of catecholamines in heat production in the myocardium. Circ Res XX and XXI: III-223—III-230, 1967 [Google Scholar]
- 4. Gibbs CL, Chapman JB. Cardiac mechanics and energetics: chemomechanical transduction in cardiac muscle. Am J Physiol Heart Circ Physiol 249: H199–H206, 1985 [DOI] [PubMed] [Google Scholar]
- 5. Gibbs CL, Gibson WR. Effect of alterations in the stimulus rate upon energy output, tension development and tension-time integral of cardiac muscle in rabbits. Circ Res XXVII: 611–618, 1970 [DOI] [PubMed] [Google Scholar]
- 6. Gibbs CL, Gibson WR. Effect of ouabain on the energy output of rabbit cardiac muscle. Circ Res XXIV: 951–967, 1969 [DOI] [PubMed] [Google Scholar]
- 7. Gibbs CL, Mommaerts WFHM, Ricchiuti NV. Energetics of cardiac contractions. J Physiol 191: 25–46, 1967 [DOI] [PMC free article] [PubMed] [Google Scholar]
- 8. Goto Y, Slinker BK, LeWinter MM. Accuracy of volume measurement of rabbit left ventricle by balloon method. Am J Physiol Heart Circ Physiol 255: H394–H396, 1988 [DOI] [PubMed] [Google Scholar]
- 9. Hill AV. The absolute mechanical efficiency of the contraction of an isolated muscle. J Physiol 46: 435–469, 1913 [DOI] [PMC free article] [PubMed] [Google Scholar]
- 10. Ito H, Takaki M, Yamaguchi H, Tachibana H, Suga H. Left ventricular volumetric conductance catheter for rats. Am J Physiol Heart Circ Physiol 270: H1509–H1514, 1996 [DOI] [PubMed] [Google Scholar]
- 11. Khalafbeigui F, Suga H, Sagawa K. Left ventricular systolic pressure-volume area correlates with oxygen consumption. Am J Physiol Heart Circ Physiol 237: H566–H569, 1979 [DOI] [PubMed] [Google Scholar]
- 12. Kiriazis H, Gibbs CL. Effects of ageing on the activation metabolism of rat papillary muscles. Clin Exp Pharmacol Physiol 28: 176–183, 2001 [DOI] [PubMed] [Google Scholar]
- 13. Kiriazis H, Gibbs CL. Effects of aging on the work output and efficiency of rat papillary muscle. Cardiovas Res 48: 111–119, 2000 [DOI] [PubMed] [Google Scholar]
- 14. Kiriazis H, Gibbs CL. Papillary muscles split in the presence of 2,3-butanedione monoxime have normal energetic and mechanical properties. Am J Physiol Heart Circ Physiol 269: H1685–H1694, 1995 [DOI] [PubMed] [Google Scholar]
- 15. Kiriazis H, Gibbs CL, Kotsanas G, Young IR. Mechanical and energetic changes in short-term volume and pressure overload of rabbit heart. Heart Vessels 7: 175–188, 1992 [DOI] [PubMed] [Google Scholar]
- 16. Loiselle DS. The effects of temperature on the energetics of rat papillary muscle. Pflügers Arch 379: 173–180, 1979 [DOI] [PubMed] [Google Scholar]
- 17. Mast F, Elzinga G. Heat released during relaxation equals force-length area in isometric contractions of rabbit papillary muscle. Circ Res 67: 893–901, 1990 [DOI] [PubMed] [Google Scholar]
- 18. Mellors LJ, Gibbs CL, Barclay CJ. Comparison of the efficiency of rat papillary muscles during afterloaded isotonic contractions and contractions with sinusoidal length changes. J Exp Biol 204: 1765–1774, 2001 [DOI] [PubMed] [Google Scholar]
- 19. Nozawa T, Yasumura Y, Futaki S, Tanaka N, Igarashi Y, Goto Y, Suga H. Relation between oxygen consumption and pressure-volume area of in situ dog heart. Am J Physiol Heart Circ Physiol 253: H31–H40, 1987 [DOI] [PubMed] [Google Scholar]
- 20. Nozawa T, Yasumura Y, Futaki S, Tanaka N, Suga H. The linear relation between oxygen consumption and pressure-volume area can be reconciled with the Fenn effect in dog left ventricle. Circ Res 65: 1380–1389, 1989 [DOI] [PubMed] [Google Scholar]
- 21. Ricchiuti NV, Gibbs CL. Heat production in a cardiac contraction. Nature 208: 897–898, 1965 [DOI] [PubMed] [Google Scholar]
- 22. Saeki A, Goto Y, Hata K, Takasago T, Nishioka T, Suga H. Negative inotropism of hyperthermia increases oxygen cost of contractility in canine hearts. Am J Physiol Heart Circ Physiol 279: H2855–H2864, 2000 [DOI] [PubMed] [Google Scholar]
- 23. Suga H. Total mechanical energy of a ventricle model and cardiac oxygen consumption. Am J Physiol Heart Circ Physiol 236: H498–H505, 1979 [DOI] [PubMed] [Google Scholar]
- 24. Suga H. Ventricular energetics. Physiol Rev 70: 247–277, 1990 [DOI] [PubMed] [Google Scholar]
- 25. Suga H, Goto Y, Nozawa T, Yasumura Y, Futaki S, Tanaka N. Force-time integral decreases with ejection despite constant oxygen consumption and pressure-volume area in dog left ventricle. Circ Res 60: 797–803, 1987 [DOI] [PubMed] [Google Scholar]
- 26. Suga H, Goto Y, Yasumura Y, Nozawa T, Futaki S, Tanaka N, Uenishi M. Oxygen-saving effect of negative work in dog left ventricle. Am J Physiol Heart Circ Physiol 254: H34–H44, 1988 [DOI] [PubMed] [Google Scholar]
- 27. Suga H, Hayashi T, Shirahata M. Ventricular systolic pressure-volume area as predictor of cardiac oxygen consumption. Am J Physiol Heart Circ Physiol 240: H39–H44, 1981 [DOI] [PubMed] [Google Scholar]
- 28. Suga H, Hayashi T, Shirahata M, Suehiro S, Hisano R. Regression of cardiac oxygen consumption on ventricular pressure-volume area in dog. Am J Physiol Heart Circ Physiol 240: H320–H325, 1981 [DOI] [PubMed] [Google Scholar]
- 29. Suga H, Hayashi T, Suehiro S, Hisano R, Shirahata M, Ninomiya I. Equal oxygen consumption rates of isovolumic and ejecting contractions with equal systolic pressure-volume areas in canine left ventricle. Circ Res 49: 1082–1091, 1981 [DOI] [PubMed] [Google Scholar]
- 30. Suga H, Hisano R, Goto Y, Yamada O, Igarashi Y. Effect of positive inotropic agents on the relation between oxygen consumption and systolic pressure volume area in canine left ventricle. Circ Res 53: 306–318, 1983 [DOI] [PubMed] [Google Scholar]
- 31. Suga H, Hisano R, Hirata S, Hayashi T, Yamada O, Ninomiya I. Heart rate-independent energetics and systolic pressure-volume area in dog heart. Am J Physiol Heart Circ Physiol 244: H206–H214, 1983 [DOI] [PubMed] [Google Scholar]
- 32. Suga H, Sagawa K. Assessment of absolute volume from diameter of the intact canine left ventricular cavity. J Appl Physiol 36: 496–499, 1974 [DOI] [PubMed] [Google Scholar]
- 33. Suga H, Sagawa K. End-diastolic and end-systolic ventricular volume clamper for isolated canine heart. Am J Physiol Heart Circ Physiol 233: H718–H722, 1977 [DOI] [PubMed] [Google Scholar]
- 34. Suga H, Sagawa K, Shoukas AA. Load independence of the instantaneous pressure-volume ratio of the canine left ventricle and effects of epinephrine and heart rate on the ratio. Circ Res 32: 314–322, 1973 [DOI] [PubMed] [Google Scholar]
- 35. Suga H, Yamada O, Goto Y, Igarashi Y. Oxygen consumption and pressure-volume area of abnormal contractions in canine heart. Am J Physiol Heart Circ Physiol 246: H153–H160, 1984 [DOI] [PubMed] [Google Scholar]
- 36. Suga H, Yasumura Y, Nozawa T, Futaki S, Igarashi Y, Goto Y. Prospective prediction of O2 consumption from pressure-volume area in dog hearts. Am J Physiol Heart Circ Physiol 252: H1258–H1264, 1987 [DOI] [PubMed] [Google Scholar]
- 37. Taberner AJ, Han JC, Loiselle DS, Nielsen PMF. An innovative work-loop calorimeter for in vitro measurement of the mechanics and energetics of working cardiac trabeculae. J Appl Physiol 111: 1798–1803, 2011 [DOI] [PubMed] [Google Scholar]
- 38. Weber E. Muskelbewegung, Wagner's Handwörterbuch der Physiologie mit Rücksicht auf physiologische Pathologie. Band 3. Teil 2., Vieweg, p. 100–123, 1846 [Google Scholar]


