

Abstract
Earlier studies on electron transfer (ET) from the nitrogenase Fe protein to the MoFe protein concluded that the mechanism for ET changed during cooling from 25°C to 5°C, based on the observation that the rate constant for Fe protein to MoFe protein ET decreases strongly, with a non-linear Arrhenius plot. They further indicated that the ET was reversible, with complete ET at ambient but with an equilibrium constant near unity at 5°C. These studies were carried out with buffers having a strong temperature coefficient. We have examined the temperature variation in the kinetics of oxidation of the Fe protein by the MoFe protein at constant pH = 7.4 fixed by the buffer MOPS, which has a very small temperature coefficient. Using MOPS, we also observe temperature dependent ET rate constants, with non-linear Arrhenius plots. But, we find that ET is gated across the temperature range by a conformational change that involves the binding of numerous water molecules, consistent with an unchanging ET mechanism. Furthermore, there is no sKIE throughout the temperature range studied, again consistent with an unchanging mechanism In addition, the non-linear Arrhenius plots are explained by the change in heat capacity caused by the binding of waters in an invariant gating ET mechanism. Together, these observations contradict the idea of a change in ET mechanism with cooling. Finally, the extent of ET at constant pH does not change significantly with temperature, in contrast to the previously proposed change in ET equilibrium.
Introduction
Nitrogenase catalyzes the multi-electron reduction of dinitrogen (N2) to two ammonia (NH3), a reaction that is the major contributor to N2 fixation in the biosphere.(1)The enzyme comprises two component proteins, called the Fe protein and the MoFe protein, which associate and dissociate each time an electron is delivered from the Fe protein to the MoFe protein, which contains the catalytically active FeMo-cofactor, [7Fe, Mo, 9S; C; homocitrate].(2–4) This process of electron transfer (ET) from Fe to MoFe protein can be summarized by the deceptively simple kinetic scheme of Eq 1: the reduced Fe protein with two bound ATP [Fered(MgATP)2] rapidly forms an activated complex with the MoFe protein, where the rate constant for binding is k1 and that for dissociation is k−1,
| (1) |
ET from the Fe protein to the MoFe protein then creates a one-electron reduced MoFe protein denoted MoFered. This forward ET is characterized by a single ET rate constant k2; the possibility of reverse ET is incorporated by inclusion of rate constant k−2.
A key challenge in defining the mechanism of nitrogenase is to understand the steps in the kinetic scheme of eq 1 at a detailed molecular level. The process begins when the ATP-bound Fe protein with a reduced [4Fe-4S] cluster docks to the MoFe protein, Fig 1. The subsequent intracomplex ET from the Fe protein to the MoFe protein was shown to be gated in a study that employed variations in viscosities/osmotic pressures.(5) The variation of the ET rate constant with osmotic pressure showed that ~80 waters bind to the protein surfaces during the reaction. This binding induces conformational changes to the MoFe protein that initiate `gated' electron transfer (ET)(6, 7) within the MoFe protein, from the P cluster [8Fe-7S] to FeMo-cofactor.(5) This process in turn creates an electron `deficit' on the P cluster, which is back-filled by rapid electron transfer from the Fe protein to the oxidized P cluster.
Fig 1.
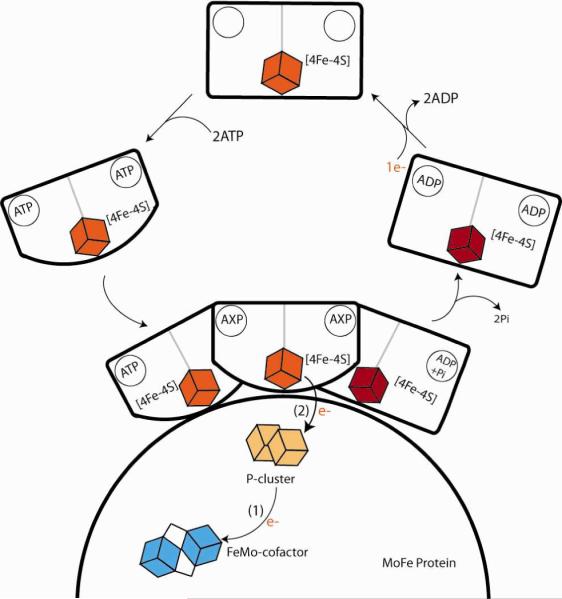
Events proposed as occurring at the interface of the MoFe protein and the Fe protein as the latter delivers an electron to the former. Here MoFe protein is represented by the semi-circle. The Fe protein (coming in from the left) binds two ATPs. The binding of ATP to the Fe protein causes conformational changes in the Fe protein which bring the [4Fe-4S] cluster closer to the surface of the protein.Conformational changes subsequent to binding `gate' the conversion to an ET-active state. As the order of ET and ADP hydrolysis is uncertain, in this state the nucleotide is written`AXP'. The final step is the departure of the Fe protein (right).
X-ray crystal structures of MoFe protein:Fe protein complexes have been solved in various states of nucleotide binding.(8, 9) From these structures, it is clear that the Fe protein exhibits major conformational differences in different nucleotide-bound states, and that it binds at different sites on the surface of the MoFe protein in the different states, suggesting that motion between sites is involved in the gating and inspiring the scheme implied in Fig 1. However, these structures do not show any differences within the MoFe protein, thus leaving open the nature of the motions within the MoFe protein that contribute to the gated ET.(10)(11, 12)
This ET process, which has been termed “deficit spending”,(13) is linked to the hydrolysis of two ATP molecules bound to the Fe protein. Although ATP hydrolysis may well follow the ET reaction, in analogy to other NTPases,(14) the order of electron transfer and ATP hydrolysis has not been clearly established,(2, 15, 16) and so in Fig 1 the state of the nucleotide in the ET-active conformation is not specified (X = T or D). The absence of a solvent kinetic isotope effect (sKIE)(5) at ambient temperature implied that ATP hydrolysis, which should be slowed by the presence of D versus H, is not involved in the rate-limiting step of ET.
Equation 1 is written as though the ET step is reversible. Although ET is quantitative at ambient temperature, previous studies found that the absorbance change associated with the oxidation of Fered by MoFe protein (ΔA) decreases as the temperature is lowered.(2, 16) This was interpreted as indicating that ET is an equilibrium process, with an equilibrium constant at ambient temperature that is large, K2 = k2/k72 ⪢ 1, corresponding to quantitative ET, but that decreases to K2 ~ 1 at 5°C. If ET is indeed reversible, then either it precedes ATP hydrolysis, or the hydrolysis also must be reversible.
A number of studies investigated the temperature dependence of ET as a means of exploring mechanism.(2, 16, 17) They suggested that the actual mechanism of ET from the Fe protein to the MoFe protein changes upon cooling. Thus, a non-linear Arrhenius plot of the observed ET rate constant versus inverse temperature was interpreted as having a `break' at ~14–16°C, and used as the basis for a suggestion that one mechanism operates at higher temperatures, another at lower, each with a characteristic activation enthalpy. The proposal of a change in mechanism was supported by stopped-flow (SF) isothermal calorimetry (ITC) measurements, which were interpreted as showing that in the low-temperature regime the hydrolysis of ATP precedes the electron transfer event, whereas at ambient temperature the ET event occurs prior to ATP hydrolysis.(16)
Here, we have re7examined the temperature variations at constant pH in the extent and rate constants for oxidation of the Fe protein by the MoFe protein within the pre-formed complex, and have tested for the persistence of gating at low temperature and for the appearance of an sKIE on ET. Our findings show that the ET mechanism does not change during cooling at constant pH.
Materials and Methods
All reagents for these experiments were purchased from Sigma-Aldrich Chemicals (St. Louis, MO). Wild type MoFe protein was expressed in Azotobacter vinelandii strain DJ995, while wild type Fe protein was obtained from strain DJ884 grown as described previously.(18) MoFe protein purification was performed using previously described metal affinity chromatography method due to the seven-histidine tag on the α-subunit of the protein while Fe protein was purified, with some modifications, using ion exchange and size exclusion as previously described.(18, 19) Both proteins utilized in these experiments were found to be of greater than 95% purity based on SDS-PAGE analysis using Coomassie blue staining. Septum sealed degassed vials, under an argon atmosphere were used to determine the activity of the proteins. The wild type Fe protein activity was found to be ~1750 nmols while the wild type MoFe protein activity was found to be ~2100 nmols. Both activities were similar to previously reported values for the activity of these proteins.(20) All liquids were transferred using gastight syringes.
The increase in absorbance at 430 nm was monitored to follow the ET event from the Fe protein to the MoFe protein. This increase in absorbance occurs due to the Fe protein's oxidation by one electron from its reduced (1+) state to the (2+) state; there is no significant accompanying change in aborbance of the MoFe protein. The change of absorbance as a function of time after the mixing of the two proteins was observed using a Hi7Tech SF61 stopped flow (SF) UV-visible spectrophotometer equipped with data acquisition software (Salisbury, Witts, U.K.). The SF unit of the spectrophotometer was housed inside a nitrogen filled glovebox. The temperature during the experiments was controlled by a circulating water bath housed outside the glove box.(21) All reactions, except for the change in temperature experiments, were carried out at 25°C. Differing buffer systems, HEPES and MOPS, pH 7.4 were used with 10mM dithionite. Due to the change in pH with temperature in the HEPES buffer, MOPS was utilized for the temperature dependency experiments to keep the pH constant.(22) During the SF experiments Fe and MoFe protein were contained in one drive syringe of the unit while the other syringe contained MgCl2 and ATP. Both syringes contained buffer (HEPES/MOPS 100mM pH 7.4) and 10mM dithionite. The dead time of the Hi-Tech SF61 SF system is 2 ms.
In the present experiments, the formation of the [Fered(MgATP*)2; MoFe] complex is essentially quantitative and complete within the deadtime of the experiment. Thus, the SF trace monitors the intra-complex oxidation, Fered → Feox, by MoFe protein, the second step in Eq 1. In the SF experiment, the absorbance of the mixed solutions prior to Fered → Feox oxidation is obtained with a non-reactive `push' in which ATP is omitted, then the instrument output is `nulled' by subtraction of this absorbance. As a result, the SF traces represent the time-variation of the absorbance-difference caused by reaction, relative to that of the initial mixed, unreacted solution.
Previous studies typically obtained the rate constant for the oxidation of Fered, denoted here kobs, by fitting the initial portion of the SF traces with an exponential rise-to-maximum.(2, 16, 17) (5) However, as can be seen in the data presented below (Fig 2) and in SI, the SF traces for the oxidation of Fered by MoFe protein in general have a more complex shape, which indicates that the oxidation of Fered is followed by a slower reaction to a state with a smaller absorbance-difference. Haaker and coworkers attribute this follow-up reaction to hydrolysis of ATP. Alternatively, we suggest this may represent a partial re-reduction of the resulting Feox back to Fered that occurs as part of a complex set of reactions that involves dissociation of Feox, re-reduction to Fered, and re-binding to MoFe.(23)
Figure 2.

Temperature-response stopped-flow traces for oxidation of Fered within [Fered (MgATP)2;MoFe] complex in H2O and D2O buffers. Top: H2O, Bottom: D2O. Plots are labeled with the temperature (°C) from 25°C to 5°C in the respective color of the traces. White lines through each trace are fits as described inMaterials and Methods.
In this report we are interested only in the rate constant and absorbance-difference associated with the initial intra-complex oxidation, Fered → Feox, by MoFe protein. As shown in SI, neither of these parameters is accurately derived with a rise-to-maximum fit if the followup phase of the SF trace is appreciable, so we have employed the simplest possible kinetic model to treat the observed traces. We find that the overall traces can be well-modeled by a kinetic scheme that includes two sequential first-order reactions, Eq 2,
| (2) |
the first representing the initial oxidation of Fered by MoFe protein, the second a followup reaction to an unspecified state, denoted C. This model leads to an equation for the resolved time-course of the absorbance difference, ΔA(τ), given by Eq 3:
| (3) |
where τ = t − tDT, with tDT being the time at which mixing artifacts have subsided (dead-time). In this equation, kobs is the rate constant for the oxidation of Fered by MoFe protein, and kDr is the rate constant for the follow-up process. This equation takes into account possible reaction during the dead-time leading to an absorbance-difference, ΔAo, As a result of such a phenomenon, the total absorbance-difference associated with the first-step intracomplex oxidation of Fered (Eq 2), denoted here ΔA, equals the absorbance change associated with the initial oxidation step in the resolved phase of Eq 3, ΔAr, plus the absorbance change from the portion of the oxidation reaction that occurs during the dead-time, ΔAo: ΔA = ΔAo + ΔAr. As incorporated into Eq 3, State C is characterized by a net absorbance-difference, ΔADr, relative to the initial state. In the Results section we discuss only the parameters associated with the initial oxidation of Fered by MoFe protein: kobs and ΔA; for completeness only, values for the parameters associated with the unspecified followup process, kDr and ΔADr, are given in SI.
As discussed in detail in the SI, the fits to Eq 3 give as much as a two-fold smaller rate constant, kobs, than a rise-to-maximum fit. However, we note that such trends as changes with temperature or osmotic pressure, which are the focus of this work, are comparably represented by the two approaches (Fig S1).
Results and Analysis
Influence of temperature and solvent isotope on ET
Figure 2 shows the SF traces at different temperatures for the oxidation of Fered by the MoFe protein in H2O (top) and D2O (bottom) solutions with MOPS as the buffer. As this buffer has a negligible temperature coefficient of pKa vs T,(22) these measurements thus are carried out with essentially invariant pH = pD = 7.4 over the temperature range, 25 – 5°C. As discussed in Materials and Methods, at temperatures above 5°C the absorbance changes associated with the initial oxidation of Fered by MoFe do not show a simple rise-to-maximum; the initial absorbance increase is followed by a decrease in absorbance associated with re-reduction of Fered or the change in absorbance of Feox due to hydrolysis of ATP. To obtain the rate constants for the initial Fered oxidation, the traces were fit to a sequential model in which the oxidation of Fered is followed by a slower re-reduction process, as described in Materials & Methods. In discussing these results, we consider only the rate constants and absorbance changes associated with the initial Fered oxidation.
To test for the congruence of the current results to those reported earlier, the traces of Fig 2 were truncated and fit to a rise-to-maximum. As mentioned in Materials and Methods and shown in SI, such fits typically give larger values for kobs, in keeping with those reported earlier,(2, 16, 17) but the trends with temperature are completely equivalent, Fig S1. Thus, trends reported in this study can be appropriately compared to those in earlier reports. However, we believe that the magnitudes of kobs based on fits to Eq 3 which are notably lower than earlier values, are more appropriate.
The temperature responses of the rate constants and absorbance changes associated with the initial Fered oxidation for D2O and H2O solutions (MOPS pH = pD = 7.4), denoted kobs and ΔA, are plotted, respectively, in Fig 3 and Fig 4. The observed ET rate constants decrease strongly with temperature (Fig 3), and the kobs values for H2O and D2O solutions with MOPS are the same within experimental error. The finding that kobs(H2O) = kobs(D2O) at ambient temperature confirms our earlier report that there is no sKIE at 25°C; the equivalence of the rate constants at all temperature shows that an sKIE does not emerge upon cooling.
Figure 3.
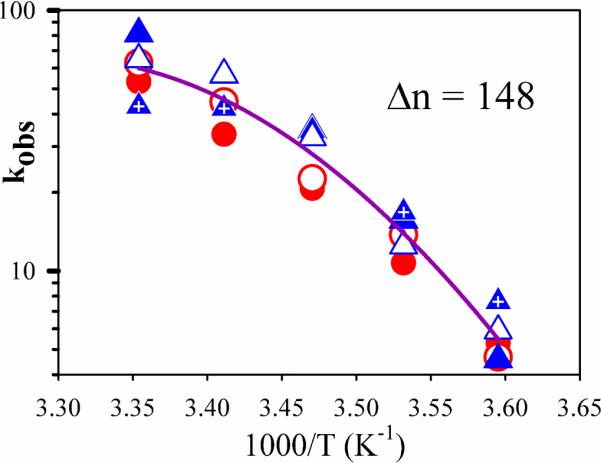
Semi-logarithmic plot of the observed rate constants, kobs for D2O (blue symbols) and H2O (red symbols). Individual experiments are visualized by open, closed, or crossed points. Purple solid line is a fit to all data sets, assuming that there is no difference in kobs for H2O and D2O buffers.
Figure 4.
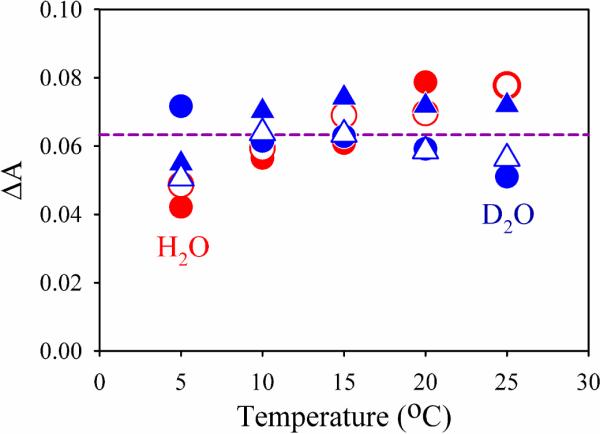
Temperature dependence of absorbance changes ΔA, (Eq 3) obtained from intracomplex oxidation of Fered(ATP)2 by MoFe as a function of temperature. Purple dashed line is the average of all values.
Temperature dependent ET equilibrium?
Thorneley et. al. reported that the absorbance change (ΔA) associated with Fered → MoFe ET in H2O buffer diminishes with decreasing temperature,(2) a finding corroborated by Mensink and Haaker.(16) The absorbance decrease was interpreted in terms of a temperature dependence of an ET equilibrium between the two proteins, as represented by the second step of Eq 1. It was proposed that ET was essentially quantitative at 25°C, k2 ⪢ k72 (Eq 1), but by 5°C only ~50% of the complexes showed ET (k2 ≈ k72).
There are multiple reasons for concern about these conclusions. First, the experiments were carried out with solutions that used TES/NaOH buffer, and as a result were not performed at constant pH as the temperature was lowered. TES buffers have a large temperature coefficient,(22) causing an increase in pH from 7.4 to ~ 7.7 as the temperature is lowered from 25°C to 5°C. Second, the kinetic traces were fit to a simple rise-to-maximum function, which does not necessarily give a good representation of the maximum absorbance change when the reaction involves more than one stage (Eq 1). In particular, as has been reported, the kinetic traces often show a rise-to-maximum, slight fall, then slow rise.(2)
We thus analyzed the temperature dependence of the absorbance changes associated with the ET kinetics measurements discussed above. Fig 4 shows that these absorbance changes fluctuate appreciably from one experiment to the next, even though the kinetic constants do not (Fig 3). However, within the error of our measurements the absorbance changes with MOPS as buffer are the same for H2O and D2O solutions, and are invariant with temperature; the same is true for the absorbance changes obtained from rise-to-maximum fits (Fig S2). We tested whether the implied constancy in the extent of ET is modified by a change with cooling of the difference between the extinction coefficients of oxidized and reduced Fe protein, Δε = ε(Feox) - ε(Fered). As shown in Fig S3 within error, this difference is temperature invariant down to 5°C. We thus interpret the results of Fig 4 as showing that the quantitative ET in MOPS buffer at pH 7.4 is essentially unchanged during cooling at constant pH from 25°C to 5°C. In the description of nitrogenase ET given by Eq 1, the observed ET rate constant is related to the microscopic rate constants by, kobs = k2 + k−2. However, when ET is quantitative, the ET rate constants obey the inequality, k2 ⪢ k−2, and thus we may assign kobs = k2 throughout the temperature range examined.
To test whether the previously reported temperature response of ΔA associated with Fered → MoFe ET in H2O buffer could be attributed to a change in pH upon cooling, the temperature dependence of ET was reexamined using samples prepared with HEPES/H2O buffer (Fig S4). HEPES has a temperature coefficient similar to that of TES, used by Haaker and coworkers; with HEPES as buffer the pH increases from 7.4 to ~ 7.8 as the temperature is lowered from 25°C to 5°C. As shown in Fig S5, the absorbance change associated with Fered → MoFe protein ET for H2O solutions of HEPES buffer indeed drops by roughly 50% from 25 to 5°C, whereas the absorbance change does not decrease for the D2O solutions of HEPES buffer (Fig S4), and if anything increases slightly with decreasing temperature. The differing behavior for the H2O and D2O solutions with HEPES presumably reflect an equilibrium isotope effect on the pH dependence of the extent of ET. This inference is supported by measurements over a range of pH values in HEPES buffer, all carried out at 5°C (Fig S6 and S7). These show that kobs does not change significantly with pH for either buffer; there is a substantial variation in ΔA with pH for the H2O buffers, but negligible change for the D2O buffers.
Gating at Low Temperature?
To reveal if conformational gating of ET from the Fe protein to the MoFe protein persists at temperatures below the apparent break temperature (Tb ~ 14°C–16°C) as concluded in earlier studies, we examined the influence of osmolytes on kobs for ET at 6°C. Sucrose, glycerol, and glucose were studied as osmolytes because they generated the strongest, intermediate, and weakest effects seen at ambient temperatures.(5) As illustrated for sucrose as solute in Fig 5, inset, progressive additions of each osmolyte cause progressive decreases in kobs at 6°C, thus indicating that ET is under conformational control at this low temperature as well as at ambient temperatures. Given the observed control of ET by osmotic pressure effects at 6°C as well as at 25°C, we conclude that the gating mechanism that controls ET persists throughout the temperature range.
Figure 5.

Plot of the solute-dependent osmotic effect on nitrogenase.Black = glycerol, red = glucose,blue = sucrose. Points and solid lines represent results at 6°C; dashed lines represent the previously published results at 25°C; glycerol alone could be examined to higher m and the additional points are shown in Fig S1. Inset: Stopped-flow oxidation of Fered within [Fered(MgATP)2:MoFe] complex with increasing amounts of sucrose.
Changes in osmotic pressure modulate the energetics of reactions that change the number of bound waters. The rate constant for such a process varies exponentially with the molality of added solute (m) according to the equation,(24) k(m) ∝ exp[−Δn/55.6)m], where Δn is the number of waters absorbed in the transformation. Logarithmic plots of kobs at 6°C vs molality for each solute employed are linear, as they are at ambient, Fig 5, revealing that the osmotic pressure effects that control ET at ambient persist at reduced temperatures. This linearity persists to higher osmolalities, as shown in Fig S8. The slopes of these lines, which differ for the different osmolyes, reflect the numbers of waters absorbed during ET: slope = −(Δn/55.6). At 25°C, Δn = 50–80 for the three osmolytes; at 5°C, Δn = 30–50. The decreased values of Δn at 6°C suggest that the osmolytes interact more strongly with the surface as the temperature is decreased.
The absence of an H2O vs. D2O solvent kinetic isotope effect (sKIE) for ET between the Fe protein and the MoFe protein at 6°C indicates that ATP hydrolysis is not rate limiting at low temperatures, just as it is not rate limiting at 25°C. In combination with the unchanging osmotic pressure effects over the temperature range, the results indicate that the order of the ATP hydrolysis event is unaffected by the change in temperature, and are consistent with there being no change in the mechanism with changing temperature. This conclusion is contrary to the earlier ITC findings that ATP hydrolysis precedes electron transfer at lower temperatures.
Does the temperature variation of kobs imply a change of mechanism?
The Arrhenius plots of ln(kobs) vs 1/T presented in Fig 3 for solutions carried out with both H2O and D2O MOPS solutions are non-linear, consistent with earlier findings for experiments carried out with H2O buffer solutions.(2, 17) The earlier work interpreted this nonlinearity to indicate a change in ET mechanism as the temperature is lowered from ambient. Those temperature variations were analyzed in terms of an apparent `break' at Tb ~ 14°C-16°C that separates two linear segments in the plots of ln(kobs) vs 1/T. Each segment was fit to its own slope, (−ΔH†/R); each temperature range was assigned a different mechanism with a characteristic enthalpy of activation, ΔH†, that is constant over the range. However, a real `break' in slope is not possible for a finite system.(25) Instead, our finding that waters become bound to the protein-protein complex during the ET process requires that the Arrhenius plot be curved, even though the mechanism does not change. The binding of Δn waters during the ET reaction causes a change in the heat capacity, ΔCp, which one can approximate as, ΔCp ~ Δn[Cpm(ice) − Cpm(liquid)] ~ Δn[− 37J/K*mol]. This heat capacity difference in turn makes the enthalpy change, associated with the ET event temperature dependent, which induces curvature into the Arrhenius plot.
Taking the ET reaction as being governed by a conformational gating process that involves water binding,(5) we now show that the temperature variation of the ET rate constant kobs = k2 can be described with a single set of thermodynamic parameters over the entire range of temperatures examined. Taking as a reference temperature that of the apparent `break', Tb, one can write the enthalpy change for the ET reaction at any temperature within this range as the sum of a termperature-independent enthalpy change, ΔH(Tb), plus the temperature-dependent contribution associated with water binding,(26)
| (4) |
A Gibbs-Helmholtz equation for kobs then leads to a temperature dependence, Eq 5.(26)
| (5) |
As shown in Fig 3, the combined temperature responses of kobs in H2O and D2O buffers are indeed well described by the continuous function, Eq 5, with a single set of enthalpic parameters, ΔH(Tb) and ΔCp, and thus by a single mechanism.
The resulting constant contribution to the enthalpy change, ΔH(Tb) = 130 kJ*mol−1, of Eq 5, is roughly the average of the values that would be obtained from a partition of the experimental data into two linear segments, with separate fits for each segment. The value, ΔCp = −5.5 kJ*mol−1*K−1, corresponds to the uptake of Δn ~ +150 waters. Although Δn is considerably larger than Δn as determined in the osmotic pressure measurements, given that the latter suggest that Δn may change with T and the simplified form of Eq 4, we take the osmotic pressure measurements and temperature dependence of the ET rate constants as being satisfactorily self-consistent.
Discussion
In this report, we have examined the temperature variation in the kinetics of oxidation of the Fe protein by the MoFe protein and tested for osmotic pressure effects and sKIE. The reported findings can be summarized as follows. (i) As the temperature is lowered from 25 to 5°C at a constant pH fixed by MOPS buffer, the observed rate constant for Fered → MoFe protein ET decreases strongly, but with a non-linear Arrhenius plot, consistent with previous reports that employed buffers with high temperature coefficients. (ii) ET remains gated at the lowest temperature by a conformational change that involves the binding of numerous water molecules, and cooling does not introduce a solvent kinetic isotope effect (sKIE). (iii) These observations contradict the earlier proposals of a change in ET mechanism with cooling. (iv) In support of this mechanistic invariance, it is shown that the nonlinear Arrhenius plot for the ET rate constant arises from the change in heat capacity associated with the binding of waters, and does not indicate a change in mechanism. (v) Finally, it is shown that the Fe protein to MoFe protein extent of ET at constant pH does not change substantially with temperature, in contrast to the changing ET equilibrium inferred previously from experiments where cooling is accompanied by an increase in pH. Overall, these findings address multiple issues associated with inter-component oxidation of Fered by MoFe and overturn some long-held views about this process.
Our earlier study of intracomplex ET at ambient temperature employed the addition of viscogen/osmolyte solutes to reveal that the process is gated and responds to osmotic pressure effects, not changes in viscosity.(5) The changes in kobs with osmolality were interpreted as reflecting the binding of Δn = ~50–80 waters during ET, and it was inferred that this is associated with motions at the Fe-MoFe protein interface. We here show that osmotically controlled gating persists to 5°C. The osmolality dependence of kobs at 5°C indicates that somewhat fewer waters bind upon cooling, Δn = +30–50, a result that may be attributed to an increased interaction of osmolytes with protein surfaces at the lower temperatures.
The finding that ET remains gated down to the lowest temperature examined, along with the finding that ET is independent of solvent isotopic composition over the entire temperature range, suggests that the ET mechanism does not change upon cooling. Moreover, the observed osmotic pressure dependence provides the foundation for the explanation of the non-linear Arrhenius plots of kobs in terms of a single, unchanging mechanism. The proposed analysis in terms of two linear segments that intersect at a `break' temperature of 15°C that separates two temperature regions in which different mechanisms operated,(16, 17) is thermodynamically untenable, while the finding that waters become bound during ET requires that the Arrhenius plot be nonlinear even without a change in mechanism. When waters bind during the reaction, the enthalpy of activation, ΔH†, becomes temperature dependent because the heat capacity is different for free and bound waters (Eq 4). Application of the Gibbs-Helmholtz equation to the ET rate constant then necessarily yields a non-linear Arrhenius plot, Eq 4. As shown in Fig 3, the temperature response of kobs can be well described by a fit to Eq 5, with a plausible value for the number of waters bound during ET. This eliminates the basis of the earlier suggestions for a change in mechanism.
This report further gives an alternative explanation to earlier reports that the extent of ET decreases from ~ 100% at ambient temperature to ~ 50% as the temperature decreases to ~ 5°C. The present experiments carried out with MOPS, a buffer whose pKa changes negligibly with temperature, indicate that at constant pH the extent of ET does not change within error upon cooling from 25 to 5 °C, and that this invariance is independent of solvent isotope (H/D). Thus, our measurements indicate that the extent of ET at constant pH is not temperature dependent.
We do corroborate the finding that the extent of ET does change upon cooling of solutions prepared with buffers with a large temperature coefficient (HEPES buffer in our experiments, TES buffer in previous work). The pH changes by roughly 0.5 units upon cooling these buffer solutions to 5°C, and thus the changes in behavior upon cooling can be assigned not to the temperature variation of ET but to a pH dependence of the extent of ET at 5°C, which has been observed explicitly (SI). A determination of the origin of this dependence is beyond the scope of this report.
Conclusions
The `deficit spending' mechanism for Fered → MoFe protein ET mechanism that operates at ambient temperature does not change upon cooling to 5°C at constant pH. This mechanism likely is associated in some part with motions at the interface between the two proteins of the type schematized in Fig 1. The change in heat capacity caused by binding of waters during the ET process leads to a non-linear Arrhenius plot of the rate constant for ET versus inverse temperature, invalidating earlier interpretations of this non-linearity in terms of a change in ET mechanism. The extent of ET observed at ambient temperature does not change during cooling at constant pH, but likely varies with pH at constant, low temperature, where it also depends on solvent isotope. The origin of this last effect, suggestive of an equilibrium solvent isotope effect, remains to be determined.
Supplementary Material
Acknowledgments
This work has been supported by the NIH (HL 13531, BMH; GM 59087, DRD and LCS)
Abbreviations
- ET
Electron transfer
- sKIE
Solvent kinetic isotope effect
- SF
Stopped-flow
Footnotes
Supporting Information Available: Ten figures that present additional experimental data; one chart that addrsses analysis procedures. This material is available free of charge via the Internet at, http://pubs.acs.org.
Citations
- (1).Smil V. Enriching the Earth: Fritz Haber, Carl Bosch, and the Transformation of World Food Production. MIT Press; Cambridge, MA: 2001. [Google Scholar]
- (2).Thorneley RNF, Ashby G, Howarth JV, Millar NC, Gutfreund H. A transient-kinetic study of the nitrogenase of Klebsiella pneumoniae by stopped-flow calorimetry. Comparison with the myosin ATPase. Biochem. J. 1989;264:657–661. doi: 10.1042/bj2640657. [DOI] [PMC free article] [PubMed] [Google Scholar]
- (3).Burgess BK, Lowe DJ. Mechanism of molybdenum nitrogenase. Chem. Rev. 1996;96:2983–3011. doi: 10.1021/cr950055x. [DOI] [PubMed] [Google Scholar]
- (4).Wilson PE, Nyborg AC, Watt GD. Duplication and extension of the Thorneley and Lowe kinetic model for Klebsiella pneumoniae nitrogenase catalysis using a MATHEMATICA software platform. Biophys. Chem. 2001;91:281–304. doi: 10.1016/s0301-4622(01)00182-x. [DOI] [PubMed] [Google Scholar]
- (5).Danyal K, Mayweather D, Dean DR, Seefeldt LC, Hoffman BM. Conformational gating of electron transfer from the nitrogenase Fe protein to MoFe protein. J. Am. Chem. Soc. 2010;132:6894–6895. doi: 10.1021/ja101737f. [DOI] [PMC free article] [PubMed] [Google Scholar]
- (6).Hoffman BM, Ratner MR. Gated electron transfer: when are observed rates controlled by conformational interconversion? J. Am. Chem. Soc. 1987;109:6237–6243. [Google Scholar]
- (7).Hoffman BM, Ratner MA, Wallin SA. Energetics and dynamics of gated reactions: control of observed rates by conformational interconversion. In: Johnson MK, King RB, Kurtz DM Jr., Kutal C, Norton ML, Scott RA, editors. Advances in Chemistry Series. American Chemical Society; Washington, D.C.: 1990. pp. 125–146. [Google Scholar]
- (8).Tezcan FA, Kaiser JT, Mustafi D, Walton MY, Howard JB, Rees DC. Nitrogenase complexes: multiple docking sites for a nucleotide switch protein. Science (Washington, DC, U. S.) 2005;309:1377–1380. doi: 10.1126/science.1115653. [DOI] [PubMed] [Google Scholar]
- (9).Rees DC, Tezcan FA, Haynes CA, Walton MY, Andrade S, Einsle O, Howard JB. Structural basis of biological nitrogen fixation. Phil. Trans. R. Soc. A. 2005;363:971–984. doi: 10.1098/rsta.2004.1539. [DOI] [PubMed] [Google Scholar]
- (10).Although binding of water at an interface can enhance ET (refs 11 and 12), and thus may contribute to gating, we surmise it is the unknown motions within the MoFe protein that are most important here.
- (11).de la Lande A, Babcock NS, Rezac J, Sanders BC, Salahub DR. Surface residues dynamically organize water bridges to enhance electron transfer between proteins. Proc. Natl. Acad. Sci. U. S. A. 2010;107:11799–11804. doi: 10.1073/pnas.0914457107. [DOI] [PMC free article] [PubMed] [Google Scholar]
- (12).Keinan S, Nocek JM, Hoffman BM, Beratan DN. Interfacial hydration, dynamics and electron transfer: multi- scale ET modeling of the transient [Myoglobin, Cytochrome b5] complex. Phys. Chem. Chem. Phys. 2012 doi: 10.1039/c2cp41949a. in press. [DOI] [PMC free article] [PubMed] [Google Scholar]
- (13).Danyal K, Dean DR, Hoffman BM, Seefeldt LC. Electron transfer within nitrogenase: evidence for a deficit-spending mechanism. Biochemistry. 2011;50:9255–9263. doi: 10.1021/bi201003a. [DOI] [PMC free article] [PubMed] [Google Scholar]
- (14).Altenberg GA. Structure of multidrug-resistance proteins of the ATP-binding cassette (ABC) superfamily. Curr. Med. Chem.: Anti Cancer Agents. 2004;4:53–62. doi: 10.2174/1568011043482160. [DOI] [PubMed] [Google Scholar]
- (15).Lowe DJ, Ashby GA, Brune M, Knights H, Webb MR, Thorneley RNF. ATP hydrolysis and energy transduction by nitrogenase. In: Tikhonovich IA, Provorov NA, Romanov VI, Newton WE, editors. Nitrogen Fixation: Fundamentals and Applications. Kluwer Academic Publishers; 1995. pp. 103–108. [Google Scholar]
- (16).Mensink RE, Haaker H. Temperature effects on the magnesium-ATP- induced electron transfer between the nitrogenase proteins from Azotobacter vinelandii. Eur. J. Biochem. 1992;208:295–299. doi: 10.1111/j.1432-1033.1992.tb17186.x. [DOI] [PubMed] [Google Scholar]
- (17).Lanzilotta WN, Parker VD, Seefeldt LC. Electron transfer in nitrogenase analyzed by marcus theory: evidence for gating by MgATP. Biochemistry. 1998;37:399–407. doi: 10.1021/bi971681m. [DOI] [PubMed] [Google Scholar]
- (18).Christiansen J, Goodwin PJ, Lanzilotta WN, Seefeldt LC, Dean DR. Catalytic and biophysical properties of a nitrogenase apo-MoFe protein produced by a nifB-deletion mutant of Azotobacter vinelandii. Biochemistry. 1998;37:12611–12623. doi: 10.1021/bi981165b. [DOI] [PubMed] [Google Scholar]
- (19).Burgess BK, Jacobs DB, Stiefel EI. Large-scale purification of high activity Azotobacter vinelandii nitrogenase. Biochim. Biophys. Acta. 1980;614:196–209. doi: 10.1016/0005-2744(80)90180-1. [DOI] [PubMed] [Google Scholar]
- (20).Seefeldt LC, Morgan TV, Dean DR, Mortenson LE. Mapping the site(s) of MgATP and MgADP interaction with the nitrogenase of Azotobacter vinelandii. Lysine 15 of the iron protein plays a major role in MgATP interaction. J. Biol. Chem. 1992;267:6680–6688. [PubMed] [Google Scholar]
- (21).Lanzilotta WN, Fisher K, Seefeldt LC. Evidence for electron transfer from the nitrogenase iron protein to the molybdenum–iron protein without MgATP hydrolysis: Characterization of a tight protein–protein complex. Biochemistry. 1996;35:7188–7196. doi: 10.1021/bi9603985. [DOI] [PubMed] [Google Scholar]
- (22).Good NE, Winget GD, Winter W, Connolly TN, Izawa S, Singh RMM. Hydrogen ion buffers for biological research. Biochemistry. 1966;5:467–477. doi: 10.1021/bi00866a011. [DOI] [PubMed] [Google Scholar]
- (23).Thorneley RNF, Lowe DJ. Kinetics and mechanism of the nitrogenase enzyme system. In: Spiro TG, editor. Molybdenum Enzymes. Wiley-Interscience; New York: 1985. pp. 89–116. [Google Scholar]
- (24).Parsegian VA, Rand RP, Rau DC. Macromolecules and water: probing with osmotic stress. Methods Enzymol. 1995;259:43–94. doi: 10.1016/0076-6879(95)59039-0. [DOI] [PubMed] [Google Scholar]
- (25).An abrupt `break' in a plot such as that of Fig 4 would imply the existence of a 2nd order phase change, and could not actually occur in a molecular system.
- (26).If the ET rate constant corresponds to that for the conformational gate, then its temperature response is characterized by the activation enthalpy. If ET involves a conformational preequilibrium, then the temperature variation would be described by the sum of the enthalpy change for the gating equilibrium and the ET activation enthalpy. In either case, in a precise application of transition-state theory the ratio, [kobs (T)/kobs (Tb)] would be replaced by [Tb(kobs(T)/T(kobs (T)], but over the narrow range of temperatures examined, the parameters derived from such a fit differ insignificantly from that to the more intuitive Eq 5.
Associated Data
This section collects any data citations, data availability statements, or supplementary materials included in this article.