

Background: The functional significance of hemoglobin heterogeneity remains a mystery.
Results: In adult birds, the HbD isoform (related to embryonic hemoglobin) exhibits distinct oxygenation properties relative to the major HbA isoform.
Conclusion: Substitutions that distinguish HbD from HbA are not shared with embryonic hemoglobin.
Significance: Differences between isoforms stem from derived (nonancestral) changes in duplicated genes, not from the retention of an ancestral condition.
Keywords: Evolution, Hemoglobin, Molecular Evolution, Oxygen Transport, Protein Evolution, Avian Genome, Gene Family Evolution, Globin Gene Family
Abstract
The majority of bird species co-express two functionally distinct hemoglobin (Hb) isoforms in definitive erythrocytes as follows: HbA (the major adult Hb isoform, with α-chain subunits encoded by the αA-globin gene) and HbD (the minor adult Hb isoform, with α-chain subunits encoded by the αD-globin gene). The αD-globin gene originated via tandem duplication of an embryonic α-like globin gene in the stem lineage of tetrapod vertebrates, which suggests the possibility that functional differentiation between the HbA and HbD isoforms may be attributable to a retained ancestral character state in HbD that harkens back to a primordial, embryonic function. To investigate this possibility, we conducted a combined analysis of protein biochemistry and sequence evolution to characterize the structural and functional basis of Hb isoform differentiation in birds. Functional experiments involving purified HbA and HbD isoforms from 11 different bird species revealed that HbD is characterized by a consistently higher O2 affinity in the presence of allosteric effectors such as organic phosphates and Cl− ions. In the case of both HbA and HbD, analyses of oxygenation properties under the two-state Monod-Wyman-Changeux allosteric model revealed that the pH dependence of Hb-O2 affinity stems primarily from changes in the O2 association constant of deoxy (T-state)-Hb. Ancestral sequence reconstructions revealed that the amino acid substitutions that distinguish the adult-expressed Hb isoforms are not attributable to the retention of an ancestral (pre-duplication) character state in the αD-globin gene that is shared with the embryonic α-like globin gene.
Introduction
Hemoglobin (Hb) is one of the most extensively studied proteins in terms of structure-function relationships, and comparative studies of Hbs from non-human animals have made important contributions to this knowledge base (1–4). Despite this detailed understanding, a number of vexing questions about Hb function continue to challenge comparative biochemists and physiologists. One such question concerns the functional and adaptive significance of co-expressing multiple, structurally distinct Hb isoforms (isoHbs)2 (2, 5–9). Most vertebrate species express functionally distinct isoHbs during different stages of pre-natal development, and in many groups it is also common to co-express different isoHbs during postnatal life. The majority of birds and nonavian reptiles co-express two functionally distinct isoHbs in definitive erythrocytes as follows: HbA (the major adult isoHb, with α-chain subunits encoded by the αA-globin gene) and HbD (the minor adult isoHb, with α-chains encoded by the αD-globin gene). HbD typically accounts for ∼10–30% of total Hb in definitive erythrocytes, and available evidence indicates that it is generally characterized by an elevated O2 affinity relative to HbA (10–20).
Insights into the physiological division of labor between the HbA and HbD isoforms may help to explain why the duplicated αA- and αD-globin genes have been retained and why the adult expression of αD-globin has persisted in the majority of avian lineages. Because the HbA and HbD isoforms exhibit consistent differences in O2-binding properties, regulatory changes in intra-erythrocytic isoHb stoichiometry could provide a mechanism for modulating blood-O2 affinity in response to changes in O2 availability or changes in internal metabolic demand (11, 20, 21).
Another distinction between the two avian isoHbs is that tetrameric HbDs self-associate upon deoxygenation, which results in super-cooperativity (Hill coefficients >4.0) because higher order allosteric interactions between HbD tetramers are superimposed on the subunit-subunit interaction within tetramers (16, 22–24). In principle, the enhanced cooperativity could facilitate efficient O2 unloading over an especially narrow range of blood O2 tensions (25).
It is also possible that the physiological benefits of Hb heterogeneity are unrelated to O2-binding properties. If isoHbs with different isoelectric points co-occur in the same erythrocytes, then Hb heterogeneity may enhance solubility (and hence, corpuscular Hb concentration), thereby increasing the O2-carrying capacity of the blood (26–28). isoHbs with different charges would also indirectly influence the distribution of protons and other ions across the red cell membrane by altering the Donnan equilibrium, and this could play an important role in the allosteric regulation of Hb-O2 affinity and cellular metabolism (29, 30). These considerations led Ingermann (8) to conclude that it “…seems unlikely that the presence of electrophoretically distinguishable Hb multiplicity represents selectively neutral variations in Hb structure and function.”
Available evidence suggests that the tetrapod common ancestor possessed three tandemly linked gene duplicates that encode the α-chain subunits of the α2β2 Hb tetramer, 5′-αE–αD–αA-3′ (31–33). In the stem lineage of tetrapods, the proto-αE- and αA-globin genes originated via tandem duplication of an ancestral α-like globin gene, and αD-globin originated subsequently via tandem duplication of the proto-αE-globin gene (31). In tetrapod vertebrates, the αE-globin gene is exclusively expressed in larval/embryonic erythroid cells, and the αA-globin gene is expressed in definitive erythroid cells during later stages of prenatal development and postnatal life. In birds and nonavian reptiles that have been studied to date, the αD-globin gene is expressed in both primitive and definitive erythroid cells (34–36). HbD does not appear to be expressed in the definitive erythrocytes of crocodilians (37–39), and the αD-globin gene has been inactivated or deleted independently in amphibians and mammals (31, 40, 41).
Given that HbA and HbD share the same β-chain subunits, functional differences between the two isoHbs must be attributable to amino acid substitutions in the αA- and/or αD-globin genes. In light of what is known about the phylogenetic history of the α-like globin genes in tetrapods (31, 32), functional differentiation between the HbA and HbD isoforms may be attributable to post-duplication substitutions that occurred in the αA-globin and/or αD-globin gene lineages (Fig. 1, A–C), they could be attributable to substitutions that occurred in the single copy, pre-duplication ancestor of the αE- and αD-globin genes (Fig. 1D), or they could be attributable to a combination of pre- and post-duplication substitutions (Fig. 1, E and F). Because embryonic and adult-expressed Hbs exhibit a number of consistent functional differences (42), the scenarios depicted in Fig. 1, D–F, suggest the possibility that HbA/D isoform differentiation may be attributable to a retained ancestral character state in HbD that harkens back to a primordial, embryonic function. To investigate this possibility and to examine the functional evolution of the α-like globin genes, we conducted a combined analysis of protein biochemistry and sequence evolution to characterize the structural and functional basis of Hb isoform differentiation in birds. The main objectives were as follows: (i) to characterize the O2-binding properties of HbA and HbD in species that are representative of several major avian lineages; (ii) to gain insight into the structural basis of the observed functional differentiation between the HbA and HbD isoforms; and (iii) to determine whether functional differentiation between the HbA and HbD isoforms is primarily attributable to post-duplication substitutions or the retention of ancestral character states shared by HbD and embryonic Hb. Functional experiments involving purified HbA and HbD isoforms from 11 different bird species confirmed that HbD is characterized by a consistently higher O2 affinity in the presence of allosteric effectors such as organic phosphates and Cl− ions. Results of the comparative sequence analysis revealed that isoHb differentiation is attributable to roughly equal numbers of post-duplication amino acid substitutions that occurred in the αA- and αD-globin genes.
FIGURE 1.

Hypothetical scenarios depicting the phylogenetic distribution of amino acid substitutions that are responsible for functional differentiation between the co-expressed HbA and HbD isoforms in birds. The phylogeny represented in each panel depicts the known branching relationships among the αA-, αD-, and αE-globin genes. At any given site, fixed differences between the αA- and αD-globin genes could be attributable to a substitution that occurred on the branch leading to αA-globin (A), a substitution that occurred on the post-duplication branch leading to αD-globin (B), substitutions that occurred on the branch leading to αA-globin and on the post-duplication branch leading to αD-globin (C), a substitution that occurred on the pre-duplication branch leading to the single-copy progenitor of αD- and αE-globin (D), substitutions that occurred on the branch leading to αA-globin and on the pre-duplication branch leading to the αD/αE ancestor (E), or substitutions that occurred on the pre-duplication branch leading to the αD/αE ancestor and on the post-duplication branch leading to αD-globin (F).
EXPERIMENTAL PROCEDURES
Experimental Measures of Hemoglobin Function
To characterize the nature of isoHb differentiation in birds, we measured O2-binding properties of purified HbA and HbD isoforms from a total of 11 avian species representing each of six orders as follows: griffon vulture, Gyps fulvus (Accipitriformes, Accipitridae); greylag goose, Anser anser (Anseriformes, Anatidae); amazilia hummingbird, Amazilia amazilia (Apodiformes, Trochilidae); green-and-white hummingbird, Amazilia viridicauda (Apodiformes, Trochilidae); violet-throated starfrontlet, Coeligena violifer (Apodiformes, Trochilidae); giant hummingbird, Patagona gigas (Apodiformes, Trochilidae); great-billed hermit, Phaethornis malaris (Apodiformes, Trochilidae); common pheasant, Phasianus colchicus (Galliformes, Phasianidae); rook, Corvus frugilegus (Passeriformes, Corvidae); house wren, Troglodytes aedon (Passeriformes, Troglodytidae); and ostrich, Struthio camelus (Struthioformes:, Struthionidae). We examined Hbs from a disproportionate number of hummingbirds because Apodiformes is the most speciose order of birds after the passerines, and because this group is under-represented in previously published studies of avian Hb function.
Blood samples were obtained according to methods described by Weber et al. (20) and Nothum et al. (14). Washed red cells were frozen at −70 °C and were subsequently thawed by adding 2 volumes of distilled water and ⅓ volume of 1 m Tris/HCl buffer, pH 7.5. For each individual specimen, Hb isoform composition was characterized by means of alkaline PAGE and/or thin layer isoelectric focusing (PhastSystem, GE Healthcare Biosciences). Depending on the species, the HbA and HbD isoforms were separated by fast protein liquid chromatography (FPLC), DEAE anion-exchange chromatography, CM-Sepharose cation-exchange chromatography, and/or preparative electrofocusing, as described previously (11, 36, 43, 44). The separate isoHbs were further stripped of organic phosphate and other ions by passing the samples through a mixed bed resin column (MB-1 AG501-X8; Bio-Rad) using FPLC. Hb solutions were then saturated with carbon monoxide and dialyzed at 5 °C for at least 24 h against three changes of CO-saturated 0.01 m Tris/HCl buffer, pH 7.5, containing 0.5 mm EDTA. In cases where partial oxidation (metHb formation) was evident, Hb was reduced by adding sodium dithionite, followed by dialysis against Tris buffer containing EDTA, as described by Weber et al. (20). For the Hbs of the house wrens and the five hummingbird species, we used 10 mm HEPES as the dialysis buffer.
We measured O2 equilibrium curves for purified HbA and HbD isoforms using a modified gas diffusion chamber coupled to cascaded Wösthoff pumps for mixing pure N2 (99.998%), O2, and atmospheric air (9). Changes in the absorbance spectra of thin layer Hb solutions (4 μl) were measured in conjunction with stepwise changes in the partial pressure of O2 (PO2) inside the chamber. Values of P50 (the PO2 at which heme is 50% saturated) and n50 (Hill's cooperativity coefficient at 50% saturation) were interpolated from linear plots of log(Y/(Y − 1)) versus logPO2 for at least four values of Y (fractional saturation) between 0.25 and 0.75. To assess variation in the sensitivity of Hb-O2 affinity to allosteric effectors (ligands that alter Hb-O2 affinity by reversibly binding to sites remote from the active site), we measured O2 equilibrium curves of Hbs suspended in 0.10 m NaHEPES buffer, in the absence of added effectors (“stripped”), in the presence of inositol hexaphosphate (IHP (IHP/Hb tetramer ratio = 2.0)), in the presence of 0.10 m Cl− ions (added as potassium chloride, KCl), and in the presence of both effectors ([heme], 0.3 mm, unless otherwise specified). IHP is a chemical analog of inositol pentaphosphate, which is the most potent allosteric effector molecule in avian red cells (21, 45).
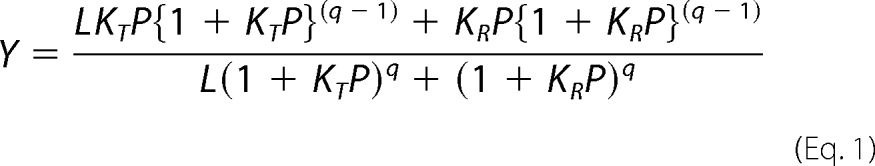
In the case of pheasant HbA and HbD, we conducted a detailed analysis of allosteric interactions based on measurements of O2 equilibria that included extremely high and extremely low saturation values. This allowed us to analyze the data in terms of the two-state Monod-Wyman-Changeux allosteric model (46), which relates Hb-O2 saturation (Y) to the partial pressure of O2 (P), the O2 association constants for “R-state” oxyHb and “T-state” deoxy-Hb (KR and KT, respectively), the allosteric constant (L), and the number of interacting O2-binding sites (q) as shown in Equation 1.
 |
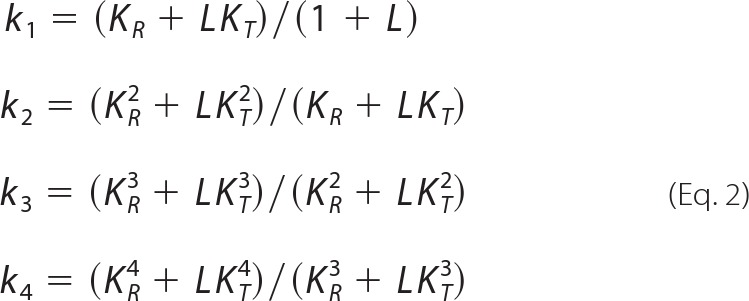
This equation was fit to the data in the form log (Y/1 − Y) versus log P (end-weighting), and parameters were estimated using the curve-fitting procedure described by Weber et al. (47). In separate analyses, values of q were estimated from the data or were fixed at 4, as applies to tetrameric Hb. The two-state Monod-Wyman-Changeux parameters derived for q = 4 were used to calculate the intrinsic Adair constants that characterize the affinities of four successive heme oxygenation steps (48, 49) as shown in Equation 2.
 |
The half-saturation value, P50, was calculated as the PO2 at log (Y/1 − Y) = 0, and the median PO2, Pm, was calculated as shown in Equation 3,
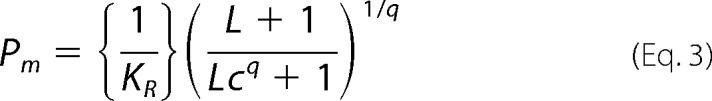 |
where c = KT/KR (50). The maximum slope of the log-log plot, nmax, was calculated by first solving for PO2 in Equation 4,
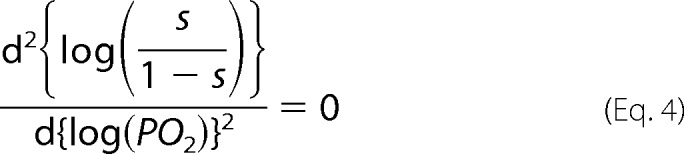 |
and then using that value to calculate d(log[Y/(1 − Y))/d(logPO2). The free energy of cooperativity, ΔG, was calculated as in Equation 5.
 |
Our O2 binding data are not strictly comparable with those of some previously published studies because some workers measured O2 equilibria using ionic buffers that change Hb-O2 affinity via pH-dependent perturbations in the free concentration of allosteric effectors (51). Nonetheless, measurements of O2-binding properties for HbA and HbD should be internally consistent within a given study, so it is possible to compare relative levels of isoHb differentiation among studies. Thus, for the purpose of making broad scale comparisons of isoHb differentiation among species, we surveyed published studies of avian Hbs and compiled measures of the difference in log-transformed P50 values between HbA and HbD in the presence and absence of IHP.
Molecular Modeling
We built homology-based structural models of pheasant HbA and HbD isoforms using SWISS-MODEL (52). We used deoxyhemoglobin (Protein Data Bank ID, 2HHB) as a template to maintain consistency with the results of Riccio et al. (53) and Tamburrini et al. (18). The root mean square deviations between the templates and models of the αA-, αD-, and β-chains were less than 0.08, 0.09, and 0.10 Å, respectively. These structures were used to calculate surface potentials using the PBEQ solver found on the CHARMM GUI server (54). We used the Swiss Institute of Bioinformatics ExPASy proteomics server (55) to estimate the isoelectric point (pI) of the observed and reconstructed α-chain globin structures. Finally, we conducted molecular dynamics simulations to predict O2 and IHP binding energies using AutoDock Vina (56). The search box for IHP (3HXN) was 25 Å cubic centered on the α-chain dyad cleft and that for O2 (1DN2) was 5 Å cubic centered on the O2-binding heme iron.
Taxon Sampling for the Molecular Evolution Analysis
Our phylogenetic survey of amino acid divergence among the avian α-like globin genes included a total of 54 species, including 10 of the 11 species that were used as subjects for the experimental studies of Hb function (supplemental Table S1). We cloned and sequenced the αA-, αD-, and/or αE-globin genes from 28 of the bird species, and we retrieved the remaining sequences from public databases. We also included 98 homologous α-like globin sequences from species that are representative of the other main tetrapod lineages (amphibians, nonavian reptiles, and mammals) as well as teleost fish (supplemental Table S2).
Molecular Cloning and Sequencing
Genomic DNA was isolated from frozen liver tissues using the DNeasy kit, and RNA was isolated from frozen whole blood or frozen pectoral muscle using the RNeasy kit (Qiagen, Valencia, CA). We designed paralog-specific PCR primer combinations for the αE-, αD-, and αA-globin genes by using multispecies alignments of orthologous sequences that have been annotated in avian genome assemblies (32, 41, 57). For each species, the αE-globin gene was PCR-amplified from genomic DNA using the Invitrogen Taq polymerase native kit (Invitrogen) and the following thermal cycling protocol: 94 °C (10 min) initial denaturing (94 °C (30 s), 54–62.5 °C (30 s), and 72 °C (1 min)) for 34 cycles, followed by a final extension at 72 °C (7 min). The αD- and αA-globin genes were PCR-amplified from genomic DNA, as described above, or cDNAs were amplified from RNA using the Qiagen OneStep RT-PCR kit (Qiagen, Valencia, CA). Reverse transcriptase (RT)-PCRs were conducted according to the following thermal cycling protocol: 50 °C (30 min) followed by a 94 °C (15 min) initial denaturing, (94 °C (30 s), 55 °C (30 s), 72 °C (1 min)) for 34 cycles, followed by a final extension at 72 °C (3 min).
For some species, we sequenced the αA- and αD-globin coding regions by using rapid amplification of cDNA ends (RACE). Primers were designed in the conserved exonic regions of the αA- and αD-globin genes, and the first strand synthesis was carried out using SuperScriptTM II reverse transcriptase (Invitrogen). Both 5′- and 3′-RACE were performed according to the manufacturer's protocol. Sequences of all PCR, RT-PCR, and RACE primers are available upon request.
PCR products were electrophoretically separated on a 1.2% agarose gel (100 volts) and were then excised and eluted from the gel following the protocol in the QIAquick gel extraction kit (Qiagen, Valencia, CA). PCR amplicons were cloned into pCR4-TOPO vector (Invitrogen), which was then used to transfect One-shot TOP10 chemically competent Escherichia coli cells (Invitrogen). Positive clones were sequenced on an ABI 3730XL high throughput capillary DNA analyzer (Applied Biosystems, Foster City, CA) using internal T7/T3 primers. All sequences were deposited in GenBankTM under the accession numbers: JQ405307–JQ405317, JQ405319–JQ405326, JQ697045–JQ697070, JQ405318, and JQ824132.
Prediction of Functionally Divergent Sites
To nominate candidate sites for functional divergence between the avian αA- and αD-globin sequences, we identified residue positions that were highly conserved within each paralogous clade but differed between the two clades. Such sites were termed “constant-but-different” (CBD) sites by Gribaldo et al. (58) and were termed “type II” divergent sites by Gu (59). Our analysis of functional divergence was based on a total of 92 sequences (47 avian αA-globin sequences and 45 avian αD-globin sequences). To quantify the conservation of physicochemical properties at each residue position within the separate sets of αA- and αD-globin sequences, we calculated site-specific entropy values (60) as shown in Equation 6,
 |
where pj is the frequency of a particular physicochemical state at site j, and b = 8 such that calculated values fall within the interval (0, 1). In addition to considering single-residue insertions or deletions, we considered eight possible physicochemical states for each residue position as follows: hydrophobic (Ala, Val, Ile, and Leu), hydrophilic (Ser, Thr, Asn, and Gln), sulfur-containing (Met and Cys), glycine (Gly), proline (Pro), acidic (Asp and Glu), basic (His, Lys, and Arg), and aromatic (Phe, Trp, and Tyr). We identified CBD sites as residue positions that were highly conserved within each set of orthologous sequences (Hi <0.5) but exhibited a consistent physicochemical difference between the αA- and αD-globin sequences. CBD sites do not necessarily represent fixed amino acid differences between the αA- and αD-globin paralogs, because a given site could be variable for an interchangeable set of isomorphous residues within each set of orthologous sequences.
Ancestral Sequence Reconstruction
To infer the phylogenetic distribution of amino acid substitutions that contributed to functional differentiation between the avian HbA and HbD isoforms, we reconstructed ancestral sequences at four separate nodes in the phylogeny of α-like globin genes as follows: (i) the single-copy proto-α-globin gene in the stem lineage of tetrapod vertebrates; (ii) the ancestral αA-globin in the stem lineage of birds; (iii) the single-copy ancestor of the αE- and αD-globin paralogs in the stem lineage of tetrapods; and (iv) the ancestral αD-globin in the stem lineage of birds. To reconstruct ancestral α-chain sequences, we applied the maximum likelihood approach of Yang et al. (61) using the WAG + F model of amino acid substitution (62, 63) as implemented in PAML 4.4 (64). Amino acid sequences were aligned using the default parameters in Muscle (65). The ancestral sequence reconstruction was based on a phylogeny of α-like globin sequences from a representative set of mammals, birds, nonavian reptiles, and amphibians, and the tree was rooted with α-globin sequences from teleost fishes. Ancestral states of individual sites were reconstructed independently, and we restricted the analysis to sites that had posterior probabilities ≥0.8 for a given residue or physicochemical property.
In the phylogeny of α-like globin genes, (αA (αD and αE)), site-specific amino acid differences between the avian αA- and αD-globin sequences could be attributable to substitutions on (i) the branch leading to αA, (ii) the post-duplication branch leading to αD, and/or (iii) the pre-duplication branch leading to the single copy ancestor of αD and αE (Fig. 1). Accordingly, we identified all amino acid substitutions that distinguish the avian αA- and αD-globin paralogs, and after reconstructing ancestral states at relevant nodes of the phylogeny, we mapped the observed substitutions onto the branches mentioned above. Mapping charge-changing substitutions onto branches of the phylogeny also allowed us to reconstruct the causes of divergence in isoelectric point (pI) between the HbA and HbD isoforms.
RESULTS
Relative Abundance of HbA and HbD
Ten of the bird species included in our study expressed two main Hb isoforms that were clearly referable to HbA and HbD. The griffon vulture, G. fulvus, expressed three isoHbs, one of which is clearly identifiable as HbD, and the other two incorporated the products of duplicated αA-globin genes (HbA and HbA′). The species that we examined generally expressed the HbA and HbD isoforms in a 2:1–4:1 ratio, which is consistent with results from previous studies (8). The pheasant represented the sole exception to this pattern, as HbD was present at a higher concentration than HbA (69 versus 31%). HbD expression has been secondarily lost in representatives of six avian orders (Ciconiiformes, Columbiformes, Coraciformes, Cuculiformes, Psittaciformes, and Sphenisciformes), and parsimony-based character-state mapping (using the phylogeny of Hackett et al. (66)) suggests that each of these losses occurred independently (data not shown).
Functional Properties of Avian HbA and HbD Isoforms
O2-equilibrium measurements revealed consistent functional differences between the HbA and HbD isoforms, as HbD was generally characterized by a higher O2 affinity (lower P50) in the presence of IHP (2-fold molar excess over Hb) and in the presence of IHP + 0.1 m Cl− (Table 1). This pattern of isoHb differentiation is consistent with previously published results for avian Hbs (Table 2). HbD was generally characterized by a higher intrinsic O2 affinity than HbA, but there were several exceptions. In the griffon vulture, HbD showed a much lower O2 affinity than HbA in the absence of effectors but a higher affinity in the presence of IHP (Table 1). Likewise, in 4 of the 5 hummingbird species that we examined (amazilia hummingbird, green-and-white hummingbird, violet-throated starfrontlet, and great-billed hermit), the HbA isoform exhibited a slightly higher intrinsic O2 affinity than HbD. In all cases these differences in O2 affinity were reversed in the presence of IHP (Table 2). Vandecasserie et al. (19) also reported that the HbA isoforms of mallard duck, pheasant, and turkey had higher intrinsic O2 affinities than the co-expressed HbD isoforms, and again, this was reversed in the presence of anionic effectors (Table 2). Contrary to the results reported by Vandecasserie et al. (19), our O2-equilibrium measurements on pheasant Hbs revealed a lower O2 affinity in HbA than in co-expressed HbD in the presence and in the absence of anionic effectors, as found in most other species that express both isoforms (Tables 1 and 2). Whereas our O2-binding experiments were carried out using zwitterionic HEPES buffer, those by Vandecasserie et al. (19) were carried out using an ionic Tris/HCl buffer that may perturb the measurements of O2 affinity by reducing the concentration of free anionic effectors in a pH-dependent manner (51). Our results and those of Vandecasserie et al. (19) are in agreement that the O2 affinity of HbA is lower than that of HbD in the presence of anionic effectors, the state that is most relevant to in vivo conditions.
TABLE 1.
O2 affinities (P50, torr) and cooperativity coefficients (n50) of purified HbA and HbD isoforms from 11 bird species
O2 equilibria were measured in 0.1 mm HEPES buffer at pH 7.4 (± 0.01) and 37 °C in the absence (stripped) and presence of allosteric effectors ([Cl−], 0.1 m; [HEPES], 0.1 m; IHP/Hb tetramer ratio, 2.0. P50 and n50 values were derived from single O2 equilibrium curves, where each value was interpolated from linear Hill plots (correlation coefficient r> 0.995) based on four or more equilibrium steps between 25 and 75% saturation.
| Species | IsoHb | [Heme], mm | Stripped |
+ KCl |
+ IHP |
+ KCl + IHP |
||||
|---|---|---|---|---|---|---|---|---|---|---|
| P50 | N50 | P50 | n50 | P50 | n50 | P50 | n50 | |||
| Accipitriformes | ||||||||||
| Gyps fulvus | HbA | 0.30 | 6.46 | 1.62 | 28.84 | 1.98 | ||||
| HbD | 0.07 | 15.86 | 1.82 | 26.61 | 1.99 | |||||
| Anseriformes | ||||||||||
| Anser anser | HbA | 1.00 | 4.78 | 2.51 | 43.95a | 3.00a | ||||
| HbD | 0.72 | 3.59 | 1.90 | 29.79a | 2.51a | |||||
| Apodiformes | ||||||||||
| A. amazilia | HbA | 0.30 | 3.14 | 1.38 | 5.28 | 1.90 | 36.77 | 2.16 | 29.84 | 2.42 |
| HbD | 0.30 | 3.36 | 1.70 | 4.79 | 2.08 | 28.61 | 2.63 | 23.20 | 2.40 | |
| A. viridicauda | HbA | 0.30 | 2.62 | 1.43 | 4.47 | 1.81 | 28.49 | 2.13 | 24.24 | 2.07 |
| HbD | 0.30 | 2.78 | 1.34 | 3.90 | 1.64 | 21.83 | 2.22 | 20.36 | 2.29 | |
| C. violifer | HbA | 0.30 | 2.12 | 1.29 | 3.74 | 1.65 | 23.55 | 1.96 | 19.12 | 1.70 |
| HbD | 0.30 | 2.48 | 1.40 | 3.65 | 1.80 | 17.70 | 2.30 | 17.01 | 2.46 | |
| P. gigas | HbA | 0.30 | 2.52 | 1.46 | 4.14 | 1.63 | 29.97 | 2.28 | 25.86 | 2.49 |
| HbD | 0.30 | 2.45 | 1.41 | 3.19 | 1.97 | 17.44 | 2.24 | 16.56 | 2.56 | |
| P. malaris | HbA | 0.30 | 2.83 | 1.39 | 4.70 | 1.83 | 37.00 | 2.27 | 28.13 | 2.04 |
| HbD | 0.30 | 3.06 | 1.62 | 5.02 | 2.11 | 26.03 | 2.47 | 24.92 | 2.72 | |
| Galliformes | ||||||||||
| Phasianus colchicus | HbA | 0.08 | 5.62 | 1.86 | 44.67a | 2.31a | ||||
| HbD | 0.11 | 5.54 | 1.73 | |||||||
| HbA | 0.60 | 4.12b | 2.47b | 29.51b | 2.55b | |||||
| HbD | 0.60 | 3.50b | 2.38b | 24.24a,b | 2.46a,b | |||||
| Passeriformes | ||||||||||
| Corvus frugilegus | HbA | 0.06 | 5.60 | 1.50 | ||||||
| HbD | 0.04 | 4.15 | 1.46 | |||||||
| Troglodytes aedon | HbA | 0.30 | 2.80 | 1.48 | 4.57 | 1.91 | 33.90 | 1.98 | 25.87 | 2.11 |
| HbD | 0.30 | 1.58 | 1.47 | 2.67 | 1.92 | 22.59 | 2.39 | 16.28 | 2.36 | |
| Struthioformes | ||||||||||
| Struthio camelus | HbA | 0.58 | 3.55 | 1.90 | 32.73a | 2.85 | ||||
| HbD | 0.58 | 2.63 | 1.75 | 22.90a | 2.44 | |||||
a Saturating IHP/Hb4 ratio is >20.
b These values are taken from Table 3 (Monod-Wyman-Changeux parameters), temperature = 25 °C.
TABLE 2.
O2 affinity differences between avian HbA and HbD isoforms in the absence of allosteric effectors (stripped) and in the presence of IHP
IHP was present at saturating concentrations (IHP/Hb4 ratio >20), except where indicated.
| Species | ΔlogP50 (HbA - HbD) |
°C | pH | Buffer | Ref. | |
|---|---|---|---|---|---|---|
| Stripped/+KCl | +IHP | |||||
| Accipitriformes | ||||||
| Gyps fulvus | −0.37a | 0.06a | 37 | 7.4 | 0.1 m NaHEPES, 0.1 m KCl | This study |
| −0.41b | 37 | 7.4 | 0.1 m NaHEPES, 0.1 m KCl | This study | ||
| Gyps ruppellii | 0.20a | ∼0.40a | 38 | 7.5 | 0.1 m NaHEPES, 0.1 m KCl | Weber et al. (20) |
| 0.09b | ∼0.20b | 38 | 7.5 | 0.1 m NaHEPES, 0.1 m KCl | Weber et al. (20) | |
| Trigonoceps occipitalis | 0.10 | 0.06 | 38 | 7.5 | 0.1 m NaHEPES, 0.1 m KCl | Hiebl et al. (12) |
| Anseriformes | ||||||
| Anas platyrhinchos | −0.32 | 0.45c | 20 | 7.0 | 0.025 m TrisHCl/0.1 m NaCl | Vandecasserie et al. (19) |
| Anser anser | 0.17 | 37 | 7.4 | 0.1 m NaHEPES, 0.1 m KCl | Present study | |
| Apus apus | 0.23 | 0.54 | 38 | 7.5 | 0.02 m TrisHCl/0.1 m NaCl | Nothum et al. (14) |
| Apodiformes | ||||||
| A. amazilia | −0.03 | 0.11 | 37 | 7.4 | 0.1 m NaHEPES, 0.1 m KCl | Present study |
| A. viridicauda | −0.03 | 0.12 | 37 | 7.4 | 0.1 m NaHEPES, 0.1 m KCl | Present study |
| C. violifer | −0.07 | 0.12 | 37 | 7.4 | 0.1 m NaHEPES, 0.1 m KCl | Present study |
| P. gigas | 0.01 | 0.24 | 37 | 7.4 | 0.1 m NaHEPES, 0.1 m KCl | Present study |
| P. malaris | −0.03 | 0.15 | 37 | 7.4 | 0.1 m NaHEPES, 0.1 m KCl | Present study |
| Charadriiformes | ||||||
| Catharacta maccormicki | 0.20 | ∼0.15 | 37 | 7.5 | 0.1 m NaHepes /0.1 m NaCl | Tamburrini et al. (18) |
| Galliformes | ||||||
| Gallus gallus | 0.14 | 0.61c | 20 | 7.0 | 0.025 m TrisHCl/0.1 m NaCl | Vandecasserie et al. (19) |
| 0.55 | 0.88 | 25 | 7.0 | 0.1 m NaHEPES, 0.1 m KCl | Weber et al. (44) | |
| Meleagris gallopavo | −0.27 | 0.35c | 20 | 7.0 | 0.025 m TrisHCl/0.1 m NaCl | Vandecasserie et al. (19) |
| Phasianus colchicus | −0.37 | 0.20c | 20 | 7.0 | 0.025 m TrisHCl/0.1 m NaCl | Vandecasserie et al. (19) |
| 0.01 | 37 | 7.4 | 0.1 m NaHEPES, 0.1 m KCl | Present study | ||
| 0.07 | 0.09 | 25 | 7.5 | 0.1 m NaHEPES, 0.1 m KCl | Present study | |
| Passeriformes | ||||||
| Corvus frugilegus | 0.13 | 37 | 7.4 | 0.1 m NaHEPES, 0.1 m KCl | Present study | |
| Troglodytes aedon | 0.25 | 0.18 | 37 | 7.4 | 0.1 m NaHEPES, 0.1 m KCl | Present study |
| Phoenicopteriformes | ||||||
| Phoenicopterus roseus | 0.24 | ∼0.50 | 20 | 7.5 | 0.05 m TrisHCl/0.1 m NaCl | Sanna et al. (17) |
| Struthioniformes | ||||||
| Struthio camelus | 0.30 | 0.48c | 37 | 7.4 | 0.05 m TrisHCl/0.2 m NaCl | Oberthür et al. (15) |
| 0.13 | 0.16 | 37 | 7.4 | 0.1 m NaHEPES, 0.1 m KCl | Present study | |
a Comparison was between HbA and HbD.
b Comparison was between HbA′ and HbD.
c IHP/Hb tetramer ratio is 1:1.
The O2 affinities of pheasant HbA and HbD were modulated by pH in a similar fashion, as estimated Bohr factors were virtually identical for both isoHbs (ϕ = Δlog P50/ΔpH = −0.43 at 25 °C and pH 7.0–7.5). The Bohr factor was slightly reduced at 37 °C (ϕ for HbA = −0.37), in accordance with the temperature dependence of proton dissociation, but it was strongly increased in the presence IHP (ϕ = −0.63 at 37 °C), which is consistent with the induction of basic proton binding groups by this anionic effector (67). When stripped of allosteric effectors, HbA and HbD exhibited similar cooperativity coefficients (n50 ∼2.0 at 37 °C and pH 7.0–7.5) that increased in the presence of IHP (n50 ∼2.6). The mixture of purified HbA and HbD isoforms exhibited P50 values that were intermediate to those of the individual isoHbs at physiological pH (Fig. 2), which indicates the absence of functionally significant intracellular interaction between the two isoforms, as observed previously for chicken Hb at high Hb concentration (16). This lack of interaction, in conjunction with the observed symmetry of O2-binding curves (reflected by the correspondence between nmax and n50 values and between Pm and P50 values; Table 3), justifies the quantification of the allosteric interactions of both isoforms in terms of shifts in P50 values (68).
FIGURE 2.

O2 affinity and cooperativity (P50 and n50, respectively) of pheasant HbA and HbD as a function of pH, temperature, and in the absence and presence of IHP (IHP/H4B ratio = 23.5). O2 equilibria were measured in 0.1 m NaHEPES buffer containing 0.1 m KCl. Heme concentration, 0.08 mm (HbA) and 0.11 mm (HbD) and 0.10 (HbA +D).
TABLE 3.
Parameter estimates derived from O2 equilibrium measurements of pheasant HbA and HbD under the two state Monod-Wyman-Changeux (MWC) allosteric model (compare Fig. 3)
In separate analyses, the number of O2-binding sites was freely estimated (q = free) or fixed at 4 (q = 4).
| isoHb | °C | pH | IHP/Hb4 | P50 | n50 | nmax | Pm | KT | KR | L | ΔG | q |
|---|---|---|---|---|---|---|---|---|---|---|---|---|
| torr | torr | torr−1 (± S.E.) | torr−1 (± S.E.) | kJ mol−1 | ||||||||
| HbA | ||||||||||||
| q = free | 25 | 7.487 | 4.13 | 2.60 | 2.63 | 3.89 | 0.0663 ± 0.0054 | 2.0777 ± 0.3396 | 1.3×10⁴ | 8.38 | 4.54 | |
| 25 | 7.050 | 7.12 | 2.61 | 2.65 | 6.73 | 0.0316 ± 0.0008 | 2.1798 ± 0.1974 | 3.5×10⁴ | 10.10 | 3.89 | ||
| fixed q = 4 | 25 | 7.487 | 4.12 | 2.44 | 2.47 | 3.9 | 0.0637 ± 0.0046 | 2.4835 ± 0.3419 | 8.8×10³ | 8.74 | 4.00 | |
| 25 | 7.050 | 7.13 | 2.64 | 2.68 | 6.73 | 0.0320 ± 0.0007 | 2.0496 ± 0.1014 | 3.6×10⁴ | 9.99 | 4.00 | ||
| HbD | ||||||||||||
| q = free | 25 | 7.492 | 3.51 | 2.47 | 2.49 | 3.36 | 0.0752 ± 0.0042 | 2.0168 ± 0.1706 | 4.2×10³ | 7.99 | 4.36 | |
| 25 | 7.496 | 23.5 | 26.14 | 2.71 | 3.02 | 22.05 | 0.0162 ± 0.0008 | 1.2308 ± 0.8497 | 7.5×10⁷ | 10.20 | 5.49 | |
| 37 | 7.433 | 6.05 | 2.10 | 2.12 | 5.72 | 0.0575 ± 0.0046 | 1.0665 ± 0.2236 | 1.7×10³ | 7.070 | 4.10 | ||
| fixed q = 4 | 25 | 7.492 | 3.50 | 2.38 | 2.39 | 3.36 | 0.0721 ± 0.0034 | 2.1948 ± 0.1497 | 3.0×10³ | 8.20 | 4.00 | |
| 25 | 7.496 | 23.5 | 24.2 | 2.46 | 2.61 | 21.5 | 0.0143 ± 0.0010 | 2.7×10⁵ ± 3.6×10¹⁰ | 1.1×1027 | 11.70 | 4.00 | |
| 37 | 7.433 | 6.05 | 2.08 | 2.10 | 5.72 | 0.0572 ± 0.0037 | 1.1053 ± 0.1196 | 1.6×10³ | 7.12 | 4.00 | ||
Extended Hill plots for the HbA and HbD isoforms (Fig. 3) and estimates of the Monod-Wyman-Changeux parameters (Table 3) elucidate the allosteric control mechanisms that underlie the observed hetero- and homotropic effects. When measured at the same pH, extended Hill plots for HbA and HbD are almost superimposed, revealing nearly identical association constants in the deoxygenated and oxygenated states (KT and KR, which can be interpolated from the intercepts of the lower and the upper asymptotes, respectively, of the extended Hill plots with the vertical line at log PO2 = 0; Fig. 3A). Thus, both isoHbs are characterized by similar free energies of Hb cooperativity (ΔG = ∼8.4 and ∼8.0 for HbA and HbD, respectively, with q = free at pH ∼7.5; Table 3). Whereas increased proton activity (decreased pH) reduces O2 affinity by lowering KT without markedly affecting KR, IHP decreases O2 affinity by lowering KT more than KR, such that both effectors raise ΔG. The effect of IHP on both KT and KR (Fig. 3B), indicates that this effector binds to the deoxy as well as the oxy structures. Similar effects of IHP have been documented in human and fish Hbs, although physiological levels of the autochthonous phosphate effectors (2,3-diphosphoglycerate and ATP, respectively) primarily modulate KT (69, 70). As shown in Fig. 3B, increased temperature lowers KR more than KT, thereby decreasing the free energy of heme-heme cooperativity.
FIGURE 3.

Extended Hill plots of O2 equilibria (where Y = fractional O2 saturation) for pheasant HbA and HbD. A, HbA and HbD at 25 °C; B, HbD at 25 and 37 °C and in the absence and presence of saturating IHP concentration (IHP/Hb ratio = 23.5). In each plot, the intercept of the lower asymptote with the horizontal line at logY/(Y − 1) = 0 provides an estimate of KT, the O2 association constant of T-state deoxy-Hb, and the intercept of the upper asymptote with the same line provides an estimate of KR, the O2 association constant of R-state oxyHb. Heme concentration 0.60 (HbA and HbD); other conditions are as described in the legend for Fig. 2.
The allosteric T-state → R-state transitions of pheasant HbA and HbD and their dependence on modulating factors are further illustrated by the Adair association constants (k1–4) for the four successive oxygenation steps. In stripped HbA and HbD at pH ∼7.5, the similar k1 and k2 constants and the markedly increased k3 and k4 values indicate that the allosteric transition occurs only after binding the second and third O2 molecules (Fig. 4). This also applies at low pH (∼7.0), where lower k1 and k2 values show that proton binding reduces the affinities for binding the 1st and 2nd O2 molecules. In the presence of IHP, the even lower values of k1, k2, and k3 combined with a drastically increased k4 (Fig. 4) indicate that IHP suppresses the affinities of unliganded hemes for the 1st, 2nd, and 3rd O2 molecules but has little effect on the affinity of the remaining unliganded heme. This indicates that IHP-binding delays the T-state → R-state transition in quaternary structure until the final oxygenation step.
FIGURE 4.

Adair constants (k1, k2, k3, and k4) for pheasant HbA and HbD as a function of temperature, pH, and the absence and presence of IHP (derived from data shown in Fig. 2).
Insights into the Evolutionary Origins of Hb Isoform Differentiation
Comparison of avian αA and αD sequences yielded a Poisson-corrected amino acid divergence of 35.6%. We identified a total of 39 candidate sites that may contribute to functional divergence between the avian αA- and αD-globin genes (Fig. 5), 33 of which are CBD sites (both paralogs having Hi values <0.50; sites 1, 8, 9, 11, 12, 28, 53, 57, 67, 68, 71, 72, 75, 77, 78, 82, 85, 89, 90, 102, 106, 113–117, 124, 125, 130, 133, 134, 137, and 138). The remaining six sites were more variable in one or both sets of orthologous sequences (sites 5, 15, 18, 21, 30, and 50). Ancestral sequence reconstructions revealed that roughly equal numbers of substitutions occurred on the post-duplication branches leading to αA- and αD-globin. Substitutions at 11 sites were consistent with the scenario depicted in Fig. 1A; substitutions at 12 sites were consistent with Fig. 1B, and substitutions at five sites were consistent with Fig. 1C. None of the divergent sites between the αD- and αA-globin sequences were consistent with the scenarios depicted in Fig. 1, D and E or F. The pattern was similar when we considered the complete set of 39 substitutions (including sites for which ancestral state reconstructions had posterior probabilities <0.8). The sole exception is that the inferred history of substitution at site α9 was consistent with the scenario depicted in Fig. 1D.
FIGURE 5.

Reconstructed ancestral states of 39 sites that distinguish the αA- and αD-globin polypeptides. As shown in the inset phylogeny of α-like globin genes, ancestral states for each of the 39 sites were reconstructed for four separate nodes in the tree.
Charge-changing substitutions at 17 solvent-exposed residue positions account for the observed difference in net surface charge between HbA (mean pI = 8.67) and HbD (mean pI = 7.09). Substitutions at eight sites were consistent with the scenario depicted in Fig. 1A (71, 89, 90, 116, 117, 130, and 138), substitutions at eight sites were consistent with the scenario depicted in Fig. 1B (11, 30, 53, 68, 75, 82, 85, and 115), and substitutions at two sites were consistent with the scenario depicted in Fig. 1C (8 and 15).
Insights into the Structural Basis of Hb Isoform Differentiation
The simulation-based autodocking experiments predicted a slightly lower O2-binding energy (and hence higher O2 affinity) for the α-chain heme groups of HbD relative to those of HbA, −0.5 kcal/mol versus −0.4 kcal/mol, respectively. The molecular dynamics simulations also predicted that the “additional” α-chain phosphate-binding site of HbD (sensu Tamburrini et al. (18) and Riccio et al. (53)) has a slightly lower IHP-binding energy relative to that of HbA (Table 4) and that the bound IHP molecule is lodged more deeply in the α-chain binding cleft of HbD (Fig. 6). This isoform difference in the stereochemistry of IHP binding is mainly attributable to substitutions at three symmetry-related pairs of amino acid residues as follows: Met-αD1 (which reduces electrostatic repulsion relative to Val-αA1), Glu-αD138 (which increases electrostatic attraction relative to Ala-αA138), and Ala-αD134 (which, relative to Thr-αA134, reduces steric hindrance in the cleft between the α1 and α2 subunits).
TABLE 4.
Predicted IHP binding affinities for the α- and β-chain polyphosphate-binding sites in homology-based models of pheasant HbA and HbD
| IsoHb | IHP-binding site | IHP-binding energy (kcal/mol) |
|---|---|---|
| HbA | α-Chaina | −5.1 |
| β-Chainb | −6.1 | |
| HbD | α-Chaina | −6.6 |
| β-Chainb | −6.2 |
a The additional polyphosphate-binding site is formed by seven charged residues at or near the N and C termini of the α-chain subunits (sites 1, 95, 99, 134, 137, 138, and 141; Tamburrini et al. (18)).
b The main polyphosphate-binding site is formed by seven charged residues at or near the N and C termini of the β-chain subunits (sites 1, 2, 82, 135, 136, 139, and 143; Tamburrini et al. (18)).
FIGURE 6.

Homology-based structural models of pheasant HbA and HbD showing predicted differences in the stereochemistry of IHP binding between the N and C termini of the α-chain subunits.
DISCUSSION
IsoHb Composition of Avian Red Cells
In contrast to the variable patterns of Hb heterogeneity in fishes and other ectothermic vertebrate groups (5, 7–9, 71–73), the two-component HbA/HbD system of birds is remarkably consistent. A number of bird species are known to express three or four structurally distinct isoHbs in definitive erythrocytes (11, 14, 15, 74, 75), but in all such cases HbA and HbD (i.e. tetrameric assemblies that incorporate the products of αA- and αD-globin, respectively) represent the two main isoforms. HbD expression has also been secondarily lost in a number of avian taxa (e.g. pigeons, parakeets, cuckoos, jays, herons, storks, and penguins (74, 76–80)). The same appears to be true for crocodilians (30–32), the sister group to Aves.
Structural and Functional Differentiation between HbA and HbD
It is difficult to pinpoint specific substitutions that may be responsible for isoHb differences in intrinsic O2 affinity, although substitutions at intersubunit contact surfaces are good candidates: three of the CBD sites (114, 115, and 117) represent α1β1 “packing” contacts. It is also possible that isoHb differences in intrinsic O2 affinity are attributable to different combinations of substitutions in different species. Studies of isoHb differentiation in the tufted duck, common swift, Rüppell's griffon, and goshawk suggested that the higher O2 affinity of HbD may be attributable to the possession of Gln-αD38 or Thr instead of Pro-αA38 (11, 14, 20, 81–83). In Hbs with αGln-38 or Thr, the R-state (oxy) structure is stabilized by two hydrogen bonds with βHis-97 and βAsp-99, whereas only the latter hydrogen bond is possible in the T-state. Thus, HbD with Gln-αD38 or Thr is more highly stabilized in the R-state, and the allosteric equilibrium is shifted in favor of this high affinity quaternary structure. This structural mechanism may contribute to O2 affinity differences between HbA and HbD in the particular species mentioned above, but it does not provide a general explanation for the observed patterns of functional differentiation between avian HbA and HbD because the majority of bird species retain the ancestral Gln residue at this intersubunit contact site in both αA- and αD-globin.
In addition to the isoHb differences in intrinsic O2 affinity, HbD also exhibits a consistently higher O2 affinity in the presence of IHP (Tables 1 and 2). This indicates that HbD is less responsive to the inhibitory effects of IHP, a potent allosteric effector that preferentially binds and stabilizes the low affinity T-state quaternary structure of the Hb tetramer. The uniform difference in IHP sensitivity between HbA and HbD is surprising because the main polyphosphate-binding site is formed by a cluster of positively charged β-chain residues that line the interior of the central cavity (18, 84). Because HbA and HbD share identical β-chain subunits (and thus share the same phosphate-binding sites), the observed isoform differences in IHP sensitivity must be attributable to one or more substitutions between αA- and αD-globin that do not directly affect the main phosphate-binding site. Experimental evidence suggests that an additional polyphosphate-binding site is formed by seven residues from each α-chain (sites 1, 95, 99, 134, 137, 138, and 141), which stabilize IHP via charge-charge interactions (18, 85, 86). Specifically, αLys-99 and charged residues at the α-chain N and C termini of avian HbA and HbD are predicted to form six salt bridges with the negatively charged phosphate groups of IHP (18, 53). This additional phosphate-binding site is hypothesized to serve as an “entry/leaving site,” which modulates Hb-O2 affinity by enhancing phosphate uptake and transfer to the main oxygenation-linked binding site between the β-chain subunits (18, 53). Of the seven α-chain residues that compose this additional phosphate-binding site, four represent CBD sites that distinguish avian αA- and αD-globin sequences (1, 134, 137, and 138). The role of αVal-1 in this additional phosphate-binding site is implicated by the fact that carbamylation of the α-chain N termini produces a 40% reduction in IHP affinity (85). However, even though HbD exhibits a consistently higher O2 affinity than HbA in the presence of IHP (Tables 1 and 2), our molecular dynamics simulations predict that the additional phosphate-binding site of HbD actually has a slightly lower IHP binding energy (and hence, higher IHP affinity) than that of HbA (Table 4). An alternative hypothesis suggested by results of the molecular dynamics simulations (Fig. 6) is that IHP binding between the α1 and α2 subunits of HbD produces a second-order perturbation of quaternary structure that is propagated to the main phosphate-binding site between the β-chain subunits.
Deoxygenation-linked Self-association of HbD
Our measures of Hb-O2 equilibria were conducted under standard conditions ([heme] = 0.3 mm (50)) where intrinsic functional differences between tetrameric HbA and HbD were not obscured by possible effects of deoxygenation-linked self-association. Measurements of oxygenation properties under these conditions moreover permit meaningful comparisons with data from previously published studies (Tables 1 and 2). The Hb concentrations used in our experiments greatly exceeded the threshold at which tetrameric vertebrate Hbs dissociate to dimers and monomers (87) but were below the threshold at which deoxygenation-linked self-association of HbD is expected to occur. Thus, our experimental data do not shed light on the prevalence or physiological relevance of HbD self-association in avian red cells. However, available protein expression data (74, 76–80) indicate that HbD “supercooperativity” in definitive erythrocytes would not be relevant in a number of avian taxa for the simple reason that they do not express HbD during postnatal life.
Our sequence data have implications for long standing questions about the specific residue(s) that mediate the intertetramer interactions between deoxy-HbDs (22–24). Because avian HbA and HbD share a common β-chain, interactions between deoxy-HbD tetramers must be mediated by surface residues on the αD-chain subunit that are not shared with the αA-chain. On the basis of a crystallographic analysis of chicken R-state HbD, Knapp et al. (23) identified four solvent-exposed αD-chain residues (Met-1, Leu-48, Tyr-89, and Leu-91) that could potentially contribute to the formation of a deoxy-HbD tetramer-tetramer interface. Our comparative analysis of avian αA- and αD-globin sequences reveals that only two of these four α-chain residues (1 and 89) are CBD sites (Fig. 5). These results demonstrate that phylogenetic surveys of sequence variation can help guide the design of experiments to characterize the structural basis of deoxygenation-linked self-association. Our analysis of sequence conservation in a diverse array of avian taxa helps narrow down the search for causative residues by eliminating sites that do not represent uniformly fixed differences between αA- and αD-globin.
Evolutionary Origins of IsoHb Differentiation in Birds
Of the many amino acid substitutions that distinguish avian HbA and HbD, ancestral sequence reconstructions indicate that roughly equal numbers of amino acid substitutions occurred on the post-duplication branches leading to αA- and αD-globin. Model-based calculations of electrostatic surface potentials revealed the specific substitutions that are responsible for observed differences in net surface charge between the two isoHbs, and again, roughly equal numbers of these substitutions occurred on the post-duplication branches leading to αA- and αD-globin. These results indicate that the observed functional differences between the HbA and HbD isoforms are not attributable to the retention of an ancestral character state from the single-copy, pre-duplication ancestor of the αE- and αD-globin genes. The fact that the αA- and αD-globin genes have been jointly retained in the majority of sauropsid lineages over the past ∼400 million years suggests that the functionally distinct HbA and HbD isoforms have evolved an important physiological division of labor in blood-O2 transport. The O2 affinity of HbA is more strongly modulated by allosteric effectors, suggesting that this isoform could play a more important role in modulating blood-O2 affinity in response to transient changes in O2 supply or demand, whereas the high affinity HbD may make a more important contribution to blood-O2 transport under conditions of arterial hypoxemia.
Supplementary Material
Acknowledgments
We thank Anny Bang (Aarhus, Denmark) and Kathy Williams (Lincoln, NE) for valuable assistance in the laboratory. We also thank Z. A. Cheviron, F. G. Hoffmann, and S. D. Smith for helpful discussions; A. Abbasi and T. Kirkegaard for sharing unpublished data, and two anonymous reviewers for comments and suggestions. We gratefully acknowledge loans from frozen tissue collections at the Museum of Southwestern Biology, the Louisiana Museum of Natural History, and the Florida Museum of Natural History, and we thank M. Berenbrink (University of Liverpool) and C. Witt (University of New Mexico) for sending blood samples.
This work was supported, in whole or in part, by National Institutes of Health Grants R01 HL087216 and HL087216-S1 from NHLBI. This work was also supported by National Science Foundation Grant IOS-0949931 and the Science Faculty, Aarhus University.

This article contains supplemental Tables S1 and S2 and additional references.
- isoHb
- Hb isoforms
- IHP
- inositol hexaphosphate
- CBD
- constant-but-different
- RACE
- rapid amplification of cDNA end.
REFERENCES
- 1. Dickerson R. E., Geis I. (1983) Hemoglobin: Structure, Function, Evolution, and Pathology, Benjamin/Cummings Publishing, Menlo Park, CA [Google Scholar]
- 2. Perutz M. F. (1983) Species adaptation in a protein molecule. Mol. Biol. Evol. 1, 1–28 [DOI] [PubMed] [Google Scholar]
- 3. Bunn H. F., Forget B. G. (1986) Hemoglobin: Molecular, Genetic, and Clinical Aspects, W.B. Saunders Co., Philadelphia [Google Scholar]
- 4. Weber R. E., Fago A. (2004) Functional adaptation and its molecular basis in vertebrate hemoglobins, neuroglobins, and cytoglobins. Respir. Physiol. Neurobiol. 144, 141–159 [DOI] [PubMed] [Google Scholar]
- 5. Weber R. E. (1990) in Animal Nutrition and Transport Processes (Truchot J. P., Lahlou B., eds) pp. 58–75, S. Karger AG, Basel, Switzerland [Google Scholar]
- 6. Weber R. E. (1995) in Hypoxia and the Brain: Proceedings of the 9th International Hypoxia Symposium (Sutton J. R., Houston C. S., Coates G., eds) pp. 31–44, Queen City Printers, Burlington, VT [Google Scholar]
- 7. Weber R. E. (2000) in Hemoglobin Function in Vertebrates: Molecular Adaptation in Extreme and Temperate Environments (Di Prisco G., Giardina B., Weber R. E., eds) pp. 23–37, Springer-Verlag, Inc., New York [Google Scholar]
- 8. Ingermann R. I. (1997) Handbook of Physiology, pp. 357–408, American Physiological Society, Bethesda [Google Scholar]
- 9. Weber R. E., Fago A., Val A. L., Bang A., Van Hauwaert M. L., Dewilde S., Zal F., Moens L. (2000) Isohemoglobin differentiation in the bimodal-breathing Amazon catfish Hoplosternum littorale. J. Biol. Chem. 275, 17297–17305 [DOI] [PubMed] [Google Scholar]
- 10. Baumann R., Fischer J., Engelke M. (1987) Functional properties of primitive and definitive red cells from chick embryo. Oxygen-binding characteristics, pH, and membrane potential and response to hypoxia. J. Exp. Zool. Suppl. 1, 227–238 [PubMed] [Google Scholar]
- 11. Hiebl I., Weber R. E., Schneeganss D., Kösters J., Braunitzer G. (1988) High altitude respiration of birds. Structural adaptations in the major and minor hemoglobin component of adult Rüppell's griffon (Gyps rueppellii, Aegypiinae). A new molecular pattern for hypoxic tolerance. Biol. Chem. Hoppe-Seyler 369, 217–232 [DOI] [PubMed] [Google Scholar]
- 12. Hiebl I., Weber R. E., Schneeganss D., Braunitzer G. (1989) High altitude respiration of Falconiformes. The primary structure and functional properties of the major and minor hemoglobin components of the adult white-headed vulture (Trigonoceps occipitalis, Aegypiinae). Biol. Chem. Hoppe-Seyler 370, 699–706 [DOI] [PubMed] [Google Scholar]
- 13. Isaacks R. E., Harkness D. R., Adler J. L., Goldman P. H. (1976) Studies on avian erythrocyte metabolism. Effect of organic phosphates on oxygen affinity of embryonic and adult-type hemoglobins of the chick embryo. Arch. Biochem. Biophys. 173, 114–120 [DOI] [PubMed] [Google Scholar]
- 14. Nothum R., Weber R. E., Kösters J., Schneeganss D., Braunitzer G. (1989) Amino acid sequences and functional differentiation of hemoglobins A and D from swift (Apus, Apodiformes). Biol. Chem. Hoppe-Seyler 370, 1197–1207 [DOI] [PubMed] [Google Scholar]
- 15. Oberthür W., Braunitzer G., Baumann R., Wright P. G. (1983) Primary structures of the α- and β-chains from the major hemoglobin component of the ostrich (Struthio camelus) and American rhea (Rhea americana) (Struthioformes). Aspects of respiratory physiology and taxonomy. Hoppe-Seyler's Z. Physiol. Chem. 363, 119–134 [PubMed] [Google Scholar]
- 16. Rana M. S., Knapp J. E., Holland R. A., Riggs A. F. (2008) Component D of chicken hemoglobin and the hemoglobin of the embryonic Tammar wallaby (Macropus eugenii) self-associate upon deoxygenation. Effect on oxygen binding. Proteins 70, 553–561 [DOI] [PubMed] [Google Scholar]
- 17. Sanna M. T., Manconi B., Podda G., Olianas A., Pellegrini M., Castagnola M., Messana I., Giardina B. (2007) Alkaline Bohr effect of bird hemoglobins. The case of the flamingo. Biol. Chem. 388, 787–795 [DOI] [PubMed] [Google Scholar]
- 18. Tamburrini M., Riccio A., Romano M., Giardina B., di Prisco G. (2000) Structural and functional analysis of the two hemoglobins of the Antarctic seabird Catharacta maccormicki. Characterization of an additional phosphate-binding site by molecular modeling. Eur. J. Biochem. 267, 6089–6098 [DOI] [PubMed] [Google Scholar]
- 19. Vandecasserie C., Paul C., Schnek A. G., Léonis J. (1973) Oxygen affinity of avian hemoglobins. Comp. Biochem. Physiol. A 44, 711–718 [DOI] [PubMed] [Google Scholar]
- 20. Weber R. E., Hiebl I., Braunitzer G. (1988) High altitude and hemoglobin function in the vultures Gyps rueppellii and Aegypius monachus. Biol. Chem. Hoppe-Seyler 369, 233–240 [PubMed] [Google Scholar]
- 21. Lutz P. L. (1980) On the oxygen affinity of bird blood. Am. Zool. 20, 187–198 [DOI] [PubMed] [Google Scholar]
- 22. Cobb J. A., Manning D., Kolatkar P. R., Cox D. J., Riggs A. F. (1992) Deoxygenation-linked association of a tetrameric component of chicken hemoglobin. J. Biol. Chem. 267, 1183–1189 [PubMed] [Google Scholar]
- 23. Knapp J. E., Oliveira M. A., Xie Q., Ernst S. R., Riggs A. F., Hackert M. L. (1999) The structural and functional analysis of the hemoglobin D component from chicken. J. Biol. Chem. 274, 6411–6420 [DOI] [PubMed] [Google Scholar]
- 24. Rana M. S., Riggs A. F. (2011) Indefinite noncooperative self-association of chicken deoxy hemoglobin D. Proteins 79, 1499–1512 [DOI] [PubMed] [Google Scholar]
- 25. Riggs A. F. (1998) Self-association, cooperativity, and supercooperativity of oxygen binding by hemoglobins. J. Exp. Biol. 201, 1073–1084 [DOI] [PubMed] [Google Scholar]
- 26. Perutz M. F., Steinkraus L. K., Stockell A., Bangham A. D. (1959) Chemical and crystallographic study of the two fractions of adult horse hemoglobin. J. Mol. Biol. 1, 402–404 [Google Scholar]
- 27. Riggs A. (1976) Factors in the evolution of hemoglobin function. Fed. Proc. 35, 2115–2118 [PubMed] [Google Scholar]
- 28. Riggs A. (1979) Studies of the hemoglobins of Amazonian fishes. Overview. Comp. Biochem. Physiol. 62, 257–272 [Google Scholar]
- 29. Nikinmaa M. (2001) Hemoglobin function in vertebrates. Evolutionary changes in cellular regulation in hypoxia. Respir. Physiol. 128, 317–329 [DOI] [PubMed] [Google Scholar]
- 30. Jensen F. B. (2004) Red blood cell pH, the Bohr effect, and other oxygenation-linked phenomena in blood O2 and CO2 transport. Acta Physiol. Scand. 182, 215–227 [DOI] [PubMed] [Google Scholar]
- 31. Hoffmann F. G., Storz J. F. (2007) The αD-globin gene originated via duplication of an embryonic α-like globin gene in the ancestor of tetrapod vertebrates. Mol. Biol. Evol. 24, 1982–1990 [DOI] [PubMed] [Google Scholar]
- 32. Hoffmann F. G., Storz J. F., Gorr T. A., Opazo J. C. (2010) Lineage-specific patterns of functional diversification in the α- and β-globin gene families of tetrapod vertebrates. Mol. Biol. Evol. 27, 1126–1138 [DOI] [PMC free article] [PubMed] [Google Scholar]
- 33. Storz J. F., Opazo J. C., Hoffmann F. G. (2011) Phylogenetic diversification of the globin gene superfamily in chordates. IUBMB Life 63, 313–322 [DOI] [PMC free article] [PubMed] [Google Scholar]
- 34. Cirotto C., Panara F., Arangi I. (1987) The minor hemoglobins of primitive and definitive erythrocytes of the chicken embryo. Evidence for hemoglobin L. Development 101, 805–813 [DOI] [PubMed] [Google Scholar]
- 35. Alev C., Shinmyozu K., McIntyre B. A., Sheng G. (2009) Genomic organization of zebra finch α- and β-globin genes and their expression in primitive and definitive blood in comparison with globins in chicken. Dev. Genes Evol. 219, 353–360 [DOI] [PubMed] [Google Scholar]
- 36. Storz J. F., Hoffmann F. G., Opazo J. C., Sanger T. J., Moriyama H. (2011) Developmental regulation of hemoglobin synthesis in the green anole lizard, Anolis carolinensis. J. Exp. Biol. 214, 575–581 [DOI] [PMC free article] [PubMed] [Google Scholar]
- 37. Weber R. E., White F. N. (1986) Oxygen binding in alligator blood related to temperature, diving, and “alkaline tide.” Am. J. Physiol. 251, R901–R908 [DOI] [PubMed] [Google Scholar]
- 38. Weber R., White F. (1994) Chloride-dependent organic phosphate sensitivity of the oxygenation reaction in crocodilian hemoglobins. J. Exp. Biol. 192, 1–11 [DOI] [PubMed] [Google Scholar]
- 39. Grigg G. C., Wells R. M. G., Beard L. A. (1993) Allosteric control of oxygen binding by hemoglobin during development in the crocodile Crocodylus porosus. The role of red cell organic phosphates and carbon dioxide. J. Exp. Biol. 175, 15–32 [Google Scholar]
- 40. Hoffmann F. G., Opazo J. C., Storz J. F. (2008) Rapid rates of lineage-specific gene duplication and deletion in the α-globin gene family. Mol. Biol. Evol. 25, 591–602 [DOI] [PubMed] [Google Scholar]
- 41. Hoffmann F. G., Opazo J. C., Storz J. F. (2011) Differential loss and retention of myoglobin, cytoglobin, and globin-E during the radiation of vertebrates. Genome Biol. Evol. 3, 588–600 [DOI] [PMC free article] [PubMed] [Google Scholar]
- 42. Brittain T. (2002) Molecular aspects of embryonic hemoglobin function. Mol. Aspects Med. 23, 293–342 [DOI] [PubMed] [Google Scholar]
- 43. Weber R. E., Ostojic H., Fago A., Dewilde S., Van Hauwaert M. L., Moens L., Monge C. (2002) Novel mechanism for high altitude adaptation in hemoglobin of the Andean frog Telmatobius peruvianus. Am. J. Physiol. Regul. Integr. Comp. Physiol. 283, R1052–R1060 [DOI] [PubMed] [Google Scholar]
- 44. Weber R. E., Voelter W., Fago A., Echner H., Campanella E., Low P. S. (2004) Modulation of red cell glycolysis. Interactions between vertebrate hemoglobins and cytoplasmic domains of band 3 red cell membrane proteins. Am. J. Physiol. Regul. Integr. Comp. Physiol. 287, R454–R464 [DOI] [PubMed] [Google Scholar]
- 45. Brygier J., Paul C. (1976) Oxygen equilibrium of chicken hemoglobin in the presence of organic phosphates. Biochimie 58, 755–756 [DOI] [PubMed] [Google Scholar]
- 46. Monod J., Wyman J., Changeux J. P. (1965) On the nature of allosteric transitions. A plausible model. J. Mol. Biol. 12, 88–118 [DOI] [PubMed] [Google Scholar]
- 47. Weber R. E., Malte H., Braswell E. H., Oliver R. W., Green B. N., Sharma P. K., Kuchumov A., Vinogradov S. N. (1995) Mass spectrometric composition, molecular mass, and oxygen binding of Macrobdella decora hemoglobin and its tetramer and monomer subunits. J. Mol. Biol. 251, 703–720 [DOI] [PubMed] [Google Scholar]
- 48. Adair G. S. (1925) The hemoglobin system. IV. The oxygen dissociation curve of hemoglobin. J. Biol. Chem. 63, 529–545 [Google Scholar]
- 49. Ferry M. F., Green A. A. (1929) Studies in the chemistry of hemoglobin. III. The equilibrium between oxygen and hemoglobin and its relation to changing hydrogen ion activity. J. Biol. Chem. 81, 175–203 [Google Scholar]
- 50. Imai K. (1982) Allosteric Effects in Hemoglobin, Cambridge University, Press, Cambridge, UK [Google Scholar]
- 51. Weber R. E. (1992) Use of ionic and zwitterionic (Tris/BisTris and HEPES) buffers in studies on hemoglobin function. J. Appl. Physiol. 72, 1611–1615 [DOI] [PubMed] [Google Scholar]
- 52. Arnold K., Bordoli L., Kopp J., Schwede T. (2006) The SWISS-MODEL Workspace. A web-based environment for protein structure homology modeling. Bioinformatics 22, 195–201 [DOI] [PubMed] [Google Scholar]
- 53. Riccio A., Tamburrini M., Giardina B., di Prisco G. (2001) Molecular dynamics analysis of a second phosphate site in the hemoglobins of the seabird, south polar skua. Is there a site-site migratory mechanism along the central cavity? Biophys. J. 81, 1938–1946 [DOI] [PMC free article] [PubMed] [Google Scholar]
- 54. Jo S., Kim T., Iyer V. G., Im W. (2008) CHARMM-GUI. A web-based graphical user interface for CHARMM. J. Comput. Chem. 29, 1859–1865 [DOI] [PubMed] [Google Scholar]
- 55. Gasteiger E., Gattiker A., Hoogland C., Ivanyi I., Appel R. D., Bairoch A. (2003) ExPASy. The proteomics server for in-depth protein knowledge and analysis. Nucleic Acids Res. 31, 3784–3788 [DOI] [PMC free article] [PubMed] [Google Scholar]
- 56. Trott O., Olson A. J. (2010) AutoDock Vina. Improving the speed and accuracy of docking with a new scoring function, efficient optimization, and multithreading. J. Comput. Chem. 31, 455–461 [DOI] [PMC free article] [PubMed] [Google Scholar]
- 57. Hoffmann F. G., Opazo J. C., Storz J. F. (2012) Whole-genome duplication spurred the functional diversification of the globin gene superfamily in vertebrates. Mol. Biol. Evol. 29, 303–312 [DOI] [PMC free article] [PubMed] [Google Scholar]
- 58. Gribaldo S., Casane D., Lopez P., Philippe H. (2003) Functional divergence prediction from evolutionary analysis. A case study of vertebrate hemoglobin. Mol. Biol. Evol. 20, 1754–1759 [DOI] [PubMed] [Google Scholar]
- 59. Gu X. (2001) Maximum-likelihood approach for gene family evolution under functional divergence. Mol. Biol. Evol. 18, 453–464 [DOI] [PubMed] [Google Scholar]
- 60. Shannon C. E. (1948) A mathematical theory of communication. Bell System Tech. J. 27, 379–423, 623–656 [Google Scholar]
- 61. Yang Z., Kumar S., Nei M. (1995) A new method of inference of ancestral nucleotide and amino acid sequences. Genetics 141, 1641–1650 [DOI] [PMC free article] [PubMed] [Google Scholar]
- 62. Cao Y., Adachi J., Janke A., Pääbo S., Hasegawa M. (1994) Phylogenetic relationships among eutherian orders estimated from inferred sequences of mitochondrial proteins. Instability of a tree based on a single gene. J. Mol. Evol. 39, 519–527 [DOI] [PubMed] [Google Scholar]
- 63. Whelan S., Goldman N. (2001) A general empirical model of protein evolution derived from multiple protein families using a maximum-likelihood approach. Mol. Biol. Evol. 18, 691–699 [DOI] [PubMed] [Google Scholar]
- 64. Yang Z. (2007) PAML 4. Phylogenetic analysis by maximum likelihood. Mol. Biol. Evol. 24, 1586–1591 [DOI] [PubMed] [Google Scholar]
- 65. Edgar R. C. (2004) MUSCLE. Multiple sequence alignment with high accuracy and high throughput. Nucleic Acids Res. 32, 1792–1797 [DOI] [PMC free article] [PubMed] [Google Scholar]
- 66. Hackett S. J., Kimball R. T., Reddy S., Bowie R. C., Braun E. L., Braun M. J., Chojnowski J. L., Cox W. A., Han K. L., Harshman J., Huddleston C. J., Marks B. D., Miglia K. J., Moore W. S., Sheldon F. H., Steadman D. W., Witt C. C., Yuri T. (2008) A phylogenomic study of birds reveals their evolutionary history. Science 320, 1763–1768 [DOI] [PubMed] [Google Scholar]
- 67. Gill S. J., Gaud H. T., Barisas B. G. (1980) Calorimetric studies of carbon monoxide and inositol hexaphosphate binding to hemoglobin A. J. Biol. Chem. 255, 7855–7857 [PubMed] [Google Scholar]
- 68. Wyman J., Jr. (1964) Linked functions and reciprocal effects in hemoglobin. A second look. Adv. Protein Chem. 19, 223–286 [DOI] [PubMed] [Google Scholar]
- 69. Tyuma I., Imai K., Shimizu K. (1973) Analysis of oxygen equilibrium of hemoglobin and control mechanism of organic phosphates. Biochemistry 12, 1491–1498 [DOI] [PubMed] [Google Scholar]
- 70. Weber R. E., Jensen F. B., Cox R. P. (1987) Analysis of teleost hemoglobin by Adair and Monod-Wyman-Changeux models. Effects of nucleoside triphosphates and pH on oxygenation of tench hemoglobin. J. Comp. Physiol. B 157, 145–152 [DOI] [PubMed] [Google Scholar]
- 71. Binotti I., Giovenco S., Giardina B., Antonini E., Brunori M., Wyman J. (1971) Studies on the functional properties of fish hemoglobins. II. The oxygen equilibrium of the isolated hemoglobin components from trout blood. Arch. Biochem. Biophys. 142, 274–280 [DOI] [PubMed] [Google Scholar]
- 72. Weber R. E., Jensen F. B. (1988) Functional adaptations in hemoglobins from ectothermic vertebrates. Annu. Rev. Physiol. 50, 161–179 [DOI] [PubMed] [Google Scholar]
- 73. Weber R. E. (1996) in Physiology and Biochemistry of the Fishes of the Amazon (Val A. L., Almeida-Val V. M., Randall D. J., eds) pp. 75–90, INPA, Brazil [Google Scholar]
- 74. Saha A., Ghosh J. (1965) Comparative studies on avian hemoglobins. Comp. Biochem. Physiol. 15, 217–235 [DOI] [PubMed] [Google Scholar]
- 75. Lee K. S., Huang P. C., Cohen B. H. (1976) Further resolution of adult chick hemoglobins by isoelectric focusing in polyacrylamide gel. Biochim. Biophys. Acta 427, 178–196 [DOI] [PubMed] [Google Scholar]
- 76. Godovac-Zimmermann J., Braunitzer G. (1984) Hemoglobin of the adult white stork (Ciconia, Ciconiiformes). The primary structure of αA- and β-chains from the only present hemoglobin component. Hoppe-Seyler's Z. Physiol. Chem. 365, 1107–1113 [DOI] [PubMed] [Google Scholar]
- 77. Godovac-Zimmermann J., Braunitzer G. (1985) The primary structure of αA- and β-chains from blue-and-yellow macaw (Ara ararauna, Psittaci) hemoglobin. No evidence for expression of αD-chains. Biol. Chem. Hoppe-Seyler 366, 503–508 [DOI] [PubMed] [Google Scholar]
- 78. Oberthür W., Godovac-Zimmermann J., Braunitzer G. (1986) The expression of αD-chains in the hemoglobin of adult ostrich (Struthio camelus) and American rhea (Rhea americana). The different evolution of adult bird αA-, αD-, and β-chains. Biol. Chem. Hoppe-Seyler 367, 507–514 [DOI] [PubMed] [Google Scholar]
- 79. Sultana C., Abbasi A., Zaidi Z. H. (1989) Primary structure of hemoglobin α-chain of Columba livia (gray wild pigeon). J. Protein Chem. 8, 629–646 [DOI] [PubMed] [Google Scholar]
- 80. Tamburrini M., Condò S. G., di Prisco G., Giardina B. (1994) Adaptation to extreme environments. Structure-function relationships in emperor penguin hemoglobin. J. Mol. Biol. 237, 615–621 [DOI] [PubMed] [Google Scholar]
- 81. Hiebl I., Kösters J., Braunitzer G. (1987) The primary structures of the major and minor hemoglobin component of adult goshawk (Accipiter gentilis, Accipitrinae). Biol. Chem. Hoppe-Seyler 368, 333–342 [DOI] [PubMed] [Google Scholar]
- 82. Abbasi A., Lutfullah G. (2002) Molecular basis of bird respiration. Primary hemoglobin structure component from tufted duck (Aythya fuligula, Anseriformes). Role of αArg-99 in formation of a complex salt bridge network. Biochem. Biophys. Res. Commun. 291, 176–184 [DOI] [PubMed] [Google Scholar]
- 83. Lutfullah G., Ali S. A., Abbasi A. (2005) Molecular mechanism of high altitude respiration. Primary structure of a minor hemoglobin component from tufted duck (Aythya fuligula, Anseriformes). Biochem. Biophys. Res. Commun. 326, 123–130 [DOI] [PubMed] [Google Scholar]
- 84. Arnone A., Perutz M. F. (1974) Structure of inositol hexaphosphate-human deoxyhemoglobin complex. Nature 249, 34–36 [DOI] [PubMed] [Google Scholar]
- 85. Zuiderweg E. R., Hamers L. F., Rollema H. S., de Bruin S. H., Hilbers C. W. (1981) 31P NMR study of the kinetics of binding of myo-inositol hexakisphosphate to human hemoglobin. Observation of fast exchange kinetics in high affinity systems. Eur. J. Biochem. 118, 95–104 [DOI] [PubMed] [Google Scholar]
- 86. Amiconi G., Bertollini A., Bellelli A., Coletta M., Condò S. G., Brunori M. (1985) Evidence for two oxygen-linked binding sites for polyanions in dromedary hemoglobin. Eur. J. Biochem. 150, 387–393 [DOI] [PubMed] [Google Scholar]
- 87. Mills F. C., Johnson M. L., Ackers G. K. (1976) Oxygenation-linked subunit interactions in human hemoglobin. Experimental studies on the concentration dependence of oxygenation curves. Biochemistry 15, 5350–5362 [DOI] [PubMed] [Google Scholar]
Associated Data
This section collects any data citations, data availability statements, or supplementary materials included in this article.