

Abstract
The study assessed possible age differences in brain activation patterns to low dose ethanol (0.5 g/kg intraperitoneally) and the influence of social context on this activation. Early adolescent or young adult male Sprague-Dawley rats were placed either alone or with an unfamiliar partner of the same age and sex following saline or ethanol administration. c-Fos protein immunoreactivity was used to index neuronal activation in 15 regions of interest. Ethanol had little effect on c-Fos activation. In adolescents, social context activated an “autonomic” network including the basolateral and central amygdala, bed nucleus of the stria terminalis, lateral hypothalamus and lateral septum. In contrast, when adult rats were alone, activation was evident in a “reward” network that included the substantia nigra, nucleus accumbens, anterior cingulate and orbitofrontal cortices, lateral parabrachial nucleus, and locus coeruleus.
Keywords: Rat, adolescent, alcohol, social context, immediate early genes, reward system, autonomic system
INTRODUCTION
Social interactions with peers take on increasing importance during adolescence. Individuals spend more time with peers during adolescence than during any other developmental period (Hartup & Stevens, 1997), and these interactions provide a significant source of positive experiences for them (Brown, 2004; Steinberg & Morris, 2001). Similar to their human counterparts, adolescent rats interact more with peers (Vanderschuren, Niesink, & Van Ree, 1997, Varlinskaya & Spear, 2008) and find these social interactions more reinforcing than do adults (e.g., Douglas, Varlinskaya, & Spear, 2004).
Other characteristic adolescent behaviors, such as the pervasive use of alcohol (Johnston, O’Malley, Bachman, & Schulenberg, 2010), may interact with social context in a mutually facilitating way. Social context serves as an important predictor of alcohol use and misuse during adolescence, with most adolescent alcohol use occurring in a social context (Read, Wood, Kahler, Maddock, & Palfai, 2003). Only 25% of adolescents stated that they were alone the last time they drank alcohol (Udry, 1998), with adolescents often reporting that they drink to facilitate and ease social interactions (Beck & Treiman, 1996). Reminiscent of their human counterparts, adolescent rats also exhibit greater voluntary intake of ethanol than adults (Brunell & Spear, 2005; Vetter, Doremus-Fitzwater, & Spear, 2007; Vetter-O’Hagen, Varlinskaya, & Spear, 2009), show enhanced alcohol intake by social contact with intoxicated peers in a dose-dependent manner (Hunt, Holloway, & Scordalakes, 2001), and are notably more sensitive to the social facilitating effects of low doses of ethanol than are adults (Varlinskaya & Spear, 2002; Willey, Varlinskaya, & Spear, 2009). Social context may facilitate ethanol intake in part by attenuating aversive effects of alcohol (Gauvin, Briscoe, Goulden, & Holloway, 1994) that presumably serve as cues to limit intake, with this social context-related dampening of aversion more pronounced among adolescent than adult male rats (Vetter-O’Hagen et al., 2009). The effects of social context on ethanol-induced brain activation have received little attention.
Human imaging studies have shown that brain activation induced by social stimuli dramatically change during development in brain regions such as the amygdala and orbitofrontal cortex, regions which themselves undergo functional changes and structural reorganization during adolescence (see Blakemore, 2008; Burnett, Sebastian, Cohen Kadosh, & Blakemore, 2010, for review). A recent human functional magnetic imaging (fMRI) study (Chein, Albert, O’Brien, Uckert & Steinberg, 2011) demonstrated that patterns of activation in reward-relevant regions such as the ventral striatum and medial orbitofrontal cortex during a risky simulated driving task were enhanced by the presence of peers in adolescents, but not adults, even though these peers were in an adjacent room and could not interact or encourage the test participants directly.
Expression of immediate early genes (IEGs) such as c-fos have been used as an index of neuronal activation to stimuli including social context (e.g., Fleming, Suh, Korsmit, & Rusak, 1994), ethanol exposure (e.g. Criado & Morales, 2000; Ryabinin, Criado, Henriksen, Bloom, & Wilson, 1997), and stressors (e.g., Weinberg, Grissom, Paul, Bhatnagar, Maier, & Spencer, 2010) in work conducted largely in adult animals. During adolescence as well, a number of studies (Kalinichev, Rosenblatt, Nakabeppu, & Morrell, 2000; Gordon, Kollack-Walker, Akil, & Panksepp, 2002; Lawrence, Bonner, Newsom, & Kelly, 2008) have found social stimuli to induce regionally specific expression of c-Fos protein – a product of the IEG c-fos (Sager, Sharp, & Curran, 1988). Only a few studies, however, have included both adolescent and adult groups to allow ontogenetic comparisons of regional activation patterns. A study by Kalinichev and colleagues (2000) reported notably different neural activation patterns in response to rat pups among adolescent and adult rats previously made maternal by prior continuous exposure to the pups, with maternal adults but not their young adolescent counterparts showing pup-associated recruitment in the amygdala and extended amygdala (Kalinichev et al, 2000). Age differences between adolescent and adult rats have also been reported in response to stressors, with adolescents showing less stress-related Fos-like immunoreactivity in some brain regions (e.g., medial and cortical amygdala nuclei; prefrontal and orbital cortex) but either no differences (e.g., lateral septum, lateral hypothalamus) or increases (e.g., nucleus accumbens shell) in activation in other brain regions relative to adults (Kellogg, Awatramani, & Piekut, 1998). Whether brain activation patterns to ethanol and the influence of social context on this activation differ between adolescents and adults has yet to be explored, and was the focus of the present investigation.
A number of studies have shown c-Fos expression following acute ethanol administration (Chang, Patel, & Romero, 1995; Hitzemann & Hitzemann, 1997; Knapp, Braun, Duncan, Qian, Fernandes, Crews, & Breese, 2001; Ryabinin et al., 1997). In rats, intraperitoneal injections of ethanol induced Fos immunoreactivity in a number of brain regions, including the bed nucleus of the stria terminalis, paraventricular hypothalamic nucleus, the central nucleus of amygdala, Edinger-Westphal nucleus, locus coeruleus, parabrachial nucleus, and the ventral tegmental area (Chang et al., 1995; Ryabinin et al., 1997). Whether ethanol-induced c-Fos immunoreactivity would be similar in adolescent and adult animals has received little attention to date. One exception is work by Faria and colleagues (2008) where they found no age differences in ethanol-induced IEG expression between adolescent and adult mice in brain regions such as the prefrontal cortex and nucleus accumbens following acute injection of 2.0 g/kg ethanol, a dose that produced reliable locomotor stimulation at both ages.
We predicted that adolescents and adults would show similar patterns of brain activation to the social stimulus, although greater activation would be evident among adolescents, particularly following exposure to a low dose of ethanol previously shown to facilitate social behavior in adolescent but not adult rats (e.g., Varlinskaya & Spear, 2002, 2006). The 15 regions of interest (ROI) listed in Table 1 were chosen based on areas known to be sensitive to IEG activation by social context and/or to ethanol challenge (Chang et al., 1995; Hitzemann & Hitzemann, 1997; Kalinichev et al, 2000; Kellogg et al, 1998; Knapp et al., 2001; Ryabinin et al., 1997). The results obtained contrasted markedly with our predictions: social context and its absence induced dramatically different patterns of brain activation among adolescents and adults, regardless of whether or not they had been challenged with ethanol.
Table 1.
Means, standard errors, significant main effects and interactions.
| Region and Treatment | Adolescent | Adult | Age F(1,52) | Context F(1,52) | Age x Context F(1,52) | |||
|---|---|---|---|---|---|---|---|---|
| Alone | Social | Alone | Social | |||||
| CeA | Sal | 8.8 ± 2.5 | 18.8 ± 5.6 | 10.6 ± 4.0 | 12.0 ± 2.9 | _ | 5.130 * | 7.186 ** |
| EtOH | 5.8 ± 2.4 | 21.0 ± 4.1 | 7.5 ± 2.7 | 4.0 ± 2.2 | ||||
| BLA | Sal | 13.3 ± 4.1 | 24.6 ± 5.1 | 15.8 ± 5.8 | 18.8 ± 5.8 | _ | _ | 4.253 * |
| EtOH | 7.9 ± 2.9 | 24.0 ± 5.5 | 11.0 ± 2.9 | 7.1 ± 4.8 | ||||
| BNST | Sal | 4.5 ± 1.5 | 25.4 ± 11.1 | 10.6 ± 3.2 | 15.5 ± 8.7 | _ | _ | 4.436 * |
| EtOH | 8.0 ± 4.9 | 20.3 ± 4.6 | 13.2 ± 4.1 | 6.0 ± 3.4 | ||||
| LH | Sal | 15.2 ± 3.9 | 45.9 ±16.7 | 27.9 ± 8.3 | 26.7 ± 13.4 | _ | _ | 8.059 ** |
| EtOH | 15.0 ± 3.2 | 52.4 ± 12.8 | 25.2 ± 7.2 | 13.4 ± 6.0 | ||||
| LS | Sal | 12.1 ± 4.0 | 37.1 ± 12.7 | 21.5 ± 7.1 | 13.5 ± 5.0 | _ | _ | 5.333 * |
| EtOH | 19.1 ± 13.2 | 25.5 ± 4.9 | 28.0 ± 13.2 | 7.4 ± 6.7 | ||||
| ACC | Sal | 16.1 ± 6.4 | 72.3 ± 16.5 | 185.2 ± 67.4 | 53.7 ± 15.2 | 17.050 ** | 8.178 ** | 19.978 ** |
| EtOH | 13.9 ± 5.3 | 52.1 ± 14.2 | 348.8 ± 99.7 | 50.8 ± 35.3 | ||||
| VMO | Sal | 36.3 ± 13.5 | 108.9 ± 23.0 | 142.8 ± 53.6 | 89.8 ± 31.0 | 8.191 ** | _ | 7.711 ** |
| EtOH | 30.5 ± 18.8 | 47.4 ± 16.1 | 211.2 ± 64.0 | 70.8 ± 44.5 | ||||
| nAcS | Sal | 5.8 ± 1.6 | 13.6 ± 5.7 | 23.0 ± 10.4 | 16.5 ± 5.2 | 4.507 * | _ | 6.242 * |
| EtOH | 6.0 ± 2.7 | 12.1 ± 6.7 | 30.2 ± 9.9 | 5.9 ± 3.6 | ||||
| nAcC | Sal | 0.13 ± 0.13 | 3.8 ± 1.0 | 14.0 ± 8.2 | 2.3 ± 1.4 | 6.307 * | _ | 6.236 * |
| EtOH | 1.0 ± 0.6 | 3.4 ± 1.9 | 16.2 ± 7.2 | 4.9 ± 3.9 | ||||
| PBI | Sal | 2.8 ± 1.1 | 4.6 ± 1.4 | 9.5 ± 4.0 | 4.1 ± 2.0 | 8.157 ** | 4.517 * | 11.564 ** |
| EtOH | 1.6 ± 1.1 | 3.8 ± 1.8 | 14.5 ± 3.3 | 2.5 ± 1.5 | ||||
| SN | Sal | 1.9 ± .7 | 7.0 ± 2.0 | 12.9 ± 6.0 | 7.8 ± 5.3 | 4.659 * | _ | 7.939 ** |
| EtOH | 4.4 ± 2.3 | 7.6 ± 2.3 | 16.3 ± 2.2 | 3.8 ± 2.0 | ||||
| LC | Sal | 3.3 ± 1.3 | 8.6 ± 3.0 | 18.8 ± 4.1 | 10.3 ± 4.7 | _ | _ | 4.447 * |
| EtOH | 6.3 ± 4.0 | 6.9 ± 2.3 | 7.8 ± 1.7 | 3.8 ± 2.3 | ||||
| EW | Sal | 5.0 ± 1.9 | 18.9 ± 8.6 | 11.8 ± 3.7 | 14.2 ± 4.6 | _ | 4.349 * | _ |
| EtOH | 8.3 ± 4.5 | 19.3 ± 4.4 | 13.3 ± 5.5 | 16.0 ± 4.2 | ||||
| PVN | Sal | 22.0 ± 6.9 | 58.8 ± 19.6 | 54.6 ± 25.3 | 33.2 ± 15.9 | _ | _ | _ |
| EtOH | 33.8 ± 21.1 | 36.1 ± 9.1 | 26.7 ± 11.8 | 6.4 ± 3.3 | ||||
| VTA | Sal | 17.0 ± 4.1 | 35.8 ± 11.4 | 35.9 ± 12.6 | 28.2 ± 15.2 | _ | _ | _ |
| EtOH | 14.4 ± 6.6 | 28.6 ± 3.3 | 29.5 ± 10.5 | 26.1 ± 9.9 | ||||
- p < 0.05
- p <0.01
MATERIALS AND METHODS
Subjects
A total of 72 male Sprague-Dawley rats bred and reared in our colony at Binghamton University were used. Animals were maintained on a 14/10 hr light/dark cycle (lights on at 0700 hr) in a temperature-controlled vivarium and given ad libitum access to food (Purina Rat Chow, Lowell, MA) and water. Within 24 hours after birth [postnatal day (P) 0], litters were culled to 10 animals, with an equal number of animals of each sex, and were housed until weaning with their dams in standard opaque maternity cages with pine shaving as bedding. Animals were weaned at P21 and housed in groups of 5 same sex littermates. Animals were tested either as early adolescents on P28 or as adults on P70.
All procedures involving the handling of animals were conducted in accord with guidelines established by the National Institutes of Health and approved by the Institution Animal Care and Use Committee at Binghamton University.
Experimental Design
The design of this project was a 2 Age (early adolescent, adult) × 2 Test Context (social, alone) × 2 Ethanol Dose (0, 0.5 g/kg) factorial, with 8 animals assigned to each of the eight groups defined by this factorial design. An additional 4 animals at each age were euthanized immediately upon removal from the home cage (home cage controls). To avoid possible confounding of litter effects with variables of interest, no more than one animal from a given litter was assigned to any given experimental condition (Holson & Pearce, 1992). Animals were tested during early adolescence (P28) given that peer-directed social behaviors in rats are particularly marked at this time, declining gradually over the course of adolescence (Varlinskaya & Spear, 2008).
Procedure
Given that animals interact more socially under familiar than unfamiliar test circumstances both in adolescence and in adulthood (Varlinskaya & Spear, 2002, 2008), on the day prior to tissue collection, all animals were individually pre-exposed to the test apparatus for 30 minutes. Each social test apparatus consisted of a Plexiglas chamber (30 × 20 × 20 cm for adolescents, 45 × 30 × 30 cm for adults) containing clean pine shavings and divided into two compartments by a clear Plexiglas partition containing an aperture (7 × 5 cm for adolescents, 9 × 7 cm for adults) to allow movement of animals between compartments (see Varlinskaya & Spear, 2002). On test day, animals were intraperitoneally injected with either saline (0.9% NaCl solution) or 0.5 g/kg ethanol (as a 12.6% v/v solution) and placed alone in a holding cage for 30 minutes. Animals were then placed into the test chamber either alone or with a same-sex, same-age unfamiliar partner for 60 minutes followed immediately thereafter by anesthetization for perfusion and collection of brain tissue. Therefore, brain samples were taken 90 minutes following ethanol administration, a time interval frequently used in studies assessing ethanol effects on c-Fos immunoreactivity (Chang, Patel, & Romero, 1995; Hitzemann & Hitzemann, 1997; Knapp, Braun, Duncan, Qian, Fernandes, Crews, & Breese, 2001; Ryabinin et al., 1997).
Preparation and Measurement of c-Fos Immunoreactivity
Rats were anesthetized with an excess of ketamine/xylazine and perfused intracardially with 50 ml cold saline followed by 300 ml cold 4% paraformaldehyde over 30 minutes. The brains were removed and kept in fixative for 2–3 days followed by soaking in 10% sucrose for 2 days, 20% for 3 days and 30% until they sank. The brains were sectioned in the coronal plane at a 40-μm thickness with a cryostat in 4 series; one was stained with thionin and another processed for c-Fos. The brains were sectioned in the coronal plane at a 40-μm thickness with a cryostat. Four series were collected; one series was stained with thionin and another was processed for c-Fos. The remaining two series were used to trial incubation parameters and as a backup. Each series had about 78 sections and there were 72 animals for a total of 5,600 sections. Instead, they were processed in groups of 6 brains at a time with subjects from each group mixed to assure comparability of immunoreactions.
Although reaction parameters were modified to achieve maximal c-Fos labeling for our tissue, similar protocols have been used recently (McCormick & Ibrahim, 2007; Thiel, Pentkowski, Peartree, Painter, & Neisewander, 2010). Floating sections were pretreated in 5% normal goat serum in phosphate buffered saline (PBS) with 0.3% Triton X-100 and 0.5% bovine serum albumin (BSA) and then incubated in c-Fos antibody (sc-52; Santa Cruz Biotechnology, CA) at 1:10,000 dilution in PBS/Triton X-100/BSA overnight at 4oC. After rinsing they were incubated in biotinylated goat anti-rabbit (1:200 dilution in PBS/Triton X-100/BSA) for one hour, rinsed and incubated in ABC solution (1:4 dilution; Vector Labs, CA) in PBS for one hour, rinsed and incubated in 0.05% diaminobenzidine, 0.01% hydrogen peroxide in a 1:10 dilution of PBS for 5 min. Two controls verified that the c-Fos antibody reaction was specific. In one, the antibody was pre-incubated in blocker peptide (2X the concentration of antibody) for 30 minutes and the sections incubated as above. In the second control, the primary antibody was not presented to the sections. In both instances there were no c-Fos labeled neurons.
The 15 ROI were as follows: central and basolateral nucleus of the amygdala (CeA; BLA, respectively), lateral hypothalamus (LH), paraventricular nucleus of hypothalamus (PVN), lateral septum (LS), bed nucleus of the stria terminalis (BNST), area 32 of anterior cingulate cortex (ACC), ventromedial orbitofrontal cortex (VMO), shell and core of the nucleus accumbens (nAcS; nAcC, respectively), lateral parabrachial nucleus (PBI), substantia nigra (SN), ventral tegmental area (VTA), locus coeruleus (LC), and the Edinger-Westphal nucleus (EW). Each ROI was completely surveyed bilaterally in all cases and evaluated blind to group membership. Brainstem structures were identified according to Paxinos and Watson (2007) and area 32 by Vogt et al. (Vogt, Vogt & Farber, 2004). The matched thionin and c-Fos reacted sections were used to identify ROIs.
Digital photographs of c-Fos preparations were taken at 100X in two sections with the highest density of labeled neurons in each ROI with an Optronics MacroFire digital camera (Optronics, Goleta, CA). Each ROI was selected from the photograph in Photoshop CS2 using the same sampling area in all cases for each ROI. The photograph was then magnified to 200X with guide lines for neuron counting; all labeled neurons were counted, and changes in magnification helped indentify labeled neurons without changing the sampling area. This approach was used in order to avoid random selection of zero values that would add variability to the data. Grey levels were corrected to enhance signal-to-noise over background staining. The c-Fos labeled neuronal nuclei were not counted if there were <5 neurons in the ROI and staining was a similar intensity in all neurons; i.e., we required some heavily and moderately labeled neurons in a group before they were considered c-Fos positive (see Rosene, Lister, Schwagerl, Tonkiss, McCormick, & Galler, 2004). Direct counting of c-Fos-labeled neuronal somata is routine and has been employed for studies including brainstem structures and cingulate cortex (O’Mahony, Sweeney, Daly, Dinan, & Cryan, 2010; Thiel et al., 2010). In addition, the presence of two patterns of labeling in adolescent and adult animals regardless of neuron densities (e.g., low counts in nAc versus high counts in ACC and VMO) validates this as a consistent approach to neuron counting when all neurons can be counted without stereological estimates. Finally, brains from four animals at each age taken directly from the home cage were prepared in the same way, with few to no labeled neurons evident in these home cage controls, as expected.
Statistical Analyses
Due to the extremely low levels of c-Fos immunoreactivity in the 15 ROI of the home cage controls, data from these animals were not included in the analyses. Among the experimental animals, two adult animals from the Saline/Social group had evidence of poor perfusion, as indicated by extensive red blood cell and perivascular labeling and no labeled neurons in the brain. In addition, two adults in the Ethanol/Alone group were completely blank in the ROI but had rare labeled neurons in other areas. These 4 experimental animals were excluded from the data analyses.
Number of c-Fos labeled neurons from each ROI was analyzed separately by a 2 Age (adolescent, adult) × 2 Context (social, alone) × 2 Ethanol Dose (0 or 0.5 g/kg) analysis of variance (ANOVA), with Fisher’s LSD test used to examine the locus of significant interactions arising in these analyses. Regional patterns of c-Fos activation were also examined via Pearson’s correlation analyses and significance determined using t-tests.
The data were also subjected to factor analysis. A principal components analysis was conducted, with a varimax rotation used on the factor matrix. Only components with an Eigenvalue of 1 or greater were retained for final rotation (Fabrigar, Wegener, MacCallum, & Strahan, 1999). A Kaiser-Meyer-Olkin test of sampling adequacy and Bartlett’s test of sphericity were used to assess the appropriateness of the data set for these analyses. Both measures (Sampling Adequacy = .865, and the Bartlett’s Test of Sphericity Chi Square = 738.21, p < .0001) demonstrated that the data were adequate for use in the analysis.
RESULTS
Ethanol Effects
The low dose of ethanol used in this study had little impact on c-Fos expression. A significant Age x Ethanol Dose interaction emerged in the LC data; F(1, 52) = 4.567, p < .05, with ethanol challenged adults (5.5 ± 1.5 c-Fos labeled cells) showing attenuated expression of c-Fos relative to their saline-exposed counterparts (15.2 ± 3.2). c-Fos expression in the LC did not differ as a function of ethanol dose in adolescent animals (6.6 ± 2.2 for ethanol-challenged, 5.9 ± 1.7 for saline controls). In no other ROI was c-Fos expression significantly affected by ethanol challenge.
Age and Context Effects
Across the 15 ROI, two markedly different patterns of c-Fos immunoreactivity emerged, as defined by interactions of age and social context in the analyses for most regions. Means and standard errors of the data for each ROI and for each experimental group within the 2 Age (early adolescent, adult) × 2 Test Context (social, alone) × 2 Ethanol Dose factorial design are presented in Table 1, along with F and significance values for the Age, Context and Age X Context effects for each region.
Pattern I: Adolescent-specific enhancement of c-Fos expression by social context
c-Fos expression was significantly greater among early adolescents when tested in a social context than when alone in a number of brain regions. This effect was evident in CeA, BLA, BNST, and LH (see Fig. 1, note differences in y-axis scaling across ROI in this Figure and in Figure 2). Although a similar trend was seen in EW, only a main effect of Context emerged in this nucleus, with greater c-Fos expression in animals tested in a social than non-social context regardless of age (an effect seemingly driven largely by adolescent animals). In marked contrast to the socially-enhanced c-Fos expression in adolescents, adults showed no enhancement of c-Fos expression by a social context in these regions (or any other ROI, for that matter), with greater c-Fos expression among socially-tested adolescents than adults evident not only in the CeA, BLA, BNST and LH, but in the LS as well. Similar tendencies for greater c-Fos expression in adolescents tested under social circumstances relative to their counterparts tested alone were evident for the VTA and PVN, although these trends did not reach statistical significance (see Figure 1).
Figure 1.
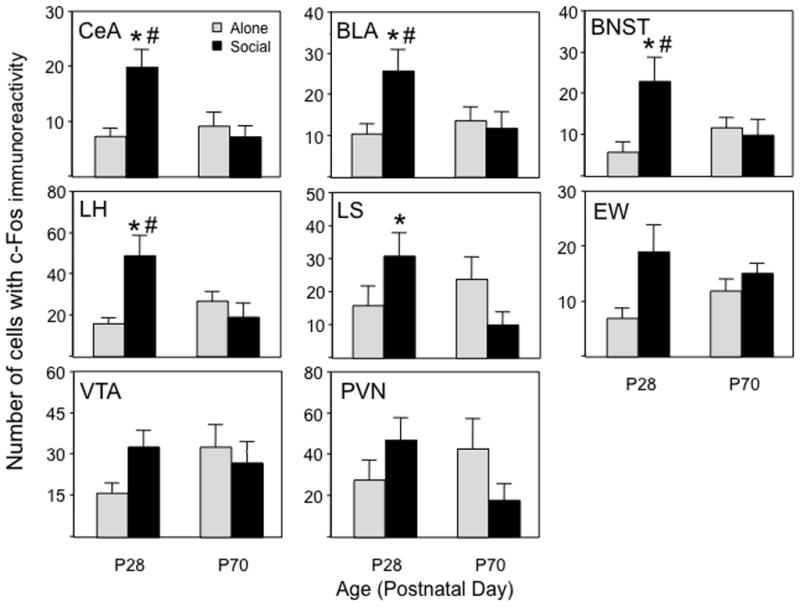
Pattern I c-Fos expression in the central amygdala (CeA), basolateral amygdala (BLA), bed nucleus of the stria terminalis (BNST), lateral hypothalamus (LH), lateral septum (LS), ventral tegmental area (VTA), Edinger-Westphal nucleus (EW), and the paraventricular nucleus of hypothalamus (PVN) of adolescents and adults tested either alone or with a social partner. An asterisk (*) reflects significant age difference within the same test context, # - depicts significant difference between the two contexts within same age.
Figure 2.
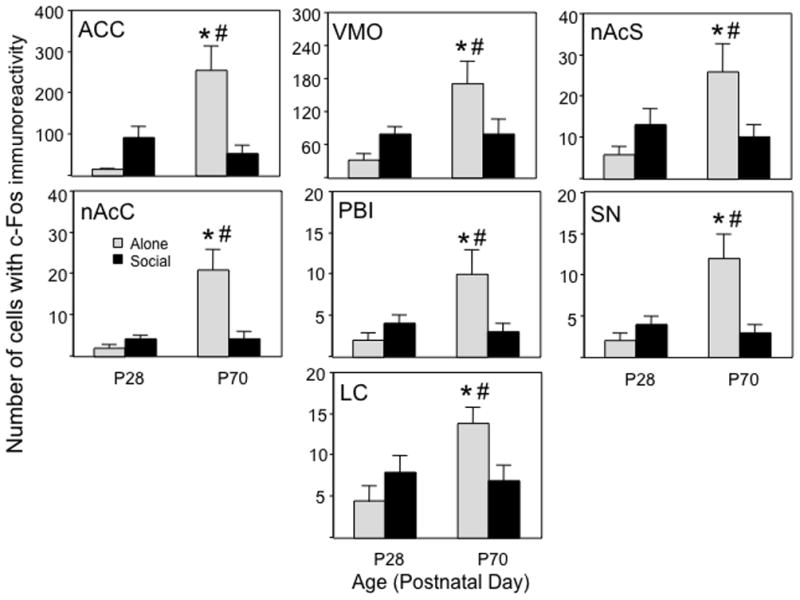
Pattern II c-Fos expression in the anterior cingulate cortex (ACC), ventromedial orbitofrontal cortex (VMO), nucleus accumbens shell (nAcS0), nucleus accumbens core (nAcC), lateral parabrachial nucleus (PBI), substantia nigra (SN), and locus coeruleus (LC) of adolescents and adults tested either alone or with a social partner. An asterisk (*) reflects significant age difference within the same test context, # - depicts significant difference between the two contexts within same age.
Pattern II: Enhancement of c-Fos expression in adult animals tested alone
In a number of regions, c-Fos expression was notably greater among alone-tested adults than adults placed in a social context. These regions included the ACC, VMO, shell and core of the nAc, SN, PBI, and LC (see Figure 2). It should be noted that the magnitude of expression in the latter 5 regions was less than in other areas and may have approached a floor effect for some experimental conditions; nevertheless, these regions were included within this functional grouping, given that the pattern of activation in these regions bore strong similarities to others within this group. In all these ROI, the elevation in c-Fos expression was significantly greater in alone tested adults than in their adolescent counterparts.
Factor Analysis
To confirm the grouping of ROI in the two patterns of c-Fos activation, regional c-Fos patterns were subjected to factor analysis. Only two factors, collectively accounting for over 68% of the variance, had eigenvalues higher than 1 (8.013 for factor 1 and 2.316 for factor 2). As presented in Table 2, c-Fos expression in the CeA, BLA, BNST, LH, LS, VTA, EW, and PVN loaded strongly (all loading scores >.5) on Factor 1, which accounted for 37.0% of variance. The c-Fos labeling in ACC, VMO, nAcS, nAcC, PBI, SN, and LC loaded strongly on Factor 2, which accounted for 31.9 % of variance. These results confirm that the two age- and context-influenced expression patterns reflect functionally distinct regional patterns of activation.
Table 2.
Result of Factor Analysis.
| Brain Region | Factor 1 | Factor 2 |
|---|---|---|
| CeA | .813 | .121 |
| BLA | .818 | .239 |
| BNST | .868 | .083 |
| LH | .756 | .183 |
| LS | .722 | .384 |
| VTA | .722 | .445 |
| EW | .820 | .193 |
| PVN | .716 | .267 |
| ACC | .148 | .930 |
| VMO | .367 | .836 |
| nAcS | .409 | .750 |
| nAcC | .146 | .873 |
| PBI | .017 | .764 |
| SN | .386 | .691 |
| LC | .414 | .516 |
| % variance | 37.0 | 31.9 |
Loadings higher than .5 are presented in bold.
Correlation Analyses
Correlation coefficients provide some orientation as to functional connections between ROI (e.g., see Schiltz, Bremer, Landry & Kelley, 2007) that may be relevant to interpreting their interactions. To the extent that the two age- and context-influenced c-Fos expression patterns reflect functionally distinct regional patterns of c-Fos activation, we expected that correlations between ROI within each pattern should generally be greater than correlations obtained from comparing ROI across patterns. This expectation was confirmed as shown in the summary in Table 3; cFos-labeled neuron densities in all ROI for each pattern were highly correlated confirming the presence of two tightly connected functional substrates in adolescent and adult animals.
Table 3.
Significant (p < .05) correlations across and between Pattern I and Pattern II brain regions
| Correlations within Pattern I | ||||||||
|---|---|---|---|---|---|---|---|---|
| CeA | BLA | BNST | LH | LS | VTA | EW | PVN | |
| CeA | .77 | .65 | .55 | .62 | .56 | .67 | .49 | |
| BLA | .61 | .59 | .66 | .66 | .65 | .59 | ||
| BNST | .73 | .63 | .64 | .72 | .60 | |||
| LH | .46 | .64 | .59 | .54 | ||||
| LS | .62 | .67 | .60 | |||||
| VTA | .66 | .68 | ||||||
| EW | .50 | |||||||
| Correlations within Pattern II | ||||||||
| ACC | VMO | nAcS | nAcC | PBI | SN | LC | ||
| ACC | .88 | .77 | .80 | .66 | .68 | .40 | ||
| VMO | .77 | .75 | .53 | .64 | .50 | |||
| nAcS | .75 | .47 | .44 | .49 | ||||
| nAcC | .55 | .61 | .51 | |||||
| PBI | .55 | .43 | ||||||
| SN | .46 | |||||||
| Correlations Between Pattern I and Pattern II | ||||||||
| CeA | BLA | BNST | LH | LS | VTA | EW | PVN | |
| ACC | .36 | .31 | .46 | .52 | .31 | .31 | ||
| VMO | .32 | .52 | .36 | .42 | .58 | .71 | .46 | .52 |
| nAcS | .40 | .55 | .41 | .44 | .55 | .56 | .49 | .52 |
| nAcC | .27 | .36 | .44 | .44 | .32 | |||
| PBI | .29 | .38 | ||||||
| SN | .37 | .45 | .41 | .54 | .45 | .55 | .47 | .40 |
| LC | .44 | .45 | .32 | .59 | .43 | .40 | .53 | |
Correlations with r ≥ .5 are presented in bold. Non-significant correlations are not presented.
Correlations of ROI between the two patterns are shown in Table 3 (bottom). Only 13 of 56 (23%) of the correlations had r values ≥ 0.5, reflecting strong positive correlations (see Cohen, 1988), with 12 correlations of 56 (21%) being non-significant. In contrast, 26 of 28 (93%) correlations conducted across pattern I ROI (Table 3, top), and 15 of 21 (71%) correlations determined between pattern II ROI (Table 3, middle) had r values of this magnitude or greater, with all correlations being significant. In this regard, the VTA stands out as particularly important to any interactions between the networks observed in adolescents and adults.
Histological documentation
The two patterns of c-Fos expression are shown for individual cases in Figure 3. The cases were selected to represent group responses; i.e., cases with the lowest and highest densities of cFos-labeled neurons were not selected. The amygdala and ACC (area 32) were selected for documentation starting with thionin-stained sections in Figure 3A and 3D (left panel) with nuclei and layers noted, respectively. The CeA and BLA are shown in the left panels of 3B and 3C for an adolescent animal in the social context with high levels of expression, while ACC in the same case (Fig. 3D, middle panel) was moderate and dispersed across all layers. In contrast, as shown in the right panels of Figs 3B–D, both amygdalar nuclei had limited expression in an adult that was tested alone, while that in A32 of the ACC was high and tended to be focused in layers III and IV. The laminar patterns of cortical expression were quite variable, however, and a separate analysis would be needed to determine group differences by layer based on a priori hypotheses.
Figure 3.

Immunohistochemistry of c-Fos in an adolescent during the social condition and an adult alone condition. A. The CeA and BLA are shown in a thionin-stained section adjacent to the c-Fos-labeled sections. B. & C. The adolescent animal had high expression in both nuclei, while that in the adult was low. D. A thionin-stained section shows area 32 with each layer noted and lines were struck at the layers II/III and IV/Va borders in each section. The c-Fos labeling was particularly high in layers III and IV of the adult case, while that for the adolescent was more dispersed and somewhat less dense. All calibration bars are for 500 μm.
DISCUSSION
Two distinct patterns of brain activation in response to the presence or absence of social stimuli emerged that differed dramatically with age. The high correlation of ROI within each pattern confirms they are tightly linked functional networks. In contrast, c-Fos expression was unaffected by the 0.5 g/kg ethanol challenge regardless of age or social context in 14 of the 15 ROI tested, with the exception being the LC.
The decrease in c-Fos immunoreactivity in the LC of adult (but not adolescent) animals following ethanol administration in the present study contrasts with other work reporting ethanol-induced increases in c-Fos expression in a number of ROI (Chang et al., 1995; Faria et al., 2008; Hitzemann & Hitzemann, 1997). These discrepancies are likely related at least in part to dose differences. Ethanol-related increases in c-Fos expression are dose-dependent (e.g., Canales, 2004; Herring, Mayfield, Camp & Alcantara, 2004) and are generally found at doses higher than used here (1.5 – 4.0 g/kg; Chang et al., 1995; Faria et al., 2008; Hitzemann & Hitzemann, 1997). The dose of 0.5 g/kg ethanol in the present study (chosen because of its efficacy in inducing short-term stimulation of social behavior selectively in adolescent rats – e.g., Varlinskaya & Spear, 2002, 2006), has been reported to have little impact on c-Fos expression (Ryabinin et al., 1997), with even some trends for non-significant decreases in number of cFos-immunoreactive cells in some ROI (see Fig. 3 in Herring et al., 2004). The low dose suppression of neuronal activation in the LC observed in the present study in adults may reflect anxiolytic properties of ethanol, since the LC is among the brain regions implicated in anxiety-related behaviors (e.g., Tanaka et al., 2000). Indeed, in prior work we found this dose to be anxiolytic in adult but not adolescent animals (Varlinskaya & Spear, 2002).
It is puzzling that 0.5 g/kg ethanol, a dose well documented to produce notable social facilitation in adolescent rats, but not under normal circumstances in adults (e.g., Varlinskaya and Spear, 2002, 2006; Willey et al., 2009), was ineffective in elevating c-Fos expression – even in regions that demonstrated substantial induction of c-Fos in adolescents tested with a peer relative to those tested alone. Relative time courses for effects may be a contributing factor. In studies of ethanol-induced social facilitation, after a 30-minute injection-test interval spent alone in separate holding cages, animals are typically allowed to interact with their test partner for 10 minutes in the social interaction test chamber; in the present study, in contrast, after the same 30-minute injection-test interval, animals in the social context condition were placed together in the test chamber with their social partners for 60 minutes prior to anesthetizing the animals for collection of their brains. At this time (90 minutes post-administration), both adolescents and adults would have cleared the 0.5 g/kg challenge dose from their systems (Truxell, Varlinskaya & Spear, 2011) and animals in all conditions were resting quietly. An alternative explanation of the lack of ethanol-induced changes in c-Fos expression during adolescence is that adolescent-typical ethanol-related social facilitation may be due to decreases in inhibitory influences rather than activation of the neural circuitry of social behavior in general and play fighting (an adolescent-typical form of social interactions) in particular. If it was the case, it is nor surprising that low dose ethanol, producing social facilitation via suppression of brain regions that normally control behavioral manifestations of play, did not increase c-Fos immunoreactivity in adolescent brain, since c-Fos expression increases as a result of neuronal activation and is used as a marker of neuronal activation rather than synaptic plasticity (Vilpoux et al., 2009).
Another possible contributing factor to the lack of ethanol-induced changes in c-Fos expression in socially tested adolescents may be the already marked increases in c-Fos expression induced in the CeA, BLA, BNST, LH and LS (Pattern I ROI) induced by the social context among the young adolescents. Among adults, however, none of the 15 ROI showed significant increases in c-Fos expression induced by the social context. These pronounced age differences in c-Fos expression in the social context, along with the high levels of peer-directed social activity demonstrated by these young animals (Varlinskaya & Spear, 2008), support the suggestion that ROI in Pattern I of c-Fos expression may be implicated in adolescent-typical forms of social interactions such as play fighting (Panksepp, Siviy & Normansell, 1984; Vanderschuren et al., 1997; Varlinskaya & Spear, 2008). Neural substrates involved in regulation of adolescent-typical social behaviors have been rarely investigated (see Siviy & Panksepp, 2011 for references and review), although there is some evidence for an amygdalar involvement in play fighting. In rats, relatively large lesions of the amygdala with ibotenic acid on P21 reduce play fighting during adolescence, while leaving other social behaviors intact (Daenen, Wolterink, Gerrits, & Van Ree, 2002). Lesion studies have also implicated the parafascicular nucleus of the thalamus in play fighting in the rat, since lesions of this nucleus resulted in a robust and long-lasting impairment of this adolescent-characteristic form of social interactions (Siviy & Panksepp, 1985).
Given the ROI involved in Pattern I and their high correlation coefficients, this pattern likely reflects a functional autonomic network in adolescent animals that is activated during social interactions. This adolescent-active network may focus on the CeA as a primary autonomic output structure activated by social interactions that is driven to a large extent by inputs from other amygdalar nuclei including the BLA. Network interactions may depend on predominantly feed-forward anatomical projections into and through the amygdala to the BNST, LS, and LH (see Aggleton & Suanders, 2001, for review). One surprise from this point of view is that the LC was not part of the adolescent network; particularly since it coordinates fight-or-flight throughout the limbic system (Vogt, Vogt, & Aston-Jones, 2009). These findings provide further evidence that adolescent play fighting is a separate behavioral category, but not a precursor for adult aggressive behavior (see Vanderschuren et al., 1997 for references and review) and suggest that this coordinating function may not be developed in adolescent brains, contributing to their propensity for play behaviors versus adults.
The expression of c-Fos in Pattern II included the ACC, VMO, shell and core of the nAc, SN, PBI, and LC. In these ROI, substantially more Fos-immunoreactive cells were detected in alone-tested adults than adolescents, with this c-Fos expression diminished when adults were placed with a social partner. This labeling pattern is predominated by a number of structures that are generally viewed to be part of a reward network (Koob & LeMoal, 2005) and the high correlations between c-Fos expressing neurons in these ROI confirm that this is a tightly linked network that is not strongly expressed in the presence of a social stimulus in adults. It is possible that since the LC is engaged during stress responses (e.g., Abercrombie & Jacobs, 1987; Featherby & Lawrence, 2004), its inclusion in Pattern II reflects a stress component of being alone in adult animals. Also, although the LC has widespread projections to the telencephalon only excluding the striatum (Foote, 1997), it is noteworthy that it only had significant correlations with the LS and PVN in Pattern I ROI. This further supports the functional segregation of these two systems in adolescents and adults.
The highest levels of c-Fos expression in the Pattern II network were in the ACC – a region known to be involved in processing information relating to novel stimuli (Montag-Sallaz, Welzl, Kuhl, Montag & Schachner, 1999). It has been shown that placing adult rats into novel environments produced dramatic IEG expression in a number of cortical regions, including the ACC (Wirtshafter, 2005). Pronounced c-Fos expression induced by novelty has also been reported in the prefrontal cortex and nAcC and nAcS in mice (Rinaldi, Romeo, Agustin-Pavon, Oliverio & Mele, 2010). Although animals in the present study were pre-exposed individually to the testing apparatus for 30 minutes on the day prior to tissue collection, this situation might still be relatively novel and, like other novel situations, sufficient to activate the hypothalamo-pituitary-adrenal axis and stress-sensitive brain regions (Ulrich-Lai & Herman, 2009), at least in adults. Indeed, novelty joins drugs of abuse in activating both hormonal and neural stress-sensitive systems as well as regions involved in associating rewards (Bardo & Dwoskin, 2004). If indeed placement alone in the testing situation was stressful for adults, it is not surprising that the pronounced c-Fos activation in these ROI was not evident in adults tested under social circumstances. Behavioral and hormonal responses in a novel environment have been shown to be blunted by a presence of a conspecific (see Hennessy, Kaiser, & Sachser, 2009 for references and review), and the presence of a social partner has likewise been reported to attenuate c-Fos expression in stressed rats (Kiyokawa, Kikusui, Takeuchi, & Mori, 2004; Kiyokawa, Takeuchi, & Mori, 2007). Although adolescents demonstrate a blunted corticosterone response when exposed to novel environments under social circumstances as well (Terranova et al., 1999), in contrast to adults, they may not perceive novel environments as stressful and/or anxiogenic, given that adolescents seem to find novelty a more positive affective experience than adults. For instance, work using conditioned place preferences (CPP) have found adolescent, but not adult male rats to show reliable novelty-induced CPP when animals were group-housed as in the present study (Douglas, Varlinskaya, & Spear, 2003).
Finally, although activation patterns in the autonomic network Pattern I did not generally correlate with nodes of the reward network Pattern II, the VTA c-Fos expression in Pattern I was significantly correlated with 5 of the 8 ROI in Pattern II (Table 3, bottom). No other ROI had this level of cross correlation between the two patterns. The intersection of the VTA with both of these networks perhaps should not be surprising, given widespread projections from dopamine neurons in the VTA to regions not only in Pattern I (such as the BLA, CeA, and LS), but also to Pattern II regions such as the nAcC, nAcS, ACC and VMO (see Oades & Halliday, 1987). Connectivity between these regions and the VTA is largely reciprocal, with most of these DA terminal projection regions projecting back to the VTA as well. Thus, the VTA may have a role in “mediating dialogue” among mesocorticolimbic circuits (see Oades & Halliday, 1987, for discussion and review) that involve nuclei associated with both of these activation patterns.
Conclusions
This study documents dramatic age differences in regional activation patterns to the presence or absence of a social stimulus while in a relatively novel context. Using c-Fos expression to index regional activation, the 15 ROI fell into two general categories – autonomic and reward-relevant, with activation patterns of each differentially influenced by social context between adolescent and adult animals. The presence of a social partner induced marked activation of an autonomic network involving CeA, BLA, BNST, LH and LS among the early adolescent (but not adult) rats, whereas in adults (but not adolescents) social context conversely suppressed activation in a network including reward-relevant regions such as the nAc, ACC, and VMO. This strong double dissociation provides clear evidence for a dramatic change in the neuroanatomical significance of social stimuli between early adolescence and adulthood in networks modulating emotional/affective/autonomic and reward functioning. Yet, our understanding of how such dramatic age-specific neural activation patterns contribute to the often heightened importance of social peers for the young adolescent (e.g., Steinberg & Morris, 2001; Brown, 2004; Douglas et al, 2004) and the heightened facilitation of social behavior by ethanol seen at this age is still rudimentary, at best. Much work remains to characterize the “social brain” of the adolescent and determine how the powerful influence of social stimuli and their interaction with ethanol change across puberty, adolescence and the transition into adulthood.
Acknowledgments
This research was supported by NIAAA grants R01 AA016887 and P50 AA017823 to Linda Spear and R01 AA012453 to Elena Varlinskaya. The authors would like to thank Leslie Vogt for her histological work and Mark Celio for his invaluable assistance in statistical analyses.
References
- Abercrombie ED, Jacobs BL. Single-unit response of noradrenergic neurons in the locus coeruleus of freely moving cats. II. Adaptation to chronically presented stressful stimuli. Journal of Neuroscience. 1987;7(9):2844–2848. doi: 10.1523/JNEUROSCI.07-09-02844.1987. [DOI] [PMC free article] [PubMed] [Google Scholar]
- Aggleton JP, Saunders RC. The amygdala - what’s happened in the last decade? In: Aggleton JP, editor. The Amygdala: A Functional Analysis. New York: Oxford University Press; 2001. pp. 1–30. [Google Scholar]
- Bardo MT, Dwoskin LP. Biological connection between novelty- and drug-seeking motivational systems. Motivational Factors in the Etiology of Drug Abuse. 2004;50:127–158. [PubMed] [Google Scholar]
- Beck KH, Treiman KA. The relationship of social context of drinking, perceived social norms, and parental influence to various drinking patterns of adolescents. Addictive Behaviors. 1996;21(5):633–644. doi: 10.1016/0306-4603(95)00087-9. [DOI] [PubMed] [Google Scholar]
- Blakemore SJ. The social brain in adolescence. Nature Reviews Neuroscience. 2008;9(4):267–277. doi: 10.1038/nrn2353. [DOI] [PubMed] [Google Scholar]
- Brown BB. Adolescents’ relationships with peers. In: Lerner RM, Steinberg LD, editors. Handbook of Adolescent Psychology. Hoboken: Wiley; 2004. pp. 363–394. [Google Scholar]
- Brunell SC, Spear LP. Effect of stress on the voluntary intake of a sweetened ethanol solution in pair-housed adolescent and adult rats. Alcoholism, Clinical and Experimental Research. 2005;29(9):1641–1653. doi: 10.1097/01.alc.0000179382.64752.13. [DOI] [PubMed] [Google Scholar]
- Burnett S, Sebastian C, Cohen Kadosh K, Blakemore SJ. The social brain in adolescence: evidence from functional magnetic resonance imaging and behavioural studies. Neuroscience and Biobehavioral Reviews. 2011;35(8):1654–1664. doi: 10.1016/j.neubiorev.2010.10.011. [DOI] [PMC free article] [PubMed] [Google Scholar]
- Canales JJ. Catalase-independent early-gene expression in rat brain following acute ethanol exposure. Brain Research. 2004;1016(1):96–101. doi: 10.1016/j.brainres.2004.04.078. [DOI] [PubMed] [Google Scholar]
- Chang SL, Patel NA, Romero AA. Activation and desensitization of Fos immunoreactivity in the rat brain following ethanol administration. Brain Research. 1995;679(1):89–98. doi: 10.1016/0006-8993(95)00210-h. [DOI] [PubMed] [Google Scholar]
- Chein J, Albert D, O’Brien L, Uckert K, Steinberg L. Peers increase adolescent risk taking by enhancing activity in the brain’s reward circuitry. Developmental Science. 2011;14(2):F1–F10. doi: 10.1111/j.1467-7687.2010.01035.x. [DOI] [PMC free article] [PubMed] [Google Scholar]
- Criado JR, Morales M. Acute ethanol induction of c-Fos immunoreactivity in pre-pro-enkephalin expressing neurons of the central nucleus of the amygdala. Brain Research. 2000;861(1):173–177. doi: 10.1016/s0006-8993(99)02468-3. [DOI] [PubMed] [Google Scholar]
- Cohen J. Statistical power analysis for the behavioral sciences. 2. New Jersey: Lawrence Erlbaum; 1988. [Google Scholar]
- Daenen EW, Wolterink G, Gerrits MA, Van Ree JM. The effects of neonatal lesions in the amygdala or ventral hippocampus on social behaviour later in life. Behavioural Brain Research. 2002;136(2):571–582. doi: 10.1016/s0166-4328(02)00223-1. [DOI] [PubMed] [Google Scholar]
- Douglas LA, Varlinskaya EI, Spear LP. Novel-object place conditioning in adolescent and adult male and female rats: effects of social isolation. Physiology & Behavior. 2003;80(2–3):317–325. doi: 10.1016/j.physbeh.2003.08.003. [DOI] [PubMed] [Google Scholar]
- Douglas LA, Varlinskaya EI, Spear LP. Rewarding properties of social interactions in adolescent and adult male and female rats: impact of social versus isolate housing of subjects and partners. Developmental Psychobiology. 2004;45(3):153–162. doi: 10.1002/dev.20025. [DOI] [PubMed] [Google Scholar]
- Fabrigar LR, Wegener DT, MacCallum RC, Strahan EJ. Evaluating the use of exploratory facor analysis in psychological research. Psychological methods. 1999;3:272–299. [Google Scholar]
- Faria RR, Lima Rueda AV, Sayuri C, Soares SL, Malta MB, Carrara-Nascimento PF, et al. Environmental modulation of ethanol-induced locomotor activity: Correlation with neuronal activity in distinct brain regions of adolescent and adult Swiss mice. Brain Research. 2008;1239:127–140. doi: 10.1016/j.brainres.2008.08.056. [DOI] [PubMed] [Google Scholar]
- Featherby T, Lawrence AJ. Chronic cold stress regulates ascending noradrenergic pathways. Neuroscience. 2004;127(4):949–960. doi: 10.1016/j.neuroscience.2004.06.019. [DOI] [PubMed] [Google Scholar]
- Fleming AS, Suh EJ, Korsmit M, Rusak B. Activation of Fos-like immunoreactivity in the medial preoptic area and limbic structures by maternal and social interactions in rats. Behavioral Neuroscience. 1994;108(4):724–734. doi: 10.1037//0735-7044.108.4.724. [DOI] [PubMed] [Google Scholar]
- Foote SL. The primate locus coeruleus: the chemical neuroanatomy of the nucleus, its efferent projections, and its target receptors. Handbook of Chemical Neuroanatomy; The Primate Nervous System, Part I. 1997;13:187–215. [Google Scholar]
- Gauvin DV, Briscoe RJ, Goulden KL, Holloway FA. Aversive attributes of ethanol can be attenuated by dyadic social-interaction in the rat. Alcohol. 1994;11(3):247–251. doi: 10.1016/0741-8329(94)90038-8. [DOI] [PubMed] [Google Scholar]
- Gordon NS, Kollack-Walker S, Akil H, Panksepp J. Expression of c-fos gene activation during rough and tumble play in juvenile rats. Brain Research Bulletin. 2002;57(5):651–659. doi: 10.1016/s0361-9230(01)00762-6. [DOI] [PubMed] [Google Scholar]
- Hartup WW, Stevens N. Friendships and adaptation in the life course. Psychological Bulletin. 1997;121:355–70. [Google Scholar]
- Hennessy MB, Kaiser S, Sachser N. Social buffering of the stress response: diversity, mechanisms, and functions. Frontiers in Neuroendocrinology. 2009;30(4):470–482. doi: 10.1016/j.yfrne.2009.06.001. [DOI] [PubMed] [Google Scholar]
- Herring BE, Mayfield RD, Camp MC, Alcantara AA. Ethanol-induced Fos immunoreactivity in the extended amygdala and hypothalamus of the rat brain: focus on cholinergic interneurons of the nucleus accumbens. Alcoholism, Clinical and Experimental Research. 2004;28(4):588–597. doi: 10.1097/01.alc.0000122765.58324.6d. [DOI] [PubMed] [Google Scholar]
- Hitzemann B, Hitzemann R. Genetics ethanol and the Fos response: a comparison of the C57BL/6J and DBA/2J inbred mouse strains. Alcoholism, Clinical and Experimental Research. 1997;21(8):1497–1507. [PubMed] [Google Scholar]
- Holson RR, Pearce B. Principles and pitfalls in the analysis of prenatal treatment effects in multiparous species. Neurotoxicology and Teratology. 1992;14(3):221–228. doi: 10.1016/0892-0362(92)90020-b. [DOI] [PubMed] [Google Scholar]
- Hunt PS, Holloway JL, Scordalakes EM. Social interaction with an intoxicated sibling can result in increased intake of ethanol by periadolescent rats. Developmental Psychobiology. 2001;38(2):101–109. doi: 10.1002/1098-2302(200103)38:2<101::aid-dev1002>3.0.co;2-4. [DOI] [PubMed] [Google Scholar]
- Johnston LD, O’Malley PM, Bachman JG, Schulenberg JE. NIH Publication No 10–7583. Bethesda, MD: National Institute on Drug Abuse; 2010. Monitoring the Future national results on adolescent drug use: Overview of key findings, 2009. [Google Scholar]
- Kalinichev M, Rosenblatt JS, Nakabeppu Y, Morrell JI. Induction of c-fos-like and fosB-like immunoreactivity reveals forebrain neuronal populations involved differentially in pup-mediated maternal behavior in juvenile and adult rats. The Journal of Comparative Neurology. 2000;416(1):45–78. doi: 10.1002/(sici)1096-9861(20000103)416:1<45::aid-cne5>3.0.co;2-k. [DOI] [PubMed] [Google Scholar]
- Kellogg CK, Awatramani GB, Piekut DT. Adolescent development alters stressor-induced Fos immunoreactivity in rat brain. Neuroscience. 1998;83(3):681–689. doi: 10.1016/s0306-4522(97)00408-9. [DOI] [PubMed] [Google Scholar]
- Kiyokawa Y, Kikusui T, Takeuchi Y, Mori Y. Partner’s stress status influences social buffering effects in rats. Behavioral Neuroscience. 2004;118(4):798–804. doi: 10.1037/0735-7044.118.4.798. [DOI] [PubMed] [Google Scholar]
- Kiyokawa Y, Takeuchi Y, Mori Y. Two types of social buffering differentially mitigate conditioned fear responses. The European Journal of Neuroscience. 2007;26(12):3606–3613. doi: 10.1111/j.1460-9568.2007.05969.x. [DOI] [PubMed] [Google Scholar]
- Knapp DJ, Braun CJ, Duncan GE, Qian Y, Fernandes A, Crews FT, et al. Regional specificity of ethanol and NMDA action in brain revealed with FOS-like immunohistochemistry and differential routes of drug administration. Alcoholism, Clinical and Experimental Research. 2001;25(11):1662–1672. [PubMed] [Google Scholar]
- Koob JF, Le Moal M. Neurobiology of addiction. London: Elsevier; 2005. [Google Scholar]
- Lawrence CR, Bonner HC, Newsom RJ, Kelly SJ. Effects of alcohol exposure during development on play behavior and c-Fos expression in response to play behavior. Behavioural Brain Research. 2008;188(1):209–218. doi: 10.1016/j.bbr.2007.10.028. [DOI] [PMC free article] [PubMed] [Google Scholar]
- McCormick CM, Ibrahim FN. Locomotor activity to nicotine and Fos immunoreactivity in the paraventricular nucleus of the hypothalamus in adolescent socially-stressed rats. Pharmacology Biochemistry and Behavior. 2007;86(1):92–102. doi: 10.1016/j.pbb.2006.12.012. [DOI] [PubMed] [Google Scholar]
- Montag-Sallaz M, Welzl H, Kuhl D, Montag D, Schachner M. Novelty-induced increased expression of immediate-early genes c-fos and arg 3.1 in the mouse brain. Journal of Neurobiology. 1999;38(2):234–246. [PubMed] [Google Scholar]
- O’Mahony CM, Sweeney FF, Daly E, Dinan TG, Cryan JF. Restraint stress-induced brain activation patterns in two strains of mice differing in their anxiety behaviour. Behavioural Brain Research. 2010;213(2):148–154. doi: 10.1016/j.bbr.2010.04.038. [DOI] [PubMed] [Google Scholar]
- Oades RD, Halliday GM. Ventral Tegmental (A10) System - Neurobiology .1. Anatomy and Connectivity. Brain Research Reviews. 1987;12(2):117–165. doi: 10.1016/0165-0173(87)90011-7. [DOI] [PubMed] [Google Scholar]
- Panksepp J, Siviy S, Normansell L. The psychobiology of play: theoretical and methodological perspectives. Neuroscience and Biobehavioral Reviews. 1984;8(4):465–492. doi: 10.1016/0149-7634(84)90005-8. [DOI] [PubMed] [Google Scholar]
- Paxinos G, Watson C. The Rat Brain. 6. Elsevier; Amsterdam: 2007. [Google Scholar]
- Read JP, Wood MD, Kahler CW, Maddock JE, Palfai TP. Examining the role of drinking motives in college student alcohol use and problems. Psychology of Addictive Behaviors: Journal of the Society of Psychologists in Addictive Behaviors. 2003;17(1):13–23. doi: 10.1037/0893-164x.17.1.13. [DOI] [PubMed] [Google Scholar]
- Rinaldi A, Romeo S, Agustin-Pavon C, Oliverio A, Mele A. Distinct patterns of Fos immunoreactivity in striatum and hippocampus induced by different kinds of novelty in mice. Neurobiology of Learning and Memory. 2010;94(3):373–381. doi: 10.1016/j.nlm.2010.08.004. [DOI] [PubMed] [Google Scholar]
- Rosene DL, Lister JP, Schwagerl AL, Tonkiss J, McCormick CM, Galler JR. Prenatal protein malnutrition in rats alters the c-Fos response of neurons in the anterior cingulate and medial prefrontal region to behavioral stress. Nutritional Neuroscience. 2004;7(5–6):281–289. doi: 10.1080/10284150400015573. [DOI] [PubMed] [Google Scholar]
- Ryabinin AE, Criado JR, Henriksen SJ, Bloom FE, Wilson MC. Differential sensitivity of c-Fos expression in hippocampus and other brain regions to moderate and low doses of alcohol. Molecular Psychiatry. 1997;2(1):32–43. doi: 10.1038/sj.mp.4000206. [DOI] [PubMed] [Google Scholar]
- Sager SM, Sharp FR, Curran T. Expression of c-fos protein in brain: Metabolic mapping at the cellular level. Science. 1988;240:1328–1331. doi: 10.1126/science.3131879. [DOI] [PubMed] [Google Scholar]
- Schiltz CA, Bremer QZ, Landry CF, Kelley AE. Food-associated cues alter forebrain functional connectivity as assessed with immediate early gene and proenkephalin expression. BMC Biology. 2007;5:16. doi: 10.1186/1741-7007-5-16. [DOI] [PMC free article] [PubMed] [Google Scholar]
- Siviy SM, Panksepp J. Dorsomedial diencephalic involvement in the juvenile play of rats. Behavioral Neuroscience. 1985;99(6):1103–1113. doi: 10.1037//0735-7044.99.6.1103. [DOI] [PubMed] [Google Scholar]
- Siviy SM, Panksepp J. In search of the neurobiological substrates for social playfulness in mammalian brains. Neuroscience and Biobehavioral Reviews. 2011;35(9):1821–1830. doi: 10.1016/j.neubiorev.2011.03.006. [DOI] [PubMed] [Google Scholar]
- Steinberg L, Morris AS. Adolescent development. Annual Review of Psychology. 2001;52:83–110. doi: 10.1146/annurev.psych.52.1.83. [DOI] [PubMed] [Google Scholar]
- Tanaka M, Yoshida M, Emoto H, Ishii H. Noradrenaline system in the hypothalamus, amygdala and locus coeruleus are involved in the provocation of anxiety: basic studies. European Journal of Pharmacology. 2000;405:397–406. doi: 10.1016/s0014-2999(00)00569-0. [DOI] [PubMed] [Google Scholar]
- Terranova ML, Girulli F, Laviola G. Behavioral and hormonal effects of partner familiarity in periadolescent rat pairs upon novelty exposure. Psychoneuroendocrinology. 1999;24:639–656. doi: 10.1016/s0306-4530(99)00019-0. [DOI] [PubMed] [Google Scholar]
- Thiel KJ, Pentkowski NS, Peartree NA, Painter MR, Neisewander JL. Environmental living conditions introduced during forced abstinence alter cocaine-seeking behavior and Fos protein expression. Neuroscience. 2010;171(4):1187–1196. doi: 10.1016/j.neuroscience.2010.10.001. [DOI] [PMC free article] [PubMed] [Google Scholar]
- Truxell EM, Varlinskaya EI, Spear LP. 2011 Neuroscience Meeting Planner. Washington, DC: Society for Neuroscience; 2011. Acute ethanol modifies the corticosterone response to restraint stress in adolescent but not adult Sprague-Dawley rats. Program # 685.17. Online. [Google Scholar]
- Udry JR. The National Longitudinal Survey of Adolescent Health (Add Health), Waves I & II, 1994–1996. Carolina Population Center, University of North Carolina; Chapel Hill, NC: 1998. [Google Scholar]
- Ulrich-Lai YM, Herman JP. Neural regulation of endocrine and autonomic stress responses. Nature Reviews Neuroscience. 2009;10(6):397–409. doi: 10.1038/nrn2647. [DOI] [PMC free article] [PubMed] [Google Scholar]
- Vanderschuren LJ, Niesink RJ, Van Ree JM. The neurobiology of social play behavior in rats. Neuroscience and Biobehavioral Reviews. 1997;21(3):309–326. doi: 10.1016/s0149-7634(96)00020-6. [DOI] [PubMed] [Google Scholar]
- Varlinskaya EI, Spear LP. Acute effects of ethanol on social behavior of adolescent and adult rats: role of familiarity of the test situation. Alcoholism, Clinical and Experimental Research. 2002;26(10):1502–1511. doi: 10.1097/01.ALC.0000034033.95701.E3. [DOI] [PubMed] [Google Scholar]
- Varlinskaya EI, Spear LP. Differences in the social consequences of ethanol emerge during the course of adolescence in rats: social facilitation, social inhibition, and anxiolysis. Developmental Psychobiology. 2006;48(2):146–161. doi: 10.1002/dev.20124. [DOI] [PubMed] [Google Scholar]
- Varlinskaya EI, Spear LP. Social interactions in adolescent and adult Sprague-Dawley rats: impact of social deprivation and test context familiarity. Behavioural Brain Research. 2008;188(2):398–405. doi: 10.1016/j.bbr.2007.11.024. [DOI] [PMC free article] [PubMed] [Google Scholar]
- Vetter CS, Doremus-Fitzwater TL, Spear LP. Time course of elevated ethanol intake in adolescent relative to adult rats under continuous, voluntary-access conditions. Alcoholism, Clinical and Experimental Research. 2007;31(7):1159–1168. doi: 10.1111/j.1530-0277.2007.00417.x. [DOI] [PMC free article] [PubMed] [Google Scholar]
- Vetter-O’Hagen C, Varlinskaya E, Spear L. Sex differences in ethanol intake and sensitivity to aversive effects during adolescence and adulthood. Alcohol and Alcoholism. 2009;44(6):547–554. doi: 10.1093/alcalc/agp048. [DOI] [PMC free article] [PubMed] [Google Scholar]
- Vilpoux C, Warnault V, Pierrefiche O, Daoust M, Naassila M. Ethanol-sensitive brain regions in rat and mouse: a cartographic review, using immediate early gene expression. Alcoholism, Clinical and Experimental Research. 2009;33(6):945–969. doi: 10.1111/j.1530-0277.2009.00916.x. [DOI] [PubMed] [Google Scholar]
- Vogt BA, Vogt LJ, Aston-Jones G. Noradrenergic-Cingulate circuit interactions: Sites of pain and stress vulnerability. In: Vogt BA, editor. Cingulate Neurobiology and Disease. Oxford University Press; London: 2009. pp. 467–497. [Google Scholar]
- Vogt BA, Vogt LJ, Farber NB. Cingulate cortex and models of disease. In: Paxinos G, editor. The Rat Nervous System. 3. Burlington: Academic Press; 2004. pp. 705–727. [Google Scholar]
- Weinberg MS, Grissom N, Paul E, Bhatnagar S, Maier SF, Spencer RL. Inescapable but not escapable stress leads to increased struggling behavior and basolateral amygdala c-fos gene expression in response to subsequent novel stress challenge. Neuroscience. 2010;170(1):138–148. doi: 10.1016/j.neuroscience.2010.06.052. [DOI] [PMC free article] [PubMed] [Google Scholar]
- Willey AR, Varlinskaya EI, Spear LP. Social interactions and 50 kHz ultrasonic vocalizations in adolescent and adult rats. Behavioural Brain Research. 2009;202(1):122–129. doi: 10.1016/j.bbr.2009.03.025. [DOI] [PMC free article] [PubMed] [Google Scholar]
- Wirtshafter D. Cholinergic involvement in the cortical and hippocampal Fos expression induced in the rat by placement in a novel environment. Brain Research. 2005;1051(1–2):57–65. doi: 10.1016/j.brainres.2005.05.052. [DOI] [PubMed] [Google Scholar]