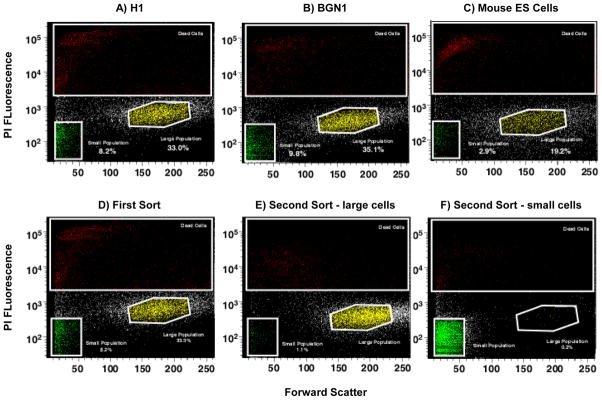
Figure 1. Stem cells display heterogeneous populations.
Identification of two PI negative viable subpopulations of ES cells gated by size using flow cytometry with forward and side scatter. Human and mouse embryonic cell profile exhibiting two viable populations based on size indicated as large and small populations. A) H1 hES cells. B) BGN1 hES cells. C) Mouse ES cells. D) Whole population of H1 hES cells sorted and gated by size after PI treatment to remove dead cells. E) H1 Large population of gated re-sorted cells from figure 1D. F) Small population of gated re-sorted cells from figure 1D.

