Abstract
The regulation of Schwann cell (SC) responses to injury stimuli by microRNAs (miRNAs) remains to be explored. Here, we identified 17 miRNAs that showed dynamic expression alterations at five early time points following rat sciatic nerve resection. Then we analyzed the expression pattern of 17 miRNAs, and integrated their putative targets with differentially expressed mRNAs. The resulting 222 potential targets were mainly involved in cell phenotype modulation, including immune response, cell death and cell locomotion. Among 17 miRNAs, miR-182 expression was up-regulated. The enhanced expression of miR-182 was correlated with nerve injury-induced phenotype modulation of SCs. Further investigation revealed that fibroblast growth factor 9 (FGF9) and neurotrimin (NTM) were two direct targets of miR-182 in SCs, with miR-182 binding to the 3′-untranslated region of FGF9 and NTM. Silencing of FGF9 and NTM recapitulated the inhibiting effect of miR-182 mimics on SC proliferation and migration, respectively, whereas enforced knockdown of FGF9 and NTM reversed the promoting effect of miR-182 inhibitor on SC proliferation and migration, respectively. Our data indicate that nerve injury inhibits SC proliferation and migration through rapid regulation of miR-182 by targeting FGF9 and NTM, providing novel insights into the roles of miRNAs in nerve injury and repair.
INTRODUCTION
One of distinctive features of the peripheral nervous system (PNS), different from the central nervous system (CNS), is its ability to regenerate on its own after injury. Schwann cells (SCs), the major glial cell in PNS, ensheathe and myelinate axons and play an essential role in peripheral nerve regeneration (1). Damage to sciatic axons triggers an innate response of the downstream population of enwrapping SCs. This process, termed ‘Wallerian degeneration’, spans the distal stump within 12 h after nerve damage (2). In contrast, the proximal stump maintains the structural and functional integrity except a retrograde degeneration in a short segment (3). It generally takes at least a few days after nerve injury, known as ‘the initial delay period’, for SCs to start proliferation and migration in the proximal stump (4,5). The intrinsically different cell responses to injury between the proximal and distal stumps are probably induced by specific signals from the axotomized neuronal cell body and its axons (2,6). Less explanation, however, has been put forward to reconcile the conflicting phenomena that SCs undergo the opposite phenotype modulations between the proximal and distal stumps of the damaged nerve at an early stage following nerve injury.
microRNAs (miRNAs) are a novel class of endogenous, 20–23 nucleotides, small non-coding RNAs and serve as post-transcriptional regulators of gene expression (7). They regulate gene expression by binding to the 3′-untranslated region (3′-UTR) of target mRNAs, resulting in translational repression or degradation of target mRNAs. In this way, miRNAs are involved in a wide variety of cellular processes, including development, proliferation and differentiation (8,9). A number of miRNAs have been found in the mammalian CNS and PNS, including the brain, spinal cord and dorsal root ganglion (DRG), where they are involved in neurodevelopment and neurological diseases (10,11). Several recent studies suggest that miRNAs can critically regulate SC gene expression that is required for myelination and maintenance of axons via axon–glia interactions (12–14). To date, however, few reports are available on early influences of miRNAs on SCs after peripheral nerve injury.
In order to gain new insights into the early effects of miRNAs on SC cell behaviors after peripheral nerve injury, this study was designed to investigate the alterations and roles of miRNAs in regulating SC responses to injury at an early stage following sciatic nerve injury.
MATERIALS AND METHODS
Animal surgery and tissue preparation
In total, 36 adult, male Sprague-Dawley (SD) rats (180–220 g) underwent surgery of nerve resection. The animals were anaesthetized by an intraperitoneal injection of complex narcotics, and the sciatic nerve was exposed and lifted through an incision on the lateral aspect of the mid-thigh of the left hind limb. A 10-mm long segment of sciatic nerve was resected at the site just proximal to its division of tibial and common peroneal nerves, and the incision site was then closed. To minimize the discomfort and possible painful mechanical stimulation, the rats were housed in large cages with sawdust bedding after surgery. All animals were randomly divided into six groups (n = 6) according to different time points. In each group, the 5-mm long proximal stump segment was collected at 0, 0.5, 1, 3, 6 and 9 h after nerve injury, respectively. The experiment was repeated three times. All the experimental procedures involving animals were conducted in accordance with Institutional Animal Care guidelines and approved ethically by the Administration Committee of Experimental Animals, Jiangsu Province, China.
miRNA microarray
The total RNA was extracted with a mirVana™ miRNA Isolation Kit (Ambion, Austin, TX, USA) according to the manufacturer’s instructions. The quality of the purified RNA was assessed using a BioAnalyzer 2100 (Agilent Technologies, Santa Clara, CA, USA). The purified RNA was quantified by determining the absorbance at 260 nm with a Nanodrop ND-1000 spectrophotometer (Infinigen Biotechnology Inc., City of Industry, CA, USA). A miRNA microarray (Agilent Technology), containing probes for the complete Sanger miRBase 10.0, was used to screen RNA samples of different groups. The labeling and hybridization were performed by the Shanghai Biochip Company (Shanghai, China) according to the protocols in the Agilent miRNA microarray system. Agilent Scan Control software was used for scanning the microarray slides, and Agilent Feature Extraction software version 9.5.3 was used for image analysis. Microarray data were analyzed using GeneSpring GX v11.0 software (Agilent Technology).
Bioinformatics analysis
Following microarray analysis, the miRNA or mRNA expression was compared among different groups, the significance and false discovery rate (FDR) were calculated using the adjusted F-test with the Random Variation Model (RVM) (15), and the differentially expressed genes at successive time points were identified.
Using the differentially expressed miRNAs, the following analyses were conducted: (i) for hierarchical clustering, we calculated Z-score from the miRNA expression, and computed the distance (dissimilarity) in both ways (miRNA and time) with the Euclidean distance measure; (ii) for miRNA expression pattern clustering, we performed significance analysis of expression tendency for differentially expressed miRNAs (16); (iii) we searched for putative targets of miRNA in specific profiles with miRBase database, and integrated putative miRNA targets with differentially expressed mRNAs to yield potential targets; (iv) we conducted Gene ontology (GO) and Kyoto Encyclopedia of Genes and Genomes (KEGG) pathway enrichment analyses for the integrated targets and (v) we constructed the network for miRNAs and their targets.
Afterwards, the specific miRNAs and mRNAs were integrated to select the inversely correlated miRNA-target pairs, and the Pearson correlation coefficient and P-value between each pair of miRNA and mRNA were calculated.
Primary culture of SCs and oligonucleotide transfection
SCs were isolated from the sciatic nerves of 1-day-old SD rats and further treated to remove the fibroblasts using anti-Thy1.1 antibody and rabbit complement as previously described (17). The final cell preparation consisted of 98% SCs, as determined by immunostaining with anti-S100, a specific SC marker. Primary culture of SCs was maintained in Dulbecco’s modified Eagle’s medium (DMEM) containing 10% fetal bovine serum (complete medium) at 37°C under humidified 5% CO2. SC cultures were passaged no more than three times before the following analyses.
SCs were transfected with miRNA mimics, miRNA inhibitor or small interfering RNAs (siRNAs) (Ribobio, Guangzhou, China), respectively, using Lipofectamine RNAiMAX transfection reagent (Invitrogen, Carlsbad, CA, USA) according to the manufacturer’s instructions. The sequences of siRNA duplexes are listed in Supplementary Table S1.
Quantitative real time polymerase chain reaction
Reverse-transcribed complementary DNA was synth-esized with the Prime-Script RT reagent Kit (TaKaRa, Dalian, China). Quantitative real time polymerase chain reaction (qRT–PCR) was performed with SYBR Premix Ex Taq (TaKaRa). For miRNA detection, mature miR-182 was reverse-transcribed with specific RT primer, quantified with a TaqMan probe, and normalized by RNU6B mature miRNAs using TaqMan miRNA assays (Applied Biosystems, Foster City, CA, USA). The relative expression level was calculated using the comparative 2−ΔCt method.
In situ hybridization
In situ hybridization was performed using the miRCURY LNA™ microRNA ISH Optimization Kit (Exiqon, VedBaek, Denmark) according to the manufacturer’s instructions. Briefly, nerve sections were sequentially treated with 3 µg/ml proteinase K and 0.2% glycine-PBS for 20 and 5 min, and then washed, followed by acetylation with 0.25% acetic anhydride in 0.1 M triethanolamine hydrochloride for 10 min. Hybridization with DIG-labeled probes was carried out for 2 h at 55°C in hybridization buffer. Afterwards, sections were washed in 5× SSC for 5 min at 55°C, 1× SSC two times for 5 min at 55°C, 0.2× SSC two times for 5 min at 55°C and 0.2× SSC for 5 min at room temperature. Blocking was performed for 2 h at room temperature with alkaline phosphatase-conjugated Fab anti-DIG antibody (Roche, Mannheim, Germany) in 2% sheep serum. The sections were stained by 5-bromo-4-chloro-3-indolyl-phosphate and nitroblue tetrazolium (Roche), and then counterstained by Nuclear Fast Red™ (Vector Labs, Burlingame, CA, USA).
Western blot analysis
Protein extracts were prepared from cell cultures. Equal amounts of protein were subjected to SDS–PAGE and electrotransferred to the nitrocellulose membrane (Bio-Rad, Hercules, CA, USA). The membrane was blocked with 5% non-fat dry milk in Tris–HCl buffered saline (pH 7.4) supplemented with Tween-20, and incubated with the primary antibody against fibroblast growth factor 9 (FGF9) or neurotrimin (NTM) (Santa Cruz Biotechnology, Santa Cruz, CA, USA) according to the manufacturer’s recommendations. Antibody binding was detected by the HRP-conjugated species-specific secondary antibody, followed by an enhanced chemiluminescence assay (Pierce Chemical Company, Rockford, IL, USA).
Cell proliferation assay
SCs were resuspended in fresh pre-warmed (37°C) complete medium, counted and plated at a density of 2 × 10⁵ cells/ml onto 0.01% poly-L-lysine-coated 96-well plates. At the indicated time after cell transfection, 50 μM 5-ethynyl-2′-deoxyuridine (EdU) was applied to the cell culture to allow incubation for additional 2 h. Finally, the cells were fixed with 4% formaldehyde in PBS for 30 min. After labeling, the cells were assayed using Cell-Light™ EdU DNA Cell Proliferation Kit (Ribobio) according to the manufacturer’s protocol. SC proliferation (ratio of EdU+ to all SCs) was analyzed by using images of randomly selected fields obtained on a DMR fluorescence microscope (Leica Microsystems, Bensheim, Germany). Assays were performed three times using triplicate wells.
Cell migration assay
SC migration was examined using 6.5 mm Transwell chambers with 8 μm pores (Costar, Cambridge, MA, USA) as described previously (17). The bottom surface of each membrane was coated with 10 μg/ml fibronectin. A 100 -μL DMEM containing resuspended SCs (106 cells/ml) was transferred to the top chambers of each transwell and allowed to migrate at 37°C in 5% CO2 before addition of 600 μl complete medium into the lower chambers. The upper surface of each membrane was cleaned with a cotton swab at the indicated time. Cells adhering to the bottom surface of each membrane were stained with 0.1% crystal violet, imaged and counted using a DMR inverted microscope (Leica Microsystems). Assays were performed three times using triplicate wells.
Luciferase reporter assay
The 3′-UTR sequence of FGF9 or NTM was amplified from the genomic DNA and subcloned into the region directly downstream of the stop codon in the luciferase gene in the luciferase reporter vector. With appropriate primers, PCR amplification of the 3′-UTR sequence of FGF9 or NTM generated different p-Luc-UTR luciferase reporter vectors. The sequences of wild-type and mutant 3′-UTR were confirmed by sequencing. HEK 293T cells were seeded in 96-well plates and transfected with a mixture of 30 ng p-Luc-UTR, 5 pmol miRNA mimics and 5 ng Renilla according to the recommended protocol for the Lipofectamine 2000 transfection system (Invitrogen). After 48 h of incubation, the activity of firefly and Renilla luciferases was measured from the cell lysates using the dual-luciferase reporter assay system (Promega, Madison, WI, USA).
Statistical analysis
Statistical analyses were done using SPSS 15.0 for windows (SPSS, Chicago, IL, USA). The Student’s t-test was used for comparison between the two groups. P < 0.05 was considered statistically significant. All data were expressed as mean ± SD.
RESULTS
Expression profiling of miRNAs in proximal nerve stump following sciatic nerve injury
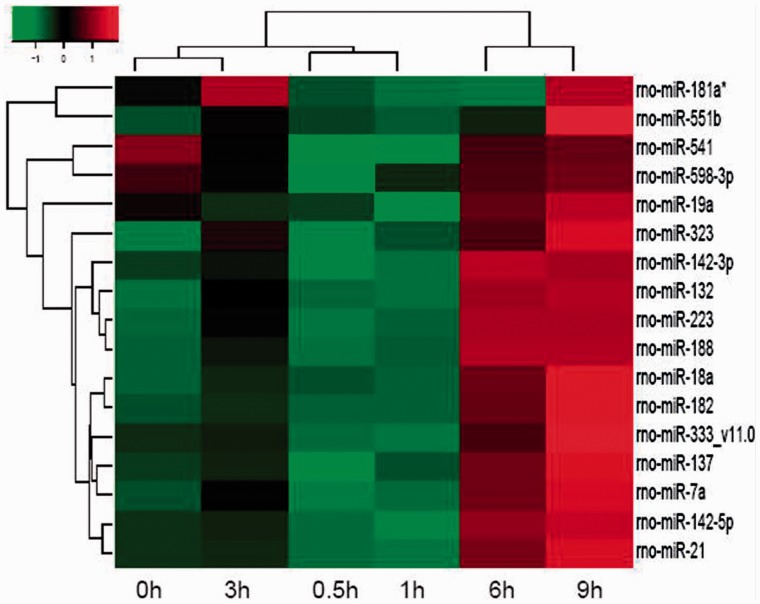
To examine the involvement of miRNAs in nerve regeneration, we investigated the expression profile of miRNAs in the proximal nerve stump after sciatic nerve injury with Agilent miRNA microarray. According to RVM screening, a total of 17 miRNAs showed dynamic expression alteration at 0, 0.5, 1, 3, 6 and 9 h after injury. The hierarchical cluster analysis (Figure 1) indicated that the miRNA transcriptome exhibited an extraordinary resemblance between 6 h and 9 h as compared with control (0 h group). In order to screen out some key miRNAs, the expression profile was analyzed, and two significant patterns were found: profiles 48 and 61 (Supplementary Figure S1). Briefly, the miRNA expression in profile 48 (miR-21, miR-333_v11.0, miR-551b, miR-18a, miR-182) and profile 61 (miR-132, miR-223, miR-188, miR-142-3p, miR-142-5p) were promptly elevated at 3 h after injury, and then leveled off with significantly higher values as compared with control.
Figure 1.
Heatmap and cluster dendrogram of differentially expressed 17 miRNAs that showed significant changes at five time points following nerve injury. The color scale shown on the top illustrates the relative expression level of the indicated miRNA across all samples: red denotes expression >0 and green denotes expression <0.
We searched for the putative targets of the 10 miRNAs in profiles 48 and 61 by using miRBase database, and then integrated putative miRNA targets with the differentially expressed mRNAs, thus yielding 222 potential targets. In order to know credible biological functions, we conducted GO and KEGG pathway enrichment analyses for the intersected genes. The GO terms that have the highest enriched score and the most significant P-value are listed in Table 1. The most significant GO functions are related to cell phenotype modulation, including inflammatory response, locomotory behavior, programed cell death and neutrophil chemotaxis. Functional classification by KEGG pathway (Cytokine–cytokine receptor interaction; Chemokine signaling pathway; MAPK signaling pathway) was significantly enriched by the targets (Supplementary Table S2). Moreover, the network for 8 miRNAs and 222 target genes were constructed (Supplementary Figure S2).
Table 1.
Gene ontology analysis
| GO ID | GO terms | P-value | qFDR |
|---|---|---|---|
| GO:0006954 | Inflammatory response | 9.78E-10 | 2.80E-06 |
| GO:0007626 | Locomotory behavior | 1.82E-07 | 0.0001 |
| GO:0023014 | Signal transmission via phosphorylation event | 2.94E-07 | 0.0001 |
| GO:0009893 | Positive regulation of metabolic process | 8.23E-07 | 0.0003 |
| GO:0002682 | Regulation of immune system process | 9.56E-07 | 0.0003 |
| GO:0012501 | Programed cell death | 1.17E-06 | 0.0003 |
| GO:0030593 | Neutrophil chemotaxis | 1.36E-06 | 0.0003 |
| GO:0010035 | Response to inorganic substance | 2.13E-06 | 0.0004 |
| GO:0045597 | Positive regulation of cell differentiation | 3.68E-06 | 0.0007 |
| GO:0080134 | Regulation of response to stress | 5.33E-06 | 0.0008 |
Functional analysis of miR-182
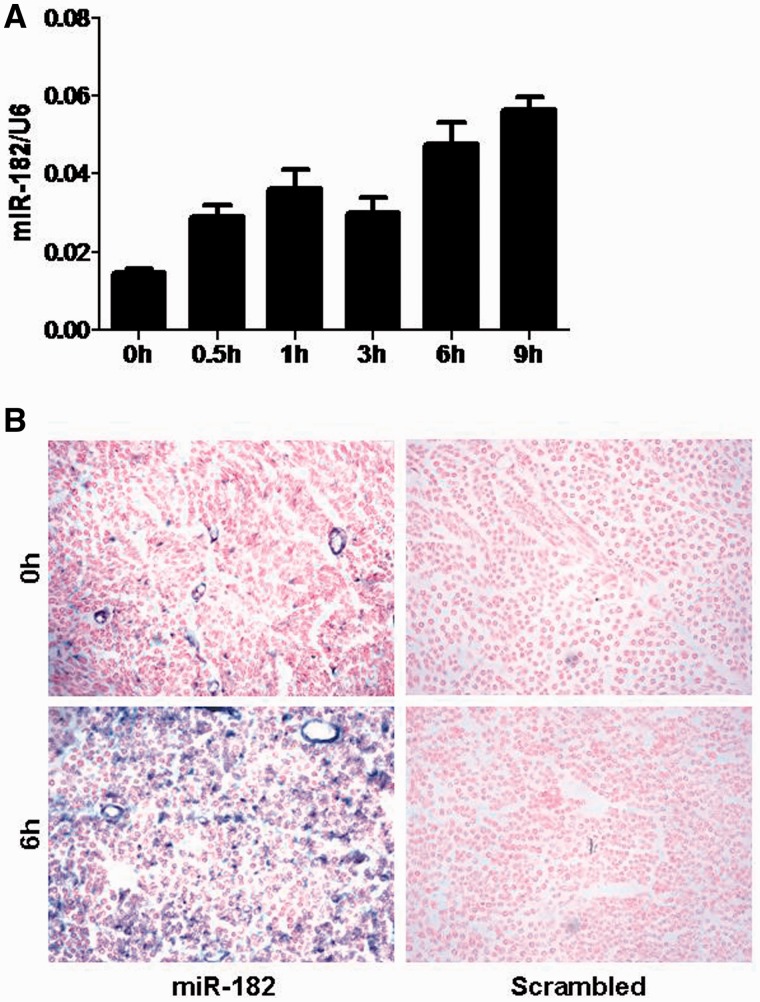
Out of the above eight miRNAs, miR-182 was specifically selected for functional analysis in light of the previous findings that miR-182 plays an inhibitory role in cell proliferation and invasion (18,19), which was consistent with our result that cellular modulation-related processes were among the top list in the GO terms of miRNA targets. The qRT–PCR analysis of miR-182 expression in the proximal nerve stump at different time points after injury confirmed the microarray data (Figure 2A). Moreover, in situ hybridization indicated that the up-regulation of miR-182 actually occurred in SCs at 6 h after injury (Figure 2B).
Figure 2.
miR-182 up-regulation in the SCs following nerve injury. (A) qRT–PCR validation of the miR-182 level in the proximal nerve stump at five time points following sciatic nerve resection. (B) In situ hybridization with miR-182 and control scrambled probes showed the up-regulation of miR-182 expression in SCs following sciatic nerve resection.
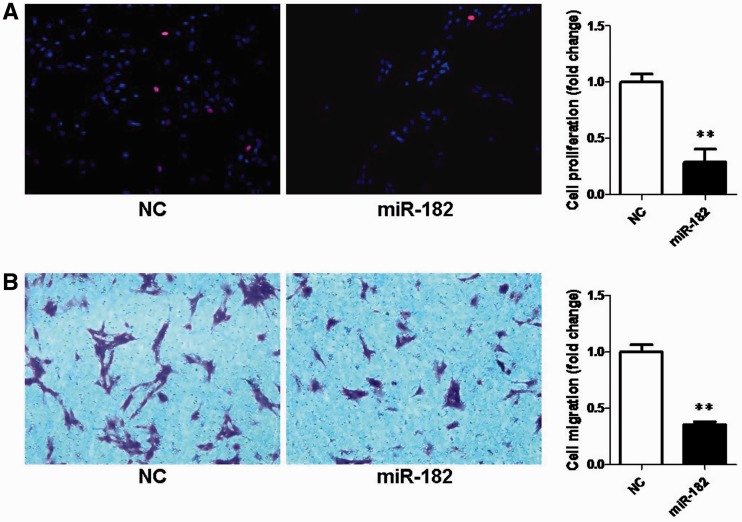
To test whether the dys-regulation of miR-182 was sufficient to impact cellular function, SCs were transfected with miR-182 mimics or non-targeting negative controls. According to EdU-based proliferation assay, the cell proliferation rate of SCs transfected with miR-182 mimics was significantly decreased by ∼70% when compared with that of control (Figure 3A). Transwell migration assay showed that transfection of miR-182 mimics significantly decreased the migratory ability of SCs when compared with that of control (Figure 3B). The above data suggest that miR-182 up-regulation is sufficient to inhibit proliferation and migration of SCs.
Figure 3.
Effects of miR-182 on SC proliferation and migration. Primary SCs were transfected with miR-182 mimics (miR-182), mimics control (NC). (A) The proliferation rate of SCs transfected with miR-182 was significantly decreased compared with that of control (**P < 0.01). (B) The migration ability of SCs transfected with miR-182 was significantly decreased compared with that of control (**P < 0.01).
Post-transcriptional down-regulation of both FGF9 and NTM expressions by miR-182 through targeting their 3′-UTR
Because miRNAs exert their biological functions through suppression of target genes, it is important to identify miRNA–gene target pairs. We only selected the inversely correlated miRNA-target pairs that were expressed in the proximal nerve stump, and identified two correlated targets (Supplementary Table S3): FGF9 (correlation coefficient = –0.277) and NTM (also known as HNT; correlation coefficient = –0.978), both of which were potentially down-regulated by miR-182.
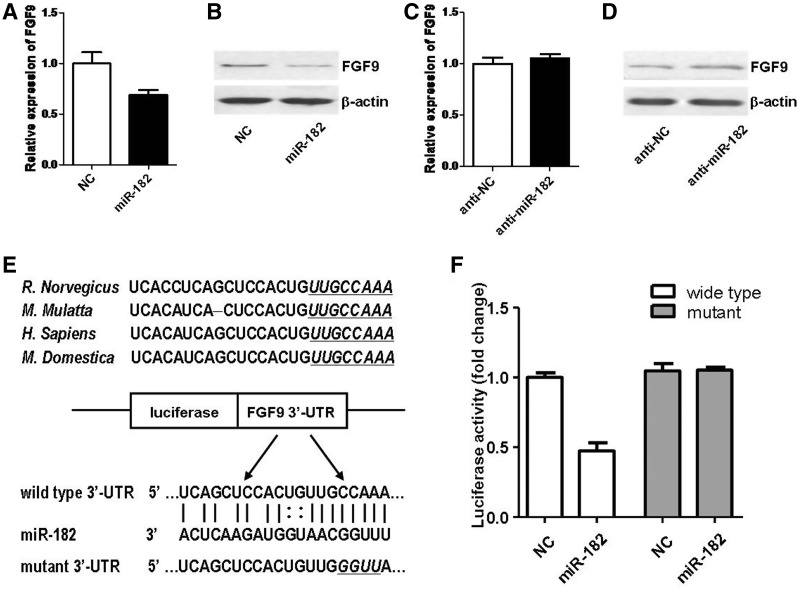
To verify whether miR-182 affected the endogenous FGF9 level, we analyzed the effects of ectopic alteration of miR-182 on primary SCs. The qRT–PCR and western blot analysis showed that overexpression of miR-182 slightly suppressed the mRNA expression of FGF9 (Figure 4A), whereas obviously suppressed the protein expression of FGF9 (Figure 4B). Meanwhile, we found that inhibition of miR-182 failed to affect the mRNA expression of FGF9 (Figure 4C), whereas enhanced the protein expression of FGF9 (Figure 4D). The above observations suggested that FGF9 was regulated by miR-182 mainly through translational repression of target mRNAs. In order to determine whether FGF9 was regulated by miR-182 through direct binding to 3′-UTR of FGF9, the wild-type or mutant 3′-UTR of FGF9 was constructed and inserted into the downstream region of the luciferase reporter gene, and miR-182 mimics and p-Luc-UTR construct were co-transfected into HEK 293T cells for measuring luciferase activity (Figure 4E). When UTR contained the wild-type binding site, miR-182 led to a significant decrease in the relative luciferase activity. In contrast, when UTR contained the mutant binding site, miR-182 did not lead to a decrease in the relative luciferase activity (Figure 4F). The observations implied that binding of miR-182 to 3′-UTR of FGF9 was sequence-specific.
Figure 4.
FGF9 was a direct target for miR-182. (A) FGF9 mRNA expression was slightly down-regulated by transfection with miR-182 mimics (miR-182) compared with that of mimics control (NC). (B) FGF9 protein expression was down-regulated by transfection with miR-182 mimics (miR-182) compared with that of mimics control (NC). (C) FGF9 mRNA expression was not affected by transfection with miR-182 inhibitor (anti-miR-182) compared with that of inhibitor control (anti-NC). (D) FGF9 protein expression was up-regulated by transfection with miR-182 inhibitor (anti-miR-182) compared with that of inhibitor control (anti-NC). (E) Sketch of the construction of wild-type or mutant p-Luc-UTR vectors. The mutant binding site is underlined and italicized. (F) The relative luciferase activity was analyzed after the p-Luc-UTR vectors were co-transfected into 293T cells with miR-182 mimics (miR-182) or mimics control (NC). Renilla luciferase vector was used as an internal control.
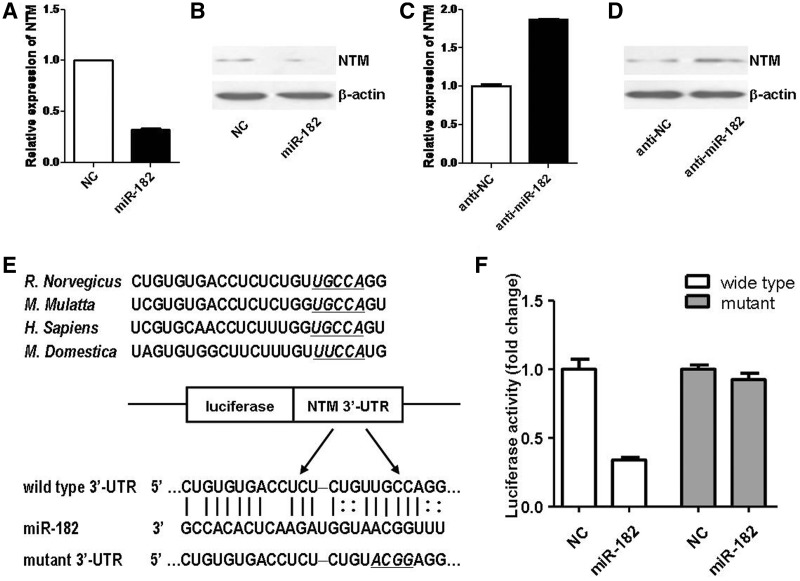
To identify another most significantly correlated target, NTM, qRT–PCR and western blot analysis demonstrated that overexpression of miR-182 suppressed both mRNA and protein expressions of NTM (Figure 5A and B). Meanwhile, we found that inhibition of miR-182 enhanced both mRNA and protein expressions of NTM (Figure 5C and D). Our data suggested that NTM was regulated by miR-182 mainly through degradation of target mRNAs. On the other hand, luciferase reporter assay with two UTRs, which contained the wild-type binding site and mutant binding site, respectively (Figure 5E), also suggested that down-regulation of NTM expression was regulated by miR-182 through binding to 3′-UTR of NTM in the same way as that for FGF9 (Figure 5F).
Figure 5.
NTM was a direct target for miR-182. (A, B) NTM mRNA (A) and protein (B) expressions were down-regulated by transfection with miR-182 mimics (miR-182), compared with those of mimics control (NC). (C, D) NTM mRNA (C) and protein (D) expressions were up-regulated by transfection with miR-182 inhibitor (anti-miR-182), compared with those of inhibitor control (anti-NC). (E) Sketch of the construction of wild-type or mutant p-Luc-UTR vectors. The mutant binding site is underlined and italicized. (F) The relative luciferase activity was analyzed after the p-Luc-UTR vectors were co-transfected into 293T cells with miR-182 mimics (miR-182) or mimics control (NC). Renilla luciferase vector was used as an internal control.
Recapitulation of miR-182 inhibition of SC proliferation and migration by knockdown of FGF9 and NTM, respectively
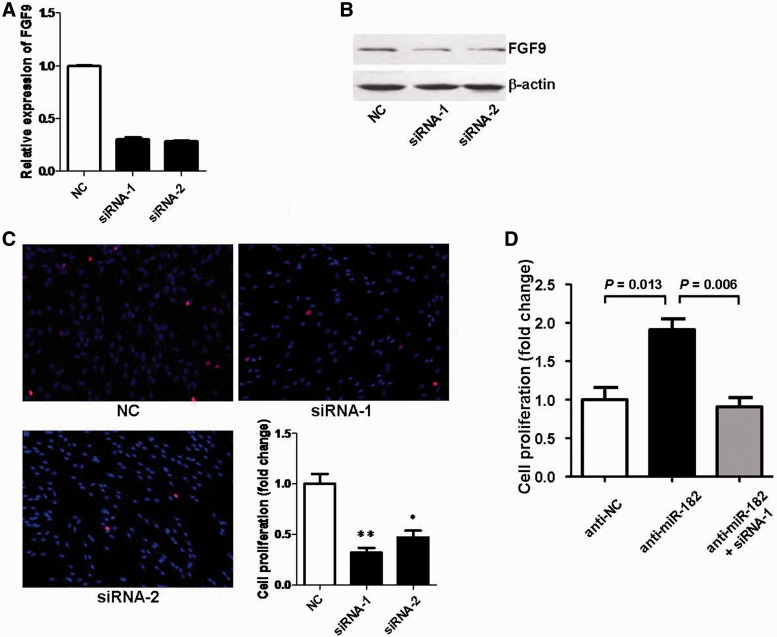
To determine the function of FGF9, two specific siRNAs against FGF9, siRNA-1 and siRNA-2, were synthesized, and both of them were found to remarkably reduce the FGF9 expression at the mRNA and protein level (Figure 6A and B). Cell proliferation assays showed that both siRNA-1 and siRNA-2 elicited an inhibitory effect on proliferation of SCs as compared with control (Figure 6C). From the above data, it followed that knockdown of FGF9 by siRNAs had similar inhibitory effects on SC proliferation to those induced by miR-182 overexpression.
Figure 6.
FGF9 silencing reversed the promoting effect of miR-182 inhibitor on SC proliferation. (A) FGF9 mRNA expression in SCs was down-regulated by transfection with FGF9-siRNA-1 (siRNA-1), or FGF9-siRNA-2 (siRNA-2), compared with that of siRNA control (NC). (B) FGF9 protein expression in SCs was down-regulated by transfection with FGF9-siRNA-1 (siRNA-1), or FGF9-siRNA-2 (siRNA-2) compared with that of siRNA control (NC). (C) Both FGF9-siRNA-1 (siRNA-1) and FGF9-siRNA-2 (siRNA-2) significantly inhibited SC proliferation compared with that of siRNA control (NC) (**P < 0.01, *P < 0.05). (D) The proliferation rate of SCs was examined after transfection with miR-182 inhibitor (anti-miR-182) in the presence or absence of FGF9-siRNA-1 (siRNA-1).
Based on the finding that FGF9 was post-transcriptionally regulated by miR-182 through directly binding to 3′-UTR of FGF9, and considering that knockdown of FGF9 could inhibit SC proliferation, we hypothesized that down-regulation of FGF9 expression was likely to directly mediate SC proliferation initiated by miR-182. To test this issue, miR-182 expression was down-regulated by transfecting SCs with miR-182 inhibitor in the presence or absence of siRNA-1 against FGF9. A significant increase in cell proliferation was observed in SCs transfected with miR-182 inhibitor, whereas a significant decrease in cell proliferation appeared in SCs co-transfected with miR-182 inhibitor and siRNA-1 against FGF9 (Figure 6D). Notably, the decreased expression of FGF9 attenuated the increase in SC proliferation induced by miR-182 inhibitor.
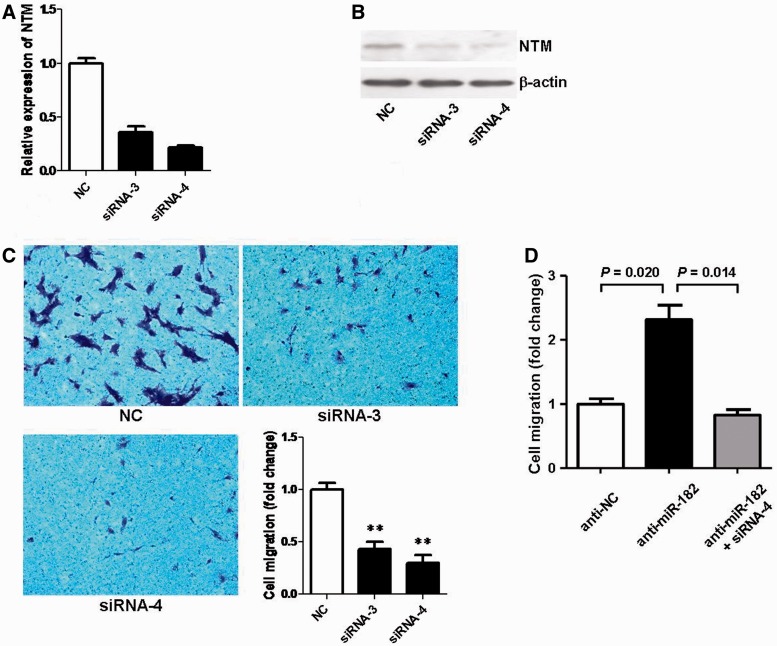
To validate whether NTM could recapitulate the effects of miR-182 on SC migration, we performed the NTM-related analyses similar to the aforementioned FGF9-related ones but testing the influences on SC migration instead of on SC proliferation. Our data not only revealed that knockdown of NTM by either of two siRNAs (siRNA-3 and siRNA-4) exerted similar inhibitory effects on SC migration to those induced by miR-182 overexpression (Figure 7A–C), but also confirmed that down-regulation of NTM expression was able to directly alleviate the increase in SC migration initiated by miR-182 inhibitor (Figure 7D).
Figure 7.
NTM silencing reversed the promoting effect of miR-182 inhibitor on SC migration. (A) NTM mRNA expression in SCs was down-regulated by transfection with NTM-siRNA-3 (siRNA-3), or NTM-siRNA-4 (siRNA-4) compared with that of siRNA control (NC). (B) NTM protein expression in SCs was down-regulated by transfection with NTM-siRNA-3 (siRNA-3), or NTM-siRNA-4 (siRNA-4), compared with that of siRNA control (NC). (C) Both NTM-siRNA-3 (siRNA-3) and NTM-siRNA-4 (siRNA-4) significantly inhibited SC migration, compared with that of siRNA control (NC) (**P < 0.01). (D) The migration ability of SCs was examined after transfection with miR-182 inhibitor (anti-miR-182) in the presence or absence of NTM-siRNA-4 (siRNA-4).
Collectively, these findings show that inhibition of FGF9/NTM could abrogate anti-miR-182-induced promotion of SC proliferation/migration, suggesting that FGF9/NTM is the functional mediator of miR-182.
DISCUSSION
After peripheral nerve injury, the denervated SCs in the distal stump begin to dedifferentiate, proliferate, migrate and then form Bungner bands, which act as guides for the regenerative axonal sprouting in the proximal stump (2). In our model, however, the proximal nerve stump is largely free of influence from distal degenerating axons, and the proximal axons are still in contact with their cell body. Therefore, it usually takes the so-called ‘the initial delay period’ for SCs to cause the cell changes without the need of breaking down their own axons. Previous observation indicates that just at 24 h, prominently 5 days, after axonal transection, the myelin-forming SCs begin to proliferate in the proximal stump (20). It is also found that matrix metalloproteinase-9 (MMP-9) serves as a potent modulator of SC signaling and phenotype remodeling to suppress SC proliferation. Briefly, >200-fold increase in MMP-9 mRNA occurs in the proximal stump at 6 h after axonal transection, and ∼2-fold higher MMP-9 level in the proximal than in the distal stump (21–23). On the other hand, SCs in the proximal stump are known to begin migration in two directions: from the stump endoneurium distally into an outgrowth zone and from the endoneurium laterally into the perineurium and epineurium at 5 days after axonal transection (20). In vivo live imaging with double-transgenic thy1-CFP (23)/S100-GFP mice also demonstrates that SC migration and infiltration occurs in the proximal stump at 5 days after axonal transection (24). Taken together, previous studies indicate that SCs in the proximal stump undergo distinct phenotype changes in response to nerve injury. The molecular events during ‘the initial delay period’, especially the inhibition of SC proliferation and migration, however, are still not fully clear. Therefore, this study aimed to investigate cell phenotype changes of SCs in the proximal stump at an early stage after nerve injury from a unique perspective of miRNA modulation.
Since miRNAs are attractive candidates as upstream regulators of gene expression and deeply involved in a variety of biology processes (11,25,26), it is worthwhile to decipher the influences of miRNAs on SC cell behaviors after nerve injury. The high-throughput miRNA microarray enabled us to identify 17 miRNAs that was significantly dys-regulated in proximal nerve segments during early time period after sciatic nerve injury. In addition, GO and KEGG pathway enrichments were applied to identify the functions of these miRNAs. The annotation was related to responses to inflammatory stimulus, cell growth, cell chemotaxis, cell locomotion and signal transduction, all of which are important in SC phenotype modulation and SC–axon interaction over the early stage after nerve injury.
Previously, studies show that miR-182 is highly enriched in sensory organ-specific development and function (27,28). miR-182 has been considered as a potential candidate for therapies designed to promote hair cell regeneration (29). In DRGs, miR-182 influences the translation of genes that are important for the unique function of nociceptive and mechanosenstive primary afferent neurons, thus contributing to alterations in gene expression and neuronal properties after peripheral nerve injury (30). In this study, we noticed that miR-182 exerted functions at an early stage after sciatic nerve resection. Because primary culture of SCs is the most accurate model for understanding the physiology of SCs in severely injured and/or denervated peripheral nerves (31), it is important to have insights into miR-182 functions in primary SCs. We identified an additional role for miR-182 in injury-initiating nerve reconstruction by orchestrating the directed proliferation and migration of SCs. When peripheral nerves are injured, it takes at least a few days until SCs dedifferentiate and start migration as to maintain the structural and functional integrity of the proximal stump at an early stage (4,5). This integrity is, to a certain extent, necessary for the survival of neurons and the intrinsic potential of neuritic growth. In consequence, the responses of SCs during nerve regeneration might be partially regulated by mechanisms mediated by the endogenous miR-182.
miR-182 is known to act as a tumor suppressor by targeting the oncogene regulator of G-protein signaling 17 and cortactin, thereby controlling cell proliferation and invasion (18,19). miR-182 signaling generally induces the inhibiting effect on cell growth or cell metastasis in different tissues. In this study, FGF9, a new direct and functional target of miR-182, was identified. FGF9 (glial activating factor) is one of the 23 members of the highly conserved FGF family. As a secreted, glycosylated 26-kDa protein, it has mitogenic effects on a variety of different cell types (32). In the nervous system, FGF9 is important for the development of glial cells and exhibits a growth-stimulating effect on cultured glial cells (33). Likewise, another new direct and functional target of miR-182, NTM, was also identified. NTM is a member of the family of neural cell adhesion molecules (NCAM) (34), mediates cell–cell recognition and helps to promote axonal fasciculation, to guide nerve fibers towards specific targets and to stabilize synapses during nerve development (35,36). NCAM is involved in cell growth, migration and differentiation, especially the ectopic expression of polysialylated NCAM promotes adult macaque SC migration and improves their integration among astrocytes in vitro without modifying their antigenic properties as either non-myelinating or pro-myelinating (37). Intriguingly, NTM is dys-regulated in the injured spinal cord, and its expression is regulated by afferent input (34). In this study, we found that miR-182 directly recognized the 3′-UTR of FGF9 and NTM, and noted that miR-182 was at least one of the major contributors to the inhibition of SC proliferation and migration through FGF9 and NTM for keeping SC communication with axon during nerve regeneration.
In summary, our data represent the first study of early changes of miR-182 expression in the proximal nerve stump following sciatic nerve injury, and indicate that nerve injury-induced inhibition of SC proliferation and migration might be regulated by miR-182 through down-regulation of FGF9 and NTM, respectively, thus providing novel insights into the role of miRNAs in peripheral nerve injury and repair.
SUPPLEMENTARY DATA
Supplementary Data are available at NAR Online: Supplementary Tables 1–3 and Supplementary Figures 1 and 2.
FUNDING
National Natural Science Foundation of China [81130080, 81171180 and 31100761]; Jiangsu Provincial Natural Science Foundation [BK2010283]; Collegiate Natural Science Foundation of Jiangsu Province [10KJB180007]; Priority Academic Program Development of Jiangsu Higher Education Institutions (PAPD). Funding for open access charge: PAPD.
Conflict of interest statement. None declared.
Supplementary Material
ACKNOWLEDGEMENTS
We thank Professor Jie Liu for assistance in the preparation of the manuscript.
REFERENCES
- 1.Raphael AR, Perlin JR, Talbot WS. Schwann cells reposition a peripheral nerve to isolate it from postembryonic remodeling of its targets. Development. 2010;137:3643–3649. doi: 10.1242/dev.057521. [DOI] [PMC free article] [PubMed] [Google Scholar]
- 2.Guertin AD, Zhang DP, Mak KS, Alberta JA, Kim HA. Microanatomy of axon/glial signaling during Wallerian degeneration. J. Neurosci. 2005;25:3478–3487. doi: 10.1523/JNEUROSCI.3766-04.2005. [DOI] [PMC free article] [PubMed] [Google Scholar]
- 3.Navarro X, Vivó M, Valero-Cabré A. Neural plasticity after peripheral nerve injury and regeneration. Prog. Neurobiol. 2007;82:163–201. doi: 10.1016/j.pneurobio.2007.06.005. [DOI] [PubMed] [Google Scholar]
- 4.Liu H, Kim Y, Chattopadhyay S, Shubayev I, Dolkas J, Shubayev VI. Matrix metalloproteinase inhibition enhances the rate of nerve regeneration in vivo by promoting dedifferentiation and mitosis of supporting schwann cells. J. Neuropathol. Exp. Neurol. 2010;69:386–395. doi: 10.1097/NEN.0b013e3181d68d12. [DOI] [PMC free article] [PubMed] [Google Scholar]
- 5.Tomita k, Hata Y, Kubo T, Fujiwara T, Yano J, Hosokawa K. Effects of the in vivo predegenerated nerve graft on early Schwann cell migration: Quantitative analysis using S100-GFP mice. Neurosci. Lett. 2009;461:36–40. doi: 10.1016/j.neulet.2009.05.075. [DOI] [PubMed] [Google Scholar]
- 6.Murinson BB, Archer DR, Li Y, Griffin JW. Degeneration of myelinated efferent fibers prompts mitosis in Remak Schwann cells of uninjured C-fiber afferents. J. Neurosci. 2005;25:1179–1187. doi: 10.1523/JNEUROSCI.1372-04.2005. [DOI] [PMC free article] [PubMed] [Google Scholar]
- 7.Bartel DP. MicroRNAs: target recognition and regulatory functions. Cell. 2009;136:215–233. doi: 10.1016/j.cell.2009.01.002. [DOI] [PMC free article] [PubMed] [Google Scholar]
- 8.Kasinski AL, Slack FJ. Epigenetics and genetics. MicroRNAs en route to the clinic: progress in validating and targeting microRNAs for cancer therapy. Nat. Rev. Cancer. 2011;11:849–864. doi: 10.1038/nrc3166. [DOI] [PMC free article] [PubMed] [Google Scholar]
- 9.Zhao C, Sun G, Li S, Lang MF, Yang S, Li W, Shi Y. MicroRNA let-7b regulates neural stem cell proliferation and differentiation by targeting nuclear receptor TLX signaling. Proc. Natl Acad. Sci. USA. 2010;107:1876–1881. doi: 10.1073/pnas.0908750107. [DOI] [PMC free article] [PubMed] [Google Scholar]
- 10.Davis TH, Cuellar TL, Koch SM, Barker AJ, Harfe BD, McManus MT, Ullian EM. Conditional loss of Dicer disrupts cellular and tissue morphogenesis in the cortex and hippocampus. J. Neurosci. 2008;28:4322–4330. doi: 10.1523/JNEUROSCI.4815-07.2008. [DOI] [PMC free article] [PubMed] [Google Scholar]
- 11.Liu NK, Wang XF, Lu QB, Xu XM. Altered microRNA expression following traumatic spinal cord injury. Exp. Neurol. 2009;219:424–429. doi: 10.1016/j.expneurol.2009.06.015. [DOI] [PMC free article] [PubMed] [Google Scholar]
- 12.Bremer J, O'Connor T, Tiberi C, Rehrauer H, Weis J, Aguzzi A. Ablation of Dicer from Murine Schwann cells increases their proliferation while blocking myelination. PLoS One. 2010;5:e12450. doi: 10.1371/journal.pone.0012450. [DOI] [PMC free article] [PubMed] [Google Scholar]
- 13.Pereira JA, Baumann R, Norrmén C, Somandin C, Miehe M, Jacob C, Lühmann T, Hall-Bozic H, Mantei N, Meijer D, et al. Dicer in Schwann cells is required for myelination and axonal integrity. J. Neurosci. 2010;30:6763–6775. doi: 10.1523/JNEUROSCI.0801-10.2010. [DOI] [PMC free article] [PubMed] [Google Scholar]
- 14.Yun B, Anderegg A, Menichella D, Wrabetz L, Feltri ML, Awatramani R. MicroRNA deficient Schwann cells display congenital hypomyelination. J. Neurosci. 2010;30:7722–7728. doi: 10.1523/JNEUROSCI.0876-10.2010. [DOI] [PMC free article] [PubMed] [Google Scholar]
- 15.Wright GW, Simon RM. A random variance model for detection of differential gene expression in small microarray experiments. Bioinformatics. 2003;19:2448–2455. doi: 10.1093/bioinformatics/btg345. [DOI] [PubMed] [Google Scholar]
- 16.Ramoni MF, Sebastiani P, Kohane IS. Cluster analysis of gene expression dynamics. Proc. Natl Acad. Sci. USA. 2002;99:9121–9126. doi: 10.1073/pnas.132656399. [DOI] [PMC free article] [PubMed] [Google Scholar]
- 17.Mantuano E, Inoue G, Li X, Takahashi K, Gaultier A, Gonias SL, Campana WM. The hemopexin domain of matrix metalloproteinase-9 activates cell signaling and promotes migration of schwann cells by binding to low-density lipoprotein receptor-related protein. J. Neurosci. 2008;28:11571–11582. doi: 10.1523/JNEUROSCI.3053-08.2008. [DOI] [PMC free article] [PubMed] [Google Scholar]
- 18.Sun Y, Fang R, Li C, Li L, Li F, Ye X, Chen H. Hsa-mir-182 suppresses lung tumorigenesis through down regulation of RGS17 expression in vitro. Biochem. Biophys. Res. Commun. 2010;396:501–507. doi: 10.1016/j.bbrc.2010.04.127. [DOI] [PubMed] [Google Scholar]
- 19.Zhang L, Liu T, Huang Y, Liu J. microRNA-182 inhibits the proliferation and invasion of human lung adenocarcinoma cells through its effect on human cortical actin-associated protein. Int. J. Mol. Med. 2011;28:381–388. doi: 10.3892/ijmm.2011.679. [DOI] [PubMed] [Google Scholar]
- 20.Cheng C, Zochodne DW. In vivo proliferation, migration and phenotypic changes of Schwann cells in the presence of myelinated fibers. Neuroscience. 2002;115:321–329. doi: 10.1016/s0306-4522(02)00291-9. [DOI] [PubMed] [Google Scholar]
- 21.Chattopadhyay S, Shubayev VI. MMP-9 controls Schwann cell proliferation and phenotypic remodeling via IGF-1 and ErbB receptor-mediated activation of MEK/ERK pathway. Glia. 2009;57:1316–1325. doi: 10.1002/glia.20851. [DOI] [PMC free article] [PubMed] [Google Scholar]
- 22.Kobayashi H, Chattopadhyay S, Kato K, Dolkas J, Kikuchi S, Myers RR, Shubayev VI. MMPs initiate Schwann cell-mediated MBP degradation and mechanical nociception after nerve damage. Mol. Cell Neurosci. 2008;39:619–627. doi: 10.1016/j.mcn.2008.08.008. [DOI] [PMC free article] [PubMed] [Google Scholar]
- 23.Shubayev VI, Angert M, Dolkas J, Campana WM, Palenscar K, Myers RR. TNFalpha-induced MMP-9 promotes macrophage recruitment into injured peripheral nerve. Mol. Cell Neurosci. 2006;31:407–415. doi: 10.1016/j.mcn.2005.10.011. [DOI] [PMC free article] [PubMed] [Google Scholar]
- 24.Hayashi A, Koob JW, Liu DZ, Tong AY, Hunter DA, Parsadanian A, Mackinnon SE, Myckatyn TM. A double-transgenic mouse used to track migrating Schwann cells and regenerating axons following engraftment of injured nerves. Exp. Neurol. 2007;207:128–138. doi: 10.1016/j.expneurol.2007.06.004. [DOI] [PMC free article] [PubMed] [Google Scholar]
- 25.Lim LP, Lau NC, Garrett-Engele P, Grimson A, Schelter JM, Castle J, Bartel DP, Linsley PS, Johnson JM. Microarray analysis shows that some microRNAs downregulate large numbers of target mRNAs. Nature. 2005;433:769–773. doi: 10.1038/nature03315. [DOI] [PubMed] [Google Scholar]
- 26.Yoon AR, Gao R, Kaul Z, Choi IK, Ryu J, Noble JR, Kato Y, Saito S, Hirano T, Ishii T, et al. MicroRNA-296 is enriched in cancer cells and downregulates p21WAF1 mRNA expression via interaction with its 3′ untranslated region. Nucleic Acids Res. 2011;39:8078–8091. doi: 10.1093/nar/gkr492. [DOI] [PMC free article] [PubMed] [Google Scholar]
- 27.Kloosterman WP, Wienholds E, de Bruijn E, Kauppinen S, Plasterk RH. In situ detection of miRNAs in animal embryos using LNA-modified oligonucleotide probes. Nat. Meth. 2006;3:27–29. doi: 10.1038/nmeth843. [DOI] [PubMed] [Google Scholar]
- 28.Zhu Q, Sun W, Okano K, Chen Y, Zhang N, Maeda T, Palczewski K. Sponge transgenic mouse model reveals important roles for the microRNA-183 (miR-183)/96/182 cluster in postmitotic photoreceptors of the retina. J. Biol. Chem. 2011;286:31749–31760. doi: 10.1074/jbc.M111.259028. [DOI] [PMC free article] [PubMed] [Google Scholar]
- 29.Li GR, Luna CL, Qiu JM, Epstein DL, Gonzalez P. Alterations in microRNA expression in stress-induced cellular senescence. Mech. Ageing Dev. 2009;130:731–741. doi: 10.1016/j.mad.2009.09.002. [DOI] [PMC free article] [PubMed] [Google Scholar]
- 30.Aldrich BT, Frakes EP, Kasuya J, Hammond DL, Kitamoto T. Changes in expression of sensory organ-specific microRNAs in rat dorsal root ganglia in association with mechanical hypersensitivity induced by spinal nerve ligation. Neuroscience. 2009;164:711–723. doi: 10.1016/j.neuroscience.2009.08.033. [DOI] [PMC free article] [PubMed] [Google Scholar]
- 31.Woodhoo A, Alonso MB, Droggiti A, Turmaine M, D'Antonio M, Parkinson DB, Wilton DK, Al-Shawi R, Simons P, Shen J, et al. Notch controls embryonic Schwann cell differentiation, postnatal myelination and adult plasticity. Nat. Neurosci. 2009;12:839–847. doi: 10.1038/nn.2323. [DOI] [PMC free article] [PubMed] [Google Scholar]
- 32.Hendrix ND, Wu R, Kuick R, Schwartz DR, Fearon ER, Cho KR. Fibroblast growth factor 9 has oncogenic activity and is a downstream target of Wnt signaling in ovarian endometrioid adenocarcinomas. Cancer Res. 2006;66:1354–1362. doi: 10.1158/0008-5472.CAN-05-3694. [DOI] [PubMed] [Google Scholar]
- 33.Lum M, Turbic A, Mitrovic B, Turnley AM. Fibroblast growth factor-9 inhibits astrocyte differentiation of adult mouse neural progenitor cells. J. Neurosci. Res. 2009;87:2201–2210. doi: 10.1002/jnr.22047. [DOI] [PubMed] [Google Scholar]
- 34.Grijalva I, Li X, Marcillo A, Salzer JL, Levi AD. Expression of neurotrimin in the normal and injured adult human spinal cord. Spinal Cord. 2006;44:280–286. doi: 10.1038/sj.sc.3101842. [DOI] [PubMed] [Google Scholar]
- 35.Pan Y, Wang KS, Aragam N. NTM and NR3C2 polymorphisms influencing intelligence: family-based association studies. Prog. Neuropsychopharmacol Biol. Psychiatry. 2011;35:154–160. doi: 10.1016/j.pnpbp.2010.10.016. [DOI] [PubMed] [Google Scholar]
- 36.Kimura Y, Katoh A, Kaneko T, Takahama K, Tanaka H. Two members of the IgLON family are expressed in a restricted region of the developing chick brain and neural crest. Dev. Growth Differ. 2001;43:257–263. doi: 10.1046/j.1440-169x.2001.00570.x. [DOI] [PubMed] [Google Scholar]
- 37.Bachelin C, Zujovic V, Buchet D, Mallet J, Baron-Van Evercooren A. Ectopic expression of polysialylated neural cell adhesion molecule in adult macaque Schwann cells promotes their migration and remyelination potential in the central nervous system. Brain. 2010;133:406–420. doi: 10.1093/brain/awp256. [DOI] [PMC free article] [PubMed] [Google Scholar]
Associated Data
This section collects any data citations, data availability statements, or supplementary materials included in this article.


