Abstract
A major fraction of the transcriptome of higher organisms comprised an extensive repertoire of long non-coding RNA (lncRNA) which express in a cell type and development stage-specific manner. While lncRNAs are a proven component of epigenetic gene expression modulation, epigenetic regulation of lncRNA itself remains poorly understood. Here we have analysed pan-genomic DNA methylation and histone modification marks (H3K4me3, H3K9me3, H3K27me3 and H3K36me3) associated with transcription start site (TSS) of lncRNA in four different cell types and three different tissue types representing various cellular stages. We observe that histone marks associated with active transcription H3K4me3 and H3K36me3 along with the repressive histone mark H3K27me3 have similar distribution pattern around TSS irrespective of cell types. Also, the density of these marks correlates well with expression of protein-coding and lncRNA genes. In contrast, the lncRNA genes harbour higher methylation density around TSS than protein-coding genes regardless of their expression status. Furthermore, we found that DNA methylation along with the other repressive histone mark H3K9me3 does not seem to play a role in lncRNA expression. Thus, our observation suggests that epigenetic regulation of lncRNA shares common features with mRNA except the role of DNA methylation which is markedly dissimilar.
INTRODUCTION
The outcome of the ENCODE project and subsequent studies have revealed that majority of eukaryotic transcripts do not code for proteins (1). Such non-coding RNAs (ncRNAs) had been reported previously but were generally accepted to be transcriptional noise and/or experimental artefact (2). However, it has now been established that expression of ncRNA is cell- and developmental stage-specific with strong association between aberrant expression and manifestation of disease condition (3–7). Greater degree of evolutionary complexity has been linked to concomitant increase in ncRNA diversity which suggests that ncRNAs fall under evolutionary selection paradigms and therefore should critically affect cell and hence organism identity (8,9). ncRNAs have diverse functions and are key intermediary in chromatin organization and gene regulation (10–15).
Recent genome-scale transcriptome maps have revealed a significant subset of these transcripts, form a distinct class of ncRNAs, presently known as long non-coding RNAs (lncRNAs). Though the molecular basis of the function of many lncRNAs is just emerging, the present understanding indicates their intricate roles in regulation of a wide variety of biological processes (16). Some of the lncRNAs are conserved in mammals though conservation is not a general rule for this class (17). LncRNAs have been reported to affect chromatin, peripheral to their loci of expression (cis) as well as genomic regions distant from their loci of expression (trans) (18). A large number of mammalian lncRNAs are increasingly being recognized as key regulators of chromatin organization, mediating important biological processes such as X-chromosome inactivation (Xist), imprinting (Kcnq1ot1) and gene expression at transcriptional level (Hotair) (12,19–22). Several lncRNAs modulate chromatin structure by recruiting the polycomb group of proteins to their target sites resulting in Histone3 lysine27 methylation-induced silencing (23). Although a huge number of lncRNAs have been identified in genome-wide transcriptome analysis, little is known regarding the spatio-temporal regulation of lncRNA expression (24).
Considering that lncRNAs have the potential to regulate the chromatin state, the transcription of lncRNAs itself must be tightly regulated. Similar to protein-coding genes, most lncRNAs are transcribed by RNA pol II and have typical hallmarks of pol II transcribed products like 5′ Cap and poly A tail (25). Further Pol II-mediated gene expression is known to be regulated by epigenetic mechanisms like DNA and histone modifications (26). Also, since many lncRNAs are expressed in cell type/tissue- and developmental stage-specific manner, it is extremely likely that their own expression is epigenetically monitored (27).
Epigenetic mechanisms regulating expression of protein-coding genes are well characterized. Promoter hypomethylation and histone modifications (like H3K4me3, H3K27me3, H3K9me3 and H3K36me3) are some of the epigenetic marks that are understood to be the key regulators of mRNA expression. However, unlike the protein-coding genes, a systematic analysis of these epigenetic features in lncRNA genes has not yet been undertaken. Although there are a few reports that have described epigenetic regulation in specific lncRNAs, studies of the epigenetic patterns at a global scale especially in and around the transcription start site (TSS) of lncRNA genes are scarce (28,29).
Therefore, in this study we performed genome-wide analysis of the distribution of DNA methylation and histone modifications like H3K4me3, H3K9me3, H3K27me3 and H3K36me3 across the TSS of all known lncRNA genes in different cell and tissue types. To assess the effect of these chromatin modifications on gene expression, we analysed the gene expression data of brain tissue and H1 cells where the data were available. Our results suggest that lncRNA shave histone marks associated with active transcription in a manner similar to that of the protein-coding genes, while they differ in the repressive marks like DNA methylation and H3K9me3 histone modification.
MATERIALS AND METHODS
Human genome and annotations
We used the human genome hg19 build (http://www.ncbi.nlm.nih.gov/projects/genome/guide/human/index.shtml) from the University of California Santa Cruz Genome Bioinformatics Site (http://genome.ucsc.edu) which was used as the reference for mapping raw reads (30). RefSeq genes (in total 40 845, of which 30 623 were similarly retrieved from the site and only unique entries were used for analysis), CpG island (CGI) positions (28 691) and ORegAnno (http://genome.ucsc.edu) (23 089) datasets were similarly retrieved from the UCSC Genome Browser for the same build of the human genome. Datasets for cytosine methylation were retrieved from methylated DNA immunoprecipitation sequencing (MeDIPSeq) experiments for four different sets, namely, H1 human embryonic stem cells (H1), tissue from germinal centre of human brain (Brain Gr) and IMR90 embryonic lung fibroblast cells from NIH Roadmap Epigenomics project (31). Another set of MeDIP data for the tissue from frontal cortex region of human brain (Brain Fr) was downloaded from NCBI-SRA. The raw data for transcriptome sequencing (mRNA seq) and histone modification (H3K4me3) for H1 cells and Brain cortical tissue were similarly retrieved from NIH Roadmap Epigenomics project and NCBI-SRA, respectively. The data for histone modifications (H3K4me3, H3K9me3, H3K27me3 and H3K36me3) of four different cell types (H1, IMR90, CD34 primary cells and peripheral blood mononucleocytes) and two different tissue types were downloaded from NIH Roadmap Epigenomics project. For peripheral blood mononuclear cells (PBMCs), H3K4me3 data were not available and therefore we have downloaded H3K4me1 data and have performed the analysed with this dataset. The genome coordinates of the lncRNA genes (11004) and protein-coding genes (20 012) were obtained from the Gencode website and Ensembl genome browsers, respectively (32,33).
Read mapping and annotation of features
The raw reads of MeDIPseq dataset downloaded for H1 cells and brain cortical tissue, were mapped onto the human genome reference sequence (hg19 build) using the Burrows–Wheeler Alignment Tool algorithm on default parameters (34). For annotation and transcript quantification of RNA-seq data of H1cells and brain cortical tissue, we used a pipeline comprising Tophat (1.3.3) and Cufflinks (1.2.0). The rest of the data used were downloaded in the aligned format from the source mentioned above (35,36).
Analysis of MeDIP datasets
We used Model-based Analysis for ChIP-Seq (MACS) (version 1.4.0 beta) for peak detection and analysis of immunoprecipitated sequencing data to find genomic regions that are enriched in a pool of specifically precipitated DNA fragments (37). MACS was run on default parameters on aligned files of methylation data (H1 cells, PBMCs, brain germinal and cortical tissues), histone modification datasets (H1 cells, IMR90 cells, PBMCs, CD34 primary cells, liver tissue and brain germinal centre tissue) and enriched peaks were generated (Supplementary Table S1).
In-depth analysis and data integration
In-depth analysis, data integration and comparison were performed using custom scripts written in Perl. The methylation peak summit files generated by MACS were then used for further downstream analysis. Summit peak files of methylation data and histone data were used for looking at their differential pattern across TSS of protein-coding and lncRNA genes. An enriched gene file generated by Tophat (1.3.3) and Cufflinks (1.2.0) was used for classifying genes. We used an empirical cutoff of 1 SD from the mean to classify genes as high and low expressed. Comparison of the various marks across the TSS of protein-coding and lncRNA genes was performed using custom scripts.
For finding the co-occurrence of one or more of the epigenetic marks (methylation and histone modification marks) at the TSS of lncRNA and protein-coding regions, we calculated the number of these events falling in the ±2 kb of TSS in both cell types. To plot the data we have used Venny (http://bioinfogp.cnb.csic.es/tools/venny/index.html).
RESULTS
Distinct patterns of DNA methylation across TSS of protein-coding and lncRNA genes
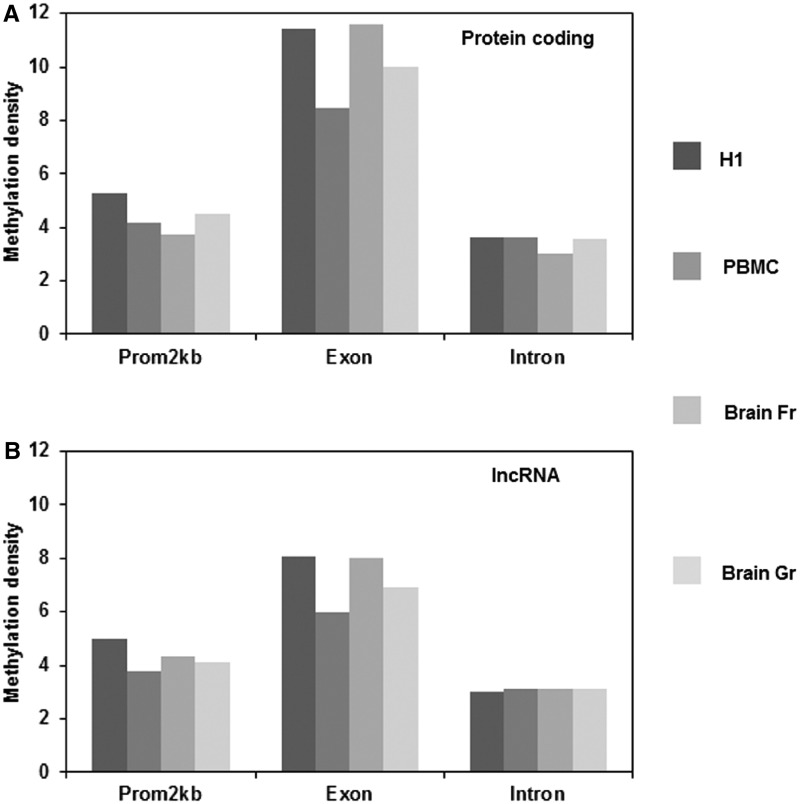
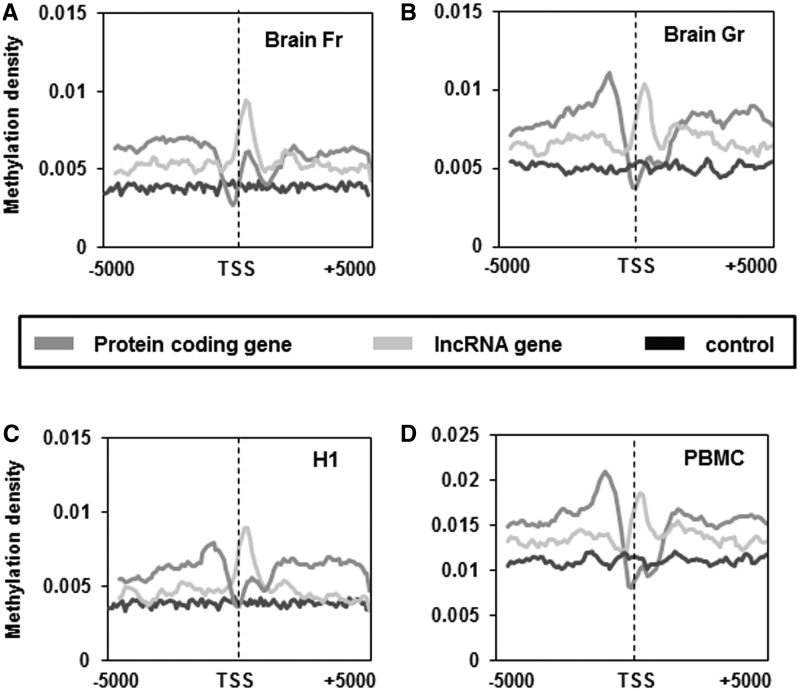
Expression of ncRNAs and differential methylation marks are both components of the tissue differentiation machinery. The methylation architecture in and around the protein-coding genes affects their expression and hence influence cell identity (38). However, the role of DNA methylation in the regulation of lncRNA genes remains unclear. We first compared the average methylation density within exon, introns and promoters (2-kb upstream of TSS) of lncRNA and protein-coding genes from H1 cell line, PBMCs, brain cortical tissue and brain germinal matrix tissue. We found that the methylation density within these regions was similar—with exons having higher methylation density than introns or promoters (Figure 1A and B). However, the methylation density around TSS was markedly different between lncRNA and protein-coding genes in all the cell and tissue types studied (Figure 2A–D). The average methylation density around the TSS of protein-coding genes showed a V-shaped curve indicative of low methylation levels (Figure 2A–D), which is in concordance with earlier reports (39,40). Contrary to the pattern of methylation across TSS of protein-coding genes, we did not find the characteristic dip in methylation density at TSS in lncRNA. Rather we found an increased methylation density with a sharp peak immediately downstream of the TSS, in the region of first exon in lncRNA genes (Figure 2A–D). This suggests a differential pattern of methylation across the TSS of lncRNAs vis-a-vis protein-coding genes which might be due to a potential difference in gene regulation across these loci. Alternately, the difference in methylation pattern could also be due to partial overlap of some of the lncRNAs with exons of protein-coding genes since previously we and others have demonstrated that exons of protein-coding genes (coding exons) harbour a higher methylation density compared to introns and untranslated regions (39,41,42). To rule out this possibility, methylation density of lncRNAs that fall within protein-coding genes (∼4000) and those that lie 1 kb up- or downstream of the protein-coding genes (∼7000) were separately analysed. In both the cases we found that the methylation patterns were consistent with the initial analysis of the superset in all the cases (Supplementary Figure S1).
Figure 1.
Methylation density within promoter, exons and introns was calculated by dividing the methylation peak summit count in that region by the area of that region. (A) The methylation density in the different bins of protein-coding genes in H1 cell, PBMCs, brain frontal cortex (Fr) and brain germinal matrix tissue (Gr). (B) The methylation density in the different bins of lncRNA genes in H1 cell, PBMCs, brain frontal cortex (Fr) and brain germinal matrix tissue (Gr).
Figure 2.
Methylation pattern around TSS. Distribution of methylation peak summit count in 100-bp continuous window, 5-kb upstream and downstream from the start site was calculated for all protein-coding genes and lncRNA genes in brain frontal cortex (A), brain germinal matrix tissue (B), H1 cell (C) and PBMCs (D). Count was normalized by dividing individual count with total number of genes in that category. The plots obtained were further smoothened by taking a moving average of 5.
To investigate the potential effect of such distinct TSS methylation pattern on the transcription of lncRNA genes, we analysed the RNA sequencing data from H1cells and brain frontal cortex tissue. For this, we downloaded the data from NCBI-Sequence Read Archive and processed it through Tophat and Cufflink pipelines for RNA-seq analysis. We considered all transcripts with significant Fragment Per Kilobase of exon Model per million mapped fragments (FPKM) values. Genes that had expression levels greater or lower than 1 SD from the mean were considered to be highly or lowly expressed, respectively (Supplementary Table S1). From this analysis we found that there were 3532 and 4624 highly expressed protein-coding genes in H1 cells and brain cortical tissue, respectively, while 1839 and 1415 protein-coding genes were found to be lowly expressed in H1 cells and brain cortical tissue, respectively. Similarly there were 119 and 171 highly expressed lncRNAs in H1 cells and brain cortical tissue, respectively, while 2938 and 3665 lncRNAs were found to be lowly expressed in H1 cells and brain cortical tissue respectively.
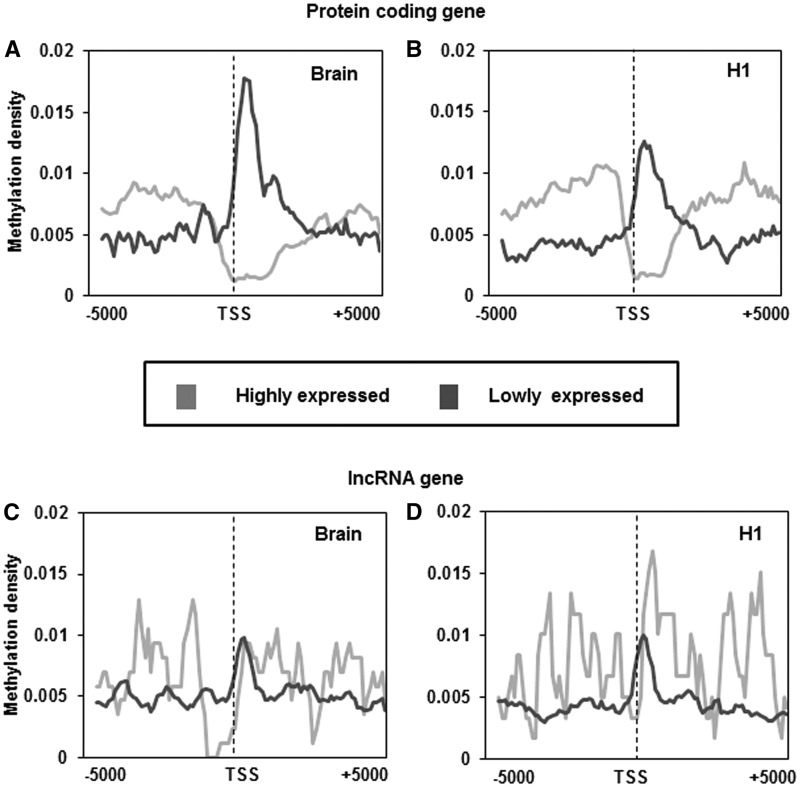
As expected we found a dip in the methylation density at the TSS of highly expressed protein-coding genes in both H1 cells and brain cortical tissue (Figure 3A and B). However, this dip in methylation at TSS was absent for protein-coding genes that were lowly expressed in H1 cells and brain cortical tissue (Figure 3A and B). Interestingly, in these lowly expressed protein-coding genes we observed high methylation density immediately downstream of TSS (Figure 3A and B). Highly expressed lncRNAs, in brain cortical tissue but not in H1 cells (119), had lower levels of methylation upstream of TSS (∼1 kb). However, in both datasets highly expressed lncRNAs exhibit sharp increase in methylation density immediately downstream of TSS (Figure 3C and D). On the other hand, the methylation pattern of lowly expressed lncRNAs of H1 cells and brain cortical tissue was similar to the pattern exhibited in lowly expressed mRNAs with a sharp peak immediately downstream of the TSS (Figure 3C and D). The increased methylation density immediately downstream of TSS was a feature associated with lncRNA (both highly and lowly expressed) and lowly expressed protein-coding genes. These observations suggest that, irrespective of their expression status, lncRNA seems to have elevated methylation density downstream of their TSS.
Figure 3.
Association of average methylation density around TSS with gene expression. (A and B) represents the methylation density around TSS of highly and lowly expressed protein-coding genes in brain tissue and H1 cell line. (C and D) represents the methylation density around TSS of highly and lowly expressed lncRNA genes in brain tissue and H1 cell line. Peak summit count in 100-bp continuous window was normalized by dividing count with total number of genes in that category. The plots were further smoothened by taking a moving average of 5.
Distribution of histone modification marks across TSS of protein-coding and lncRNA genes
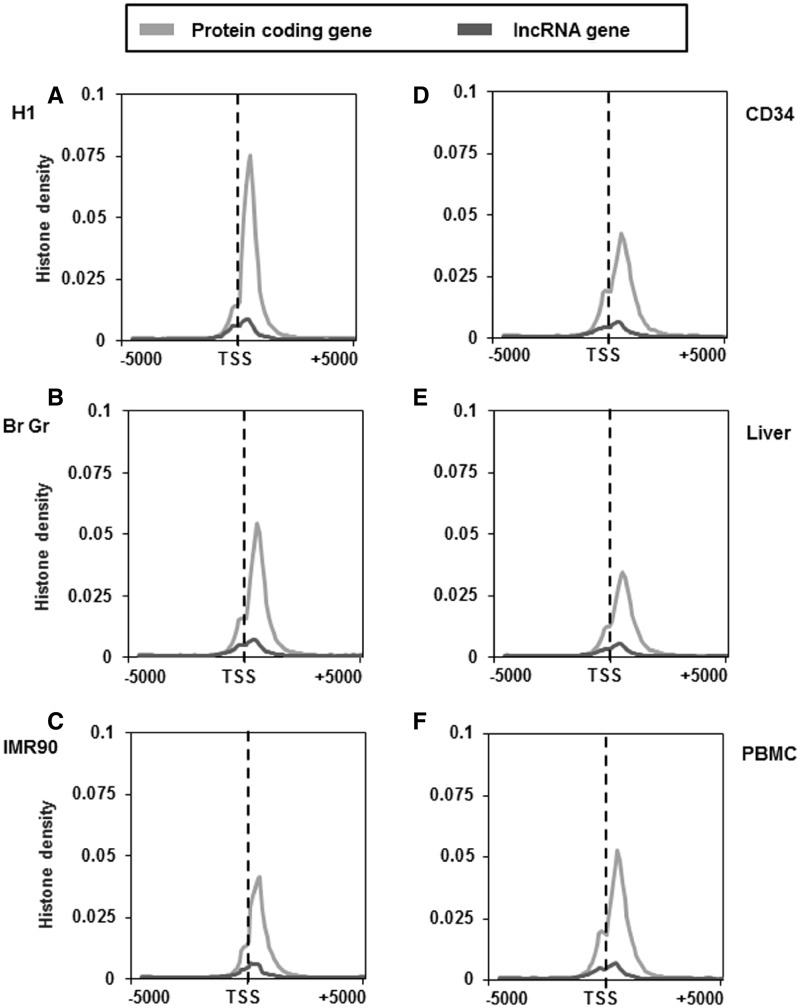
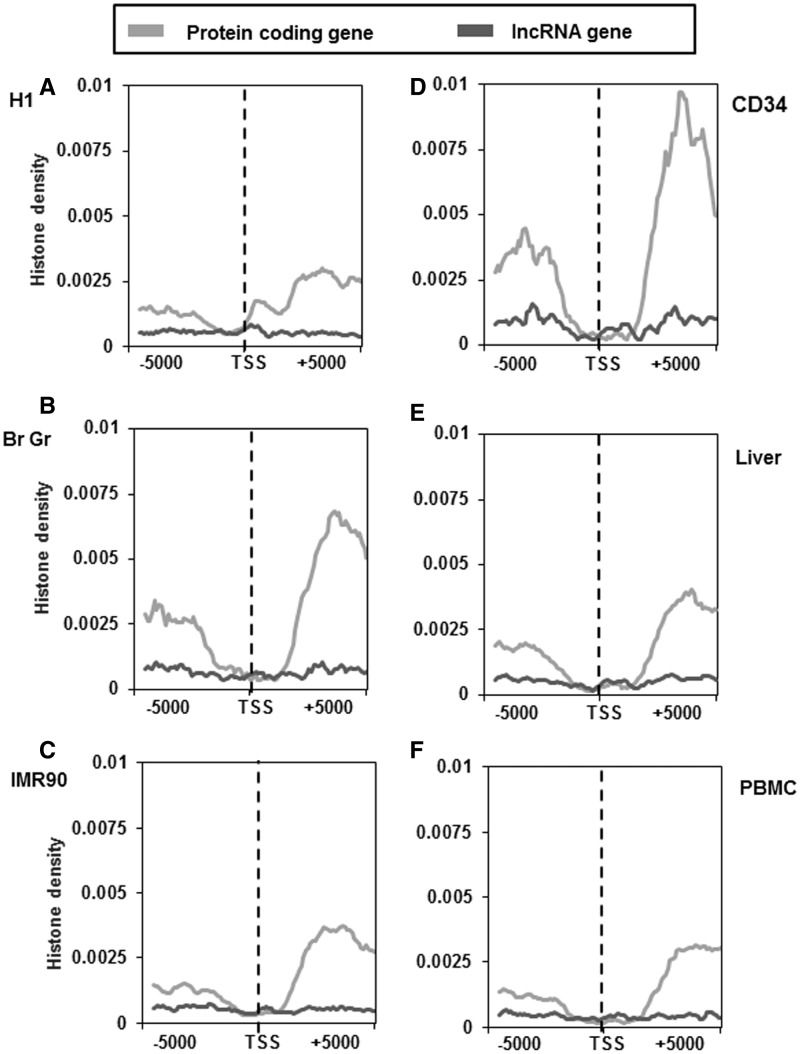
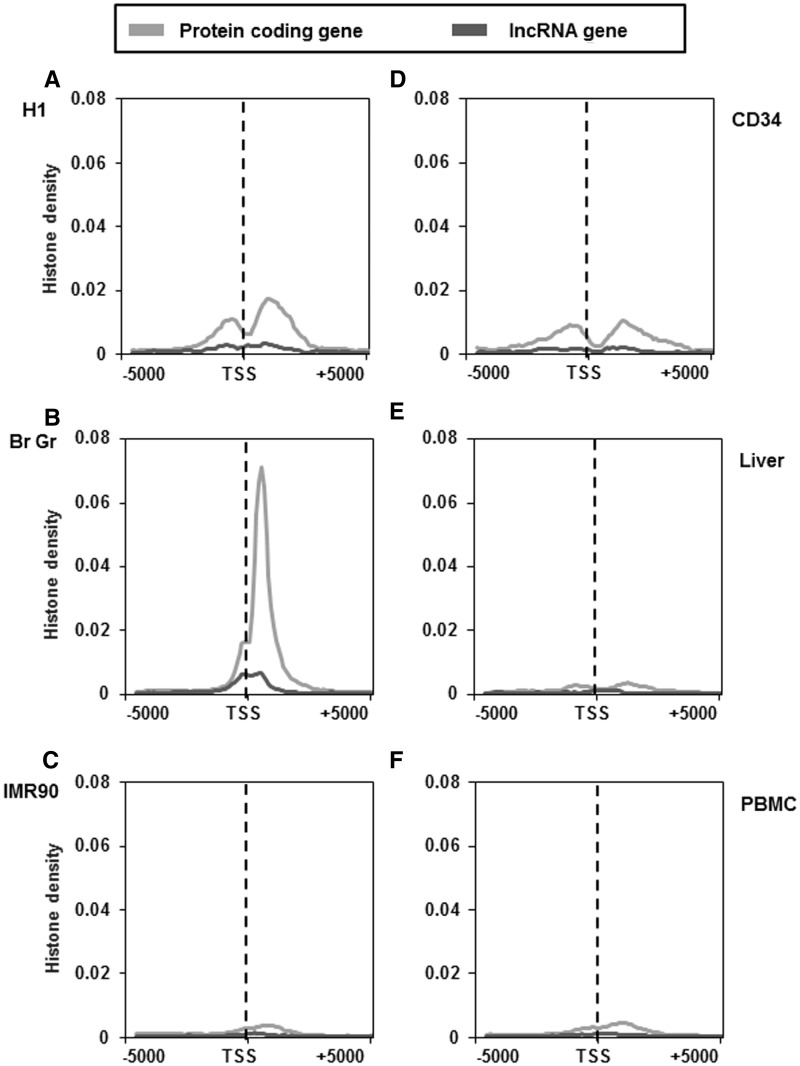
Histone modifications like H3K4me3 and H3K27me3/H3K9me3 are known to be associated with active and inactive promoters of protein-coding genes, respectively. Another feature associated with protein-coding genes is the association of the transcription coupled chromatin mark H3K36me3 within the gene body of active genes. We thus examined the distribution of these marks ∼5 kb of TSS of lncRNA and protein-coding genes to include H3K36me3 marks also. As mentioned earlier this analysis was performed in four different cell types (H1, IMR90, CD34 and PBMC) and two tissue types (brain germinal matrix and liver).The pattern of H3K4me3 distribution surrounding the TSS of lncRNAs was found to be similar with that of protein-coding genes around the TSS. However, the density of this mark in lncRNA was considerably lower in all cell or tissue types analysed (Figure 4A–F). The difference in the H3K4me3 density between lncRNA and protein-coding genes was more pronounced in H1 cell line when compared with other cell and tissue types (Figure 4A). Another mark that is known to be associated with actively transcribed regions (gene body–exons) is H3K36me3 modification. We found that the downstream region of TSS of protein-coding genes consists of elevated H3K36me3 signals, irrespective of the cell or tissue type (Figure 5A–F). In contrast, lncRNA genes do not show any enrichment of H3K36me3 histone modification across all the studied cell and tissue types (Figure 5A–F).
Figure 4.
Distribution of H3K4me3 marks across the TSS of protein-coding and lncRNA genes in different cell and tissue types. H3K4me3 distribution ∼5 kb up and downstream of TSS of protein-coding and lncRNA genes of H1 cells (A), brain germinal matrix tissue (B), IMR 90 cells (C), CD34 cells (D), liver tissue (E) and PBMCs (F). Count was normalized by dividing individual count with total number of genes in that category. The plots obtained were further smoothened by taking a moving average of 5.
Figure 5.
Distribution of H3K36me3 marks across the TSS of protein-coding and lncRNA genes in different cell and tissue types. H3K36me3 distribution ∼5-kb up and downstream of TSS of protein-coding and lncRNA genes of H1 cells (A), brain germinal matrix tissue (B), IMR 90 cells (C), CD34 cells (D), liver tissue (E) and PBMCs (F). Count was normalized by dividing individual count with total number of genes in that category. The plots obtained were further smoothened by taking a moving average of 5.
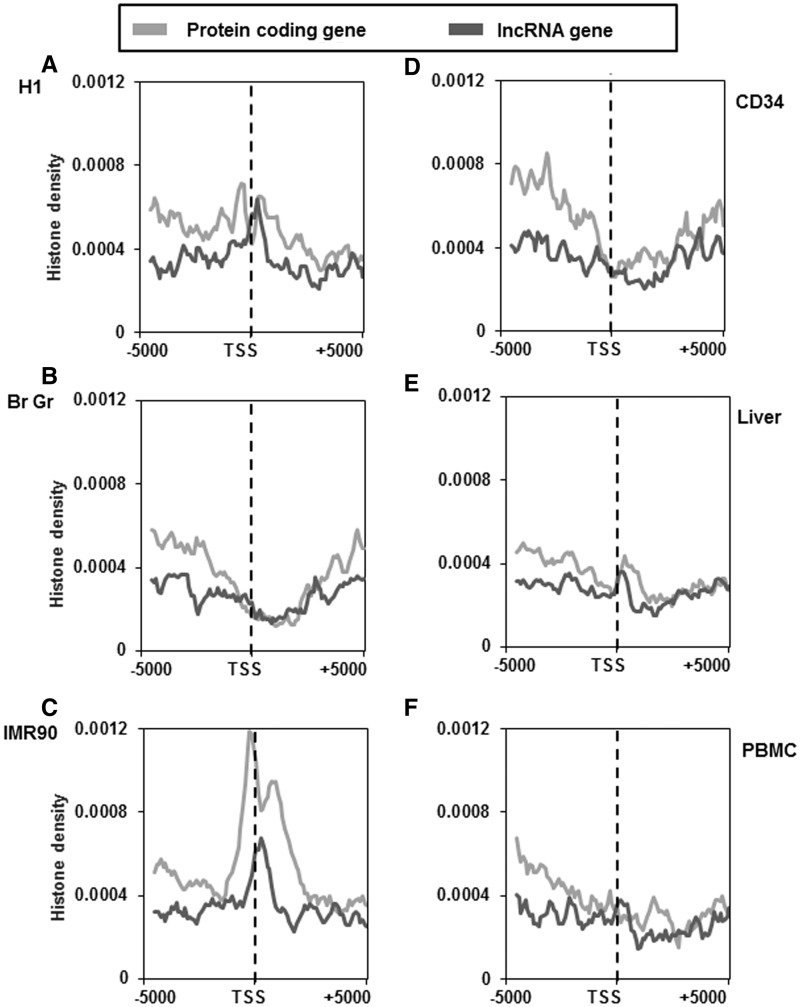
The repressive mark H3K27me3 showed a tissue-specific distribution pattern around the TSS with, PBMCs, IMR90 cells, CD34 cells and liver tissue showing very low levels of H3K27me3 at the TSS of mRNA as well as lncRNA genes (Figure 6C, D, E and F). In protein-coding genes of brain germinal matrix tissue, there was a sharp increase in H3K27me3 density around TSS while in H1 cells it was considerably lower than brain germinal tissue (Figure 6A and B). It was also observed that lncRNA genes harbour lower levels of H3K27me3 modification than protein-coding genes in all the datasets (Figure 6A–F).
Figure 6.
Distribution of H3K27me3 marks across the TSS of protein-coding and lncRNA genes in different cell and tissue types. H3K27me3 distribution ∼5-kb up and downstream of TSS of protein-coding and lncRNA genes of H1 cells (A), brain germinal matrix tissue (B), IMR 90 cells (C), CD34 cells (D), liver tissue (E) and PBMCs (F). Count was normalized by dividing individual count with total number of genes in that category. The plots obtained were further smoothened by taking a moving average of 5.
In the case of H3K9me3 modification, which has also been implicated in heterochromatin formation, we found that the density of the modification was in general low across the sample sets studied. In IMR90 and PBMC the density of this modification was higher than the rest (Figure 7A–F). Furthermore, there was no fixed pattern of distribution of H3K9me3 modification among the cell or tissue type in protein-coding and lncRNA genes.
Figure 7.
Distribution of H3K9me3 marks across the TSS of protein-coding and lncRNA genes in different cell and tissue types. H3K9me3 distribution ∼5-kb up and downstream of TSS of protein-coding and lncRNA genes of H1 cells (A), brain germinal matrix tissue (B), IMR 90 cells (C), CD34 cells (D), liver tissue (E) and PBMCs (F). Count was normalized by dividing individual count with total number of genes in that category. The plots obtained were further smoothened by taking a moving average of 5.
To further assess the effect of these modifications on the transcription, we analysed the gene expression profiles of H1 cells since this is the only sample for which the expression data were available. We found that highly expressed protein-coding and lncRNA genes were enriched for H3K4me3 and H3K36me3 modification than lowly expressed genes (Supplementary Figure S2A–D). However, the TSS of highly expressed mRNA had very low presence of H3K27me3 mark while the TSS of lowly expressed mRNA exhibited markedly elevated levels of H3K27me3 (Supplementary Figure S2E and F). Similarly, TSS of lowly expressed lncRNAs harbour elevated H3K27me3 levels, albeit at levels far lower than their protein-coding counterparts. TSS of highly expressed lncRNA exhibited a total absence of H3K27me3 mark in their immediate vicinity (Supplementary Figure S2E and F). In the case of the other repressive histone mark H3K9me3, highly expressed protein-coding genes exhibit a fall in H3K9me3 levels immediately upstream of the TSS (Supplementary Figure S2G and H). In contrast, the TSS of lowly expressed protein-coding regions had a sharp increase in H3K9me3 levels around the TSS. In contrast, in lncRNA genes, the TSS exhibited high levels of H3K9me3 irrespective of expression status (Supplementary Figure S2G and H).
The lncRNA genes (11 004) downloaded from Gencode v9 comprise four sub-categories, namely, lincRNAs (5890 genes), antisense (3588 genes), processed transcripts (1117 genes) and sense intronic transcripts (409 genes). It is a well-known fact that lincRNAs are marked by H3K4me3 and H3K36me3 modifications that lie outside mRNA genes. We also individually analysed all the four sub-categories of lncRNAs included in our study to ascertain if H3K4me3 and H3K36me3 marks observed were solely due to lincRNA. We found that sense intronic which has very few entries all other sub-categories has similar distribution of histone marks around the TSS (Supplementary Figure S3A and B).
Association of epigenetic marks with CGIs present around TSS lncRNA genes
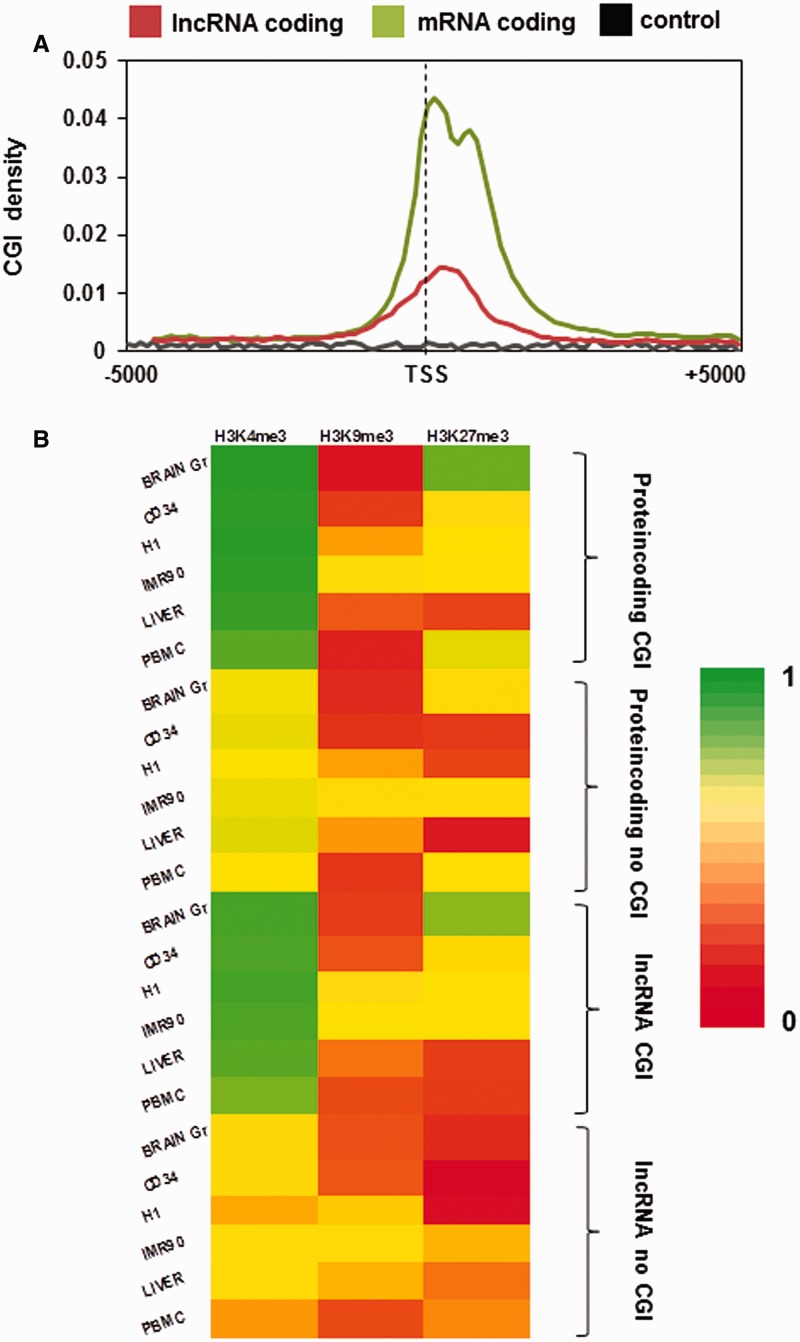
Several studies have shown that there is a strong correlation between CGIs and transcription initiation (43). We thus plotted the CGI density ∼5 kb up- and downstream of the TSS of lncRNA to assess if the promoters of lncRNA genes are also rich in CGI. We found that although the CGI density is high at the TSS of lncRNA compared to random regions, it was considerably lower than the CGI density at the TSS of protein-coding genes (Figure 8A). Furthermore, CGIs are frequently associated with H3K4me3 marks, which itself is a signature of active promoters (43). Thus, we looked for the histone modifications associated with the CGI at the TSS of protein-coding and lncRNA genes. For this purpose we made four classes, namely, protein-coding genes with or without CGI and lncRNA genes with or without CGI, based on the presence of CGI in ±2 kb of TSS of the genes. After sorting the genes into these classes we mapped the location of H3K4me3, H3K9me3 and H3K27me3 modifications at ±2 kb of TSS of these regions across all four cell and two tissue types. The count in each class was normalized to the total number of entries in that class (Figure 8B and Supplementary Table S2).
Figure 8.
Association between CGI and histone modifications around the TSS of protein-coding and lncRNA genes. (A) Distribution of CGI across the TSS of protein-coding and lncRNA genes. (B) Distribution of the H3K4me3, H3K9me3 and H3K27me3 mark density across the CGI present at the TSS of protein-coding and lncRNA genes.
H3K4me3 marks are enriched in both protein-coding and lncRNA genes having CGI while it is low in similar regions lacking CGI irrespective of the cell or tissue type. H3K9me3 mark showed no enrichment with any class in any cell or tissue types. H3K27me3 on the other hand showed higher density in brain germinal matrix tissue in both protein-coding and lncRNA genes having CGI, while the rest of the sample set showed no enrichment with CGI for both protein-coding and lncRNA genes (Figure 8B).
Since the start sites of genes are known to be enriched for various cis regulatory regions, we looked at the distribution of regulatory sites present in ORegAnno database (database of regulatory sites from UCSC) around the TSS of protein-coding and lncRNA genes. Here also we found that the start sites of the lncRNA genes were enriched for known regulatory motifs but to an extent lesser than protein-coding genes (Supplementary Figure S4).
Global analysis of histone marks across TSSs of protein-coding and lncRNA genes
We mapped the histone distribution ∼2 kb up- or downstream of the TSS of protein-coding and lncRNA genes. The percentage occupancy of each modification for both the classes of genes was calculated by normalizing each data count to the total number of entries in that category. We found that overall occupancy of these histone marks ∼2 kb up or downstream of the TSS of protein-coding genes in a particular tissue/cell type falls between 65% and 73%, while in lncRNA genes the same ranges around 27–38% (Supplementary Table S3). Furthermore, when DNA methylation is also taken into account the count of epigenetically marked protein-coding genes increases to >75% in case of H1 cells, PBMCs and brain germinal matrix tissue. Similarly, for these samples, the count of epigenetically marked lncRNA genes rises to >43% on inclusion of DNA methylation. Evaluation of the density of individual marks in this window revealed that >50% of protein-coding genes have H3K4me3 mark in all cell/tissue types. In lncRNA genes also, the occupancy of this marks was high, ∼23% across all cell and tissue types (except PBMC—17%). Another known transcription activating mark H3K36me3 showed very low occupancy around TSS (>10%) in all cell/tissue types, in both the protein-coding and lncRNA genes (Supplementary Table S3). In case of repressive histone marks, no general pattern was observed. Instead, there were variations in promoter occupancy across all cell and tissue types for both protein-coding and lncRNA genes (Supplementary Table S3). We further analysed the possibility of synergy between the aforesaid histone marks and evaluated the coexistence of two or more of these histone modifications at 2 kb up- or downstream of TSS of mRNA and lncRNA genes (Supplementary File S1). Among the various combinations we found that presence of H3K4me3 and H3K27me3 marks, which are classically known as bivalent domains, was more prominent than other combinations in all studied cell and tissue types. In all the cell and tissue types studied, except brain germinal tissue, we observe that the percentage of mRNA genes having these bivalent marks vary from 1% to 10%, the lowest being in liver tissue. In the lncRNA genes it varies from 0.4% to 3.2% with liver being the lowest in this case also. However, brain germinal matrix tissue exhibits exceptionally higher percentage of bivalent marks in both mRNA (∼41.5%) and lncRNA (12.6%) genes.
Since this study was based on data generated by various laboratories, we checked the robustness of the data by mapping the epigenetic marks around TSS of a few regions including housekeeping genes and some lncRNA genes. A similar pattern of the distribution of these epigenetic modifications across the cell and tissue types under investigation gave us confidence on the robustness of the data (Supplemental File S2). Further, the MeDIP methylation dataset used from brain cortical region was validated by the same group using targeted bisulphite sequencing method (44).
DISCUSSION
Recent advances in high-throughput sequencing technologies have revealed that >90% of the human genome is transcribed, of which only 1–2% accounts directly for protein synthesis (45). It is increasingly evident, in humans and other organisms, that the transcriptome is significantly more complex than previously supposed RNA having a much broader influence over manifested phenotype than implied solely by its role as messenger. Epigenetic mechanisms like cytosine methylation and histone modifications are known to influence gene expression. While aberrations of the epigenome have been found to be associated with several human diseases and disorders, there have been increasing reports associating aberrant lncRNA expression with cancer, cardiovascular disorders and other maladies (46,47). However, association of epigenomic features like cytosine methylation and histone modifications with lncRNA genes has not been studied at the genome-wide level.
In the present report we have tried to draw a global picture of epigenetic marks across lncRNA loci in human. The epigenetic marks studied here include histone modifications and DNA methylation, which have been extensively studied recently with relation to regulation of protein-coding genes. We performed a comprehensive analysis of DNA methylation, H3K27me3 and H3K9me3 as representative repressive marks, which have been known to be associated with chromatin repression and H3K4me3 and H3K36me3 which are representative expression-associated marks. The complete raw datasets covering the transcription repressive and activating marks were obtained from the NCBI repository. Datasets that are still under embargo could not be included in the analysis (Supplementary Table S4). In addition, we have not included datasets from in vitro differentiated, stem-cell-derived and transformed cell types since they are likely to have altered epigenetic profile (48). Of the remaining cell types, we chose H1 as a representative of pluripotent embryonic stem cell, primary CD34+ as representative of multipotent haematopoietic cell, IMR90 (foetal lung fibroblast) and PBMC as representative differentiated cell types. In addition, we have chosen two tissue types, brain and liver, which represent two organs having distinct physiological roles and germinal origin (brain being ectodermic and liver mesoendodermic). Similarities in epigenetic signatures between these two tissues should reflect the global schema for distribution of epigenetic marks. Thus, our study involving such disparate cases of cell fate and identity allowed us to derive conclusions regarding the distribution of epigenetic marks in general regardless of cellular differentiation status.
DNA methylation is an important evolutionarily conserved epigenetic mark (49). It is known that the TSS of expressed protein-coding genes is hypomethylated and is in agreement with earlier observations that the methylation density of highly expressed protein-coding genes was lowest at their TSS and remained low even downstream of the TSS (39). In contrast to the methylation pattern around TSS in highly expressed protein-coding genes, our results indicate that in lowly expressed protein-coding genes, the methylation density showed an upward trend from TSS and was highest immediately downstream of TSS in the region of first exons. This is consistent with earlier studies where it has been shown that DNA methylation in the immediate downstream regions of TSS, i.e. in the first exon, was much more tightly linked to gene silencing than promoter methylation (50). However, in lncRNA the methylation density is high in the downstream region of TSS, irrespective of their expression levels. Thus, unlike protein-coding genes, methylation downstream of TSS (in the first exon) is not a feature of lncRNA silencing suggesting that other factors might also be associated with lncRNA gene regulation.
Another evolutionarily conserved feature of TSS of protein-coding genes is their association with CGI (43). About half of all CGIs contain TSSs of annotated protein-coding genes (43). The others are classified as ‘orphan’ CGIs. The purpose of such orphan CGIs is poorly understood (51). Several genome-wide Pol II mapping studies have revealed that a majority of these sites are also transcription initiation sites. Some of these lncRNAs like Air and Kcnq1ot1 have also been shown to be initiated from such ‘orphan’ CGIs present in intron of the Igf2r and Kcnq1 genes, respectively (52–54). From our analysis we found an overlap of CGIs with the TSS in ∼24% of lncRNA genes and by inductive reasoning we feel that such orphan CGIs might be the transcription initiation sites of other ncRNAs as well. CGI distribution within the genome is often concurrent with H3K4me3 mark (55,56). It is a well-accepted paradigm that DNA methylation corresponds to repressive chromatin while H3K4me3 are associated with transcriptionally active chromatin (57,58). From our analysis we show that occurrence of H3K4me3 marks in mRNA and lncRNA genes were higher when CGI was present, while the frequency decreases in the absence of CGI. This suggests that CGI of lncRNA are also marked by H3K4me3. However, when we looked at the association of repressive histone marks H3K27me3 and H3K9me3 with CGI present at the lncRNA and protein-coding genes, we did not find any relationship with the exception of brain germinal matrix tissue (in H3K27me3 class). We also found that ∼40% TSS of protein-coding genes and ∼12% TSS of lncRNA genes in brain germinal matrix tissue were having both H3K4me3 and H3K27me3 marks.
We also analysed histone modifications associated with active (H3K4me3 and H3K36me3) and repressed (H3K9me3 and H3K27me3) chromatin. The distribution pattern of H3K4me3 across cell and tissue type for both protein-coding and lncRNA showed a similar pattern with increased density at the TSS. Furthermore, presence of H3K4me3 and H3K36me3 modifications in the TSS and gene body, respectively, corresponded to higher expression of both protein-coding and lncRNA genes. This suggests that unlike the repressive methylation marks, presence of these transcription activating marks could better explain the regulation of lncRNA expression.
H3K27me3 seems to play similar roles in the expression of lncRNA and mRNA expression as the highly expressed transcripts of both classes seems to lack this mark at their TSS in contrast to higher occupancy of this repressive mark in the lowly expressed transcripts. This is consistent with a previous report suggesting that lncRNAs that are expressed at lower levels have higher H3K27me3 at their promoters. However, unlike H3K27me3, the repressive mark H3K9me3 does not seem to dictate the repression in lncRNA class as the highly expressed lncRNA also had its presence at their TSS in contrast to protein-coding genes which showed inverse correlation of expression in presence of this repressive mark.
Furthermore, H3K4me3 and H3K27me3 are known to co-occupy certain genomic regions known as bivalent domains, which are associated with the promoters of lineage regulatory genes. We observed that occurrence of these bivalent marks (H3K4me3 and H3K27me3) was maximum in brain germinal matrix tissue: 41% in mRNA genes and 12% in lncRNA genes. Brain germinal matrix tissue is a proliferative centre which is source of neurons and glials cells. In all other datasets analysed, the occupancy was between 1% and 10% for mRNA genes and 0.4–3.2% for lncRNA genes. H1 embryonic stem cells had 8.8% mRNA genes and 3.2% lncRNA genes occupied by bivalent marks. It is well known that lineage-related genes have bivalent marks in pluripotent stem cells. The role of such bivalent marks is generally believed to silence (H3K27me3) developmental lineage-specific genes while on the other hand poise them for subsequent activation via H3K4me3 during differentiation process. However, a recent study by Gobbi et al. suggests that the relation between the presence of bivalent marks in genes and their subsequent expression during differentiation may be oversimplistic (59). They found that genes that have bivalent marks in pluripotent and multipotent cells may be expressed at low levels during lineage priming. However, further studies are necessary to understand the implications of these bivalent marks in regulation of lineage-specific genes.
Epigenetic marks like DNA methylation and histone modifications regulate the expression of genetic message and therefore determine cellular and hence organism’s identity. LncRNAs are also involved in the manifestation of cellular identity; however, epigenetic marks governing their expression are not well characterized. We have found that a large proportion of lncRNA genes lack any of the aforesaid epigenetic marks. However, where present, they show a distribution pattern akin to that of protein-coding genes with the exception of DNA methylation. However, the distribution pattern of epigenetic features does not differ significantly for stem cells, differentiated cells and the tissue used, which indicates that the general behaviour of these processes remains unchanged regardless of differentiation and proliferative status.
Thus, our observations show that DNA methylation pattern at immediate vicinity of TSS is remarkably dissimilar for lncRNA and protein-coding genes. Furthermore, the histone marks, H3K4me3 and H3K36me3 and H3K27me3, correlate with the expression of lncRNA in a manner similar to that of mRNA. However, the repressive marks DNA methylation and H3K9me3 histone marks do not seem to be involved in the expression of lncRNAs.
SUPPLEMENTARY DATA
Supplementary Data are available at NAR Online: Supplementary Tables 1–4, Supplementary Figures 1–4 and Supplementary file 1–2.
FUNDING
Council of Scientific and Industrial Research (CSIR) project, HCP004 (Multi-agent Therapy of Cancer: a Systems Biology Approach). Funding for open access charge: CSIR project code HCP004.
Conflict of interest statement. None declared.
Supplementary Material
ACKNOWLEDGEMENTS
The authors thank Dr Souvik Maiti and Dr Beena Pillai for their valuable suggestions. The Computational analysis was performed at the CSIR centre for in silico Biology at IGIB. They also acknowledge the NIH Roadmap to Epigenomics Consortium members for producing the data used in our analysis producers. They are also thankful to NIH Roadmap to Epigenomics Consortium for maintaining an open access to the datasets deposited in NIH Roadmap Epigenomics Project Data Listings at http://nihroadmap.nih.gov/epigenomics/.
REFERENCES
- 1.Zhou H, Hu H, Lai M. Non-coding RNAs and their epigenetic regulatory mechanisms. Biol. Cell Under Auspices Eur Cell Biol. Organizat. 2010;102:645–655. doi: 10.1042/BC20100029. [DOI] [PubMed] [Google Scholar]
- 2.Huttenhofer A, Vogel J. Experimental approaches to identify non-coding RNAs. Nucleic Acids Res. 2006;34:635–646. doi: 10.1093/nar/gkj469. [DOI] [PMC free article] [PubMed] [Google Scholar]
- 3.Lee TL, Pang AL, Rennert OM, Chan WY. Genomic landscape of developing male germ cells. Birth Defects Res. C Embryo Today Rev. 2009;87:43–63. doi: 10.1002/bdrc.20147. [DOI] [PMC free article] [PubMed] [Google Scholar]
- 4.Amaral PP, Mattick JS. Noncoding RNA in development. Mamm. Genome Off. J. Int. Mamm. Genome Soc. 2008;19:454–492. doi: 10.1007/s00335-008-9136-7. [DOI] [PubMed] [Google Scholar]
- 5.Dinger ME, Amaral PP, Mercer TR, Pang KC, Bruce SJ, Gardiner BB, Askarian-Amiri ME, Ru K, Solda G, Simons C, et al. Long noncoding RNAs in mouse embryonic stem cell pluripotency and differentiation. Genome Res. 2008;18:1433–1445. doi: 10.1101/gr.078378.108. [DOI] [PMC free article] [PubMed] [Google Scholar]
- 6.Mercer TR, Dinger ME, Sunkin SM, Mehler MF, Mattick JS. Specific expression of long noncoding RNAs in the mouse brain. Proc. Natl Acad. Sci. USA. 2008;105:716–721. doi: 10.1073/pnas.0706729105. [DOI] [PMC free article] [PubMed] [Google Scholar]
- 7.Bhartiya D, Kapoor S, Jalali S, Sati S, Kaushik K, Sachidanandan C, Sivasubbu S, Scaria V. Conceptual approaches for lncRNA drug discovery and future strategies. Exp. Opin. Drug Discov. 2012;7:503–513. doi: 10.1517/17460441.2012.682055. [DOI] [PubMed] [Google Scholar]
- 8.Taft RJ, Pheasant M, Mattick JS. The relationship between non-protein-coding DNA and eukaryotic complexity. BioEssays News Rev. Mol. Cell. Dev. Biol. 2007;29:288–299. doi: 10.1002/bies.20544. [DOI] [PubMed] [Google Scholar]
- 9.Costa FF. Non-coding RNAs, epigenetics and complexity. Gene. 2008;410:9–17. doi: 10.1016/j.gene.2007.12.008. [DOI] [PubMed] [Google Scholar]
- 10.Prasanth KV, Spector DL. Eukaryotic regulatory RNAs: an answer to the ‘genome complexity' conundrum. Genes Dev. 2007;21:11–42. doi: 10.1101/gad.1484207. [DOI] [PubMed] [Google Scholar]
- 11.Sanchez-Elsner T, Gou D, Kremmer E, Sauer F. Noncoding RNAs of trithorax response elements recruit Drosophila Ash1 to Ultrabithorax. Science. 2006;311:1118–1123. doi: 10.1126/science.1117705. [DOI] [PubMed] [Google Scholar]
- 12.Rinn JL, Kertesz M, Wang JK, Squazzo SL, Xu X, Brugmann SA, Goodnough LH, Helms JA, Farnham PJ, Segal E, et al. Functional demarcation of active and silent chromatin domains in human HOX loci by noncoding RNAs. Cell. 2007;129:1311–1323. doi: 10.1016/j.cell.2007.05.022. [DOI] [PMC free article] [PubMed] [Google Scholar]
- 13.Chen X, Xu H, Yuan P, Fang F, Huss M, Vega VB, Wong E, Orlov YL, Zhang W, Jiang J, et al. Integration of external signaling pathways with the core transcriptional network in embryonic stem cells. Cell. 2008;133:1106–1117. doi: 10.1016/j.cell.2008.04.043. [DOI] [PubMed] [Google Scholar]
- 14.Zhao J, Sun BK, Erwin JA, Song JJ, Lee JT. Polycomb proteins targeted by a short repeat RNA to the mouse X chromosome. Science. 2008;322:750–756. doi: 10.1126/science.1163045. [DOI] [PMC free article] [PubMed] [Google Scholar]
- 15.Khalil AM, Guttman M, Huarte M, Garber M, Raj A, Rivea Morales D, Thomas K, Presser A, Bernstein BE, van Oudenaarden A, et al. Many human large intergenic noncoding RNAs associate with chromatin-modifying complexes and affect gene expression. Proc. Natl Acad. Sci. USA. 2009;106:11667–11672. doi: 10.1073/pnas.0904715106. [DOI] [PMC free article] [PubMed] [Google Scholar]
- 16.Mehler MF, Mattick JS. Noncoding RNAs and RNA editing in brain development, functional diversification, and neurological disease. Physiol. Rev. 2007;87:799–823. doi: 10.1152/physrev.00036.2006. [DOI] [PubMed] [Google Scholar]
- 17.Guttman M, Amit I, Garber M, French C, Lin MF, Feldser D, Huarte M, Zuk O, Carey BW, Cassady JP, et al. Chromatin signature reveals over a thousand highly conserved large non-coding RNAs in mammals. Nature. 2009;458:223–227. doi: 10.1038/nature07672. [DOI] [PMC free article] [PubMed] [Google Scholar]
- 18.Kim ED, Sung S. Long noncoding RNA: unveiling hidden layer of gene regulatory networks. Trends Plant Sci. 2012;17:16–21. doi: 10.1016/j.tplants.2011.10.008. [DOI] [PubMed] [Google Scholar]
- 19.Brannan CI, Dees EC, Ingram RS, Tilghman SM. The product of the H19 gene may function as an RNA. Mol. Cell. Biol. 1990;10:28–36. doi: 10.1128/mcb.10.1.28. [DOI] [PMC free article] [PubMed] [Google Scholar]
- 20.Brown CJ, Ballabio A, Rupert JL, Lafreniere RG, Grompe M, Tonlorenzi R, Willard HF. A gene from the region of the human X inactivation centre is expressed exclusively from the inactive X chromosome. Nature. 1991;349:38–44. doi: 10.1038/349038a0. [DOI] [PubMed] [Google Scholar]
- 21.Lee JT, Davidow LS, Warshawsky D. Tsix, a gene antisense to Xist at the X-inactivation centre. Nat. Genet. 1999;21:400–404. doi: 10.1038/7734. [DOI] [PubMed] [Google Scholar]
- 22.Sotomaru Y, Katsuzawa Y, Hatada I, Obata Y, Sasaki H, Kono T. Unregulated expression of the imprinted genes H19 and Igf2r in mouse uniparental fetuses. J. Biol. Chem. 2002;277:12 474–12478. doi: 10.1074/jbc.M109212200. [DOI] [PubMed] [Google Scholar]
- 23.Beisel C, Paro R. Silencing chromatin: comparing modes and mechanisms. Nat. Rev. Genet. 2011;12:123–135. doi: 10.1038/nrg2932. [DOI] [PubMed] [Google Scholar]
- 24.Wang XQ, Crutchley JL, Dostie J. Shaping the genome with non-coding RNAs. Curr. Genomics. 2011;12:307–321. doi: 10.2174/138920211796429772. [DOI] [PMC free article] [PubMed] [Google Scholar]
- 25.Gibb EA, Brown CJ, Lam WL. The functional role of long non-coding RNA in human carcinomas. Mol. Cancer. 2011;10:38. doi: 10.1186/1476-4598-10-38. [DOI] [PMC free article] [PubMed] [Google Scholar]
- 26.Zaidi SK, Young DW, Montecino M, Lian JB, Stein JL, van Wijnen AJ, Stein GS. Architectural epigenetics: mitotic retention of mammalian transcriptional regulatory information. Mol. Cell. Biol. 2010;30:4758–4766. doi: 10.1128/MCB.00646-10. [DOI] [PMC free article] [PubMed] [Google Scholar]
- 27.Rapicavoli NA, Poth EM, Zhu H, Blackshaw S. The long noncoding RNA Six3OS acts in trans to regulate retinal development by modulating Six3 activity. Neural Dev. 2011;6:32. doi: 10.1186/1749-8104-6-32. [DOI] [PMC free article] [PubMed] [Google Scholar]
- 28.Navarro P, Page DR, Avner P, Rougeulle C. Tsix-mediated epigenetic switch of a CTCF-flanked region of the Xist promoter determines the Xist transcription program. Genes Dev. 2006;20:2787–2792. doi: 10.1101/gad.389006. [DOI] [PMC free article] [PubMed] [Google Scholar]
- 29.Wu SC, Kallin EM, Zhang Y. Role of H3K27 methylation in the regulation of lncRNA expression. Cell Res. 2010;20:1109–1116. doi: 10.1038/cr.2010.114. [DOI] [PMC free article] [PubMed] [Google Scholar]
- 30.Fujita PA, Rhead B, Zweig AS, Hinrichs AS, Karolchik D, Cline MS, Goldman M, Barber GP, Clawson H, Coelho A, et al. The UCSC Genome Browser database: update 2011. Nucleic Acids Res. 2011;39:D876–D882. doi: 10.1093/nar/gkq963. [DOI] [PMC free article] [PubMed] [Google Scholar]
- 31.Bernstein BE, Stamatoyannopoulos JA, Costello JF, Ren B, Milosavljevic A, Meissner A, Kellis M, Marra MA, Beaudet AL, Ecker JR, et al. The NIH roadmap epigenomics mapping consortium. Nat. Biotechnol. 2010;28:1045–1048. doi: 10.1038/nbt1010-1045. [DOI] [PMC free article] [PubMed] [Google Scholar]
- 32.Harrow J, Denoeud F, Frankish A, Reymond A, Chen CK, Chrast J, Lagarde J, Gilbert JG, Storey R, Swarbreck D, et al. GENCODE: producing a reference annotation for ENCODE. Genome Biol. 2006;7(Suppl 1):S4 1–9. doi: 10.1186/gb-2006-7-s1-s4. [DOI] [PMC free article] [PubMed] [Google Scholar]
- 33.Hubbard T, Barker D, Birney E, Cameron G, Chen Y, Clark L, Cox T, Cuff J, Curwen V, Down T, et al. The Ensembl genome database project. Nucleic Acids Res. 2002;30:38–41. doi: 10.1093/nar/30.1.38. [DOI] [PMC free article] [PubMed] [Google Scholar]
- 34.Li H, Durbin R. Fast and accurate short read alignment with Burrows-Wheeler transform. Bioinformatics. 2009;25:1754–1760. doi: 10.1093/bioinformatics/btp324. [DOI] [PMC free article] [PubMed] [Google Scholar]
- 35.Trapnell C, Pachter L, Salzberg SL. TopHat: discovering splice junctions with RNA-Seq. Bioinformatics. 2009;25:1105–1111. doi: 10.1093/bioinformatics/btp120. [DOI] [PMC free article] [PubMed] [Google Scholar]
- 36.Roberts A, Pimentel H, Trapnell C, Pachter L. Identification of novel transcripts in annotated genomes using RNA-Seq. Bioinformatics. 2011;27:2325–2329. doi: 10.1093/bioinformatics/btr355. [DOI] [PubMed] [Google Scholar]
- 37.Zhang Y, Liu T, Meyer CA, Eeckhoute J, Johnson DS, Bernstein BE, Nusbaum C, Myers RM, Brown M, Li W, et al. Model-based analysis of ChIP-Seq (MACS) Genome Biol. 2008;9:R137. doi: 10.1186/gb-2008-9-9-r137. [DOI] [PMC free article] [PubMed] [Google Scholar]
- 38.Gibney ER, Nolan CM. Epigenetics and gene expression. Heredity. 2010;105:4–13. doi: 10.1038/hdy.2010.54. [DOI] [PubMed] [Google Scholar]
- 39.Laurent L, Wong E, Li G, Huynh T, Tsirigos A, Ong CT, Low HM, Kin Sung KW, Rigoutsos I, Loring J, et al. Dynamic changes in the human methylome during differentiation. Genome Res. 2010;20:320–331. doi: 10.1101/gr.101907.109. [DOI] [PMC free article] [PubMed] [Google Scholar]
- 40.Sati S, Tanwar VS, Kumar KA, Patowary A, Jain V, Ghosh S, Ahmad S, Singh M, Reddy SU, Chandak GR, et al. High resolution methylome map of rat indicates role of intragenic DNA methylation in identification of coding region. PloS One. 2012;7:e31621. doi: 10.1371/journal.pone.0031621. [DOI] [PMC free article] [PubMed] [Google Scholar]
- 41.Choi JK. Contrasting chromatin organization of CpG islands and exons in the human genome. Genome Biol. 2010;11:R70. doi: 10.1186/gb-2010-11-7-r70. [DOI] [PMC free article] [PubMed] [Google Scholar]
- 42.Du Z, Zhao D, Zhao Y, Wang S, Gao Y, Li N. Identification and characterization of bovine regulator of telomere length elongation helicase gene (RTEL): molecular cloning, expression distribution, splice variants and DNA methylation profile. BMC Mol. Biol. 2007;8:18. doi: 10.1186/1471-2199-8-18. [DOI] [PMC free article] [PubMed] [Google Scholar]
- 43.Deaton AM, Bird A. CpG islands and the regulation of transcription. Genes Dev. 2011;25:1010–1022. doi: 10.1101/gad.2037511. [DOI] [PMC free article] [PubMed] [Google Scholar]
- 44.Maunakea AK, Nagarajan RP, Bilenky M, Ballinger TJ, D'Souza C, Fouse SD, Johnson BE, Hong C, Nielsen C, Zhao Y, et al. Conserved role of intragenic DNA methylation in regulating alternative promoters. Nature. 2010;466:253–257. doi: 10.1038/nature09165. [DOI] [PMC free article] [PubMed] [Google Scholar]
- 45.Mattick JS. Non-coding RNAs: the architects of eukaryotic complexity. EMBO Rep. 2001;2:986–991. doi: 10.1093/embo-reports/kve230. [DOI] [PMC free article] [PubMed] [Google Scholar]
- 46.Wapinski O, Chang HY. Long noncoding RNAs and human disease. Trends Cell Biol. 2011;21:354–361. doi: 10.1016/j.tcb.2011.04.001. [DOI] [PubMed] [Google Scholar]
- 47.Taft RJ, Pang KC, Mercer TR, Dinger M, Mattick JS. Non-coding RNAs: regulators of disease. J. Pathol. 2010;220:126–139. doi: 10.1002/path.2638. [DOI] [PubMed] [Google Scholar]
- 48.Saferali A, Grundberg E, Berlivet S, Beauchemin H, Morcos L, Polychronakos C, Pastinen T, Graham J, McNeney B, Naumova AK. Cell culture-induced aberrant methylation of the imprinted IG DMR in human lymphoblastoid cell lines. Epigenet. Off. J. DNA Methylation Soc. 2010;5:50–60. doi: 10.4161/epi.5.1.10436. [DOI] [PubMed] [Google Scholar]
- 49.Zemach A, McDaniel IE, Silva P, Zilberman D. Genome-wide evolutionary analysis of eukaryotic DNA methylation. Science. 2010;328:916–919. doi: 10.1126/science.1186366. [DOI] [PubMed] [Google Scholar]
- 50.Brenet F, Moh M, Funk P, Feierstein E, Viale AJ, Socci ND, Scandura JM. DNA methylation of the first exon is tightly linked to transcriptional silencing. PLoS One. 2011;6:e14524. doi: 10.1371/journal.pone.0014524. [DOI] [PMC free article] [PubMed] [Google Scholar]
- 51.Illingworth RS, Gruenewald-Schneider U, Webb S, Kerr AR, James KD, Turner DJ, Smith C, Harrison DJ, Andrews R, Bird AP. Orphan CpG islands identify numerous conserved promoters in the mammalian genome. PLoS Genet. 2010;6 doi: 10.1371/journal.pgen.1001134. [DOI] [PMC free article] [PubMed] [Google Scholar]
- 52.Sleutels F, Zwart R, Barlow DP. The non-coding Air RNA is required for silencing autosomal imprinted genes. Nature. 2002;415:810–813. doi: 10.1038/415810a. [DOI] [PubMed] [Google Scholar]
- 53.Mancini-DiNardo D, Steele SJ, Ingram RS, Tilghman SM. A differentially methylated region within the gene Kcnq1 functions as an imprinted promoter and silencer. Hum. Mol. Genet. 2003;12:283–294. doi: 10.1093/hmg/ddg024. [DOI] [PubMed] [Google Scholar]
- 54.Mancini-Dinardo D, Steele SJ, Levorse JM, Ingram RS, Tilghman SM. Elongation of the Kcnq1ot1 transcript is required for genomic imprinting of neighboring genes. Genes Dev. 2006;20:1268–1282. doi: 10.1101/gad.1416906. [DOI] [PMC free article] [PubMed] [Google Scholar]
- 55.Guenther MG, Levine SS, Boyer LA, Jaenisch R, Young RA. A chromatin landmark and transcription initiation at most promoters in human cells. Cell. 2007;130:77–88. doi: 10.1016/j.cell.2007.05.042. [DOI] [PMC free article] [PubMed] [Google Scholar]
- 56.Mikkelsen TS, Ku M, Jaffe DB, Issac B, Lieberman E, Giannoukos G, Alvarez P, Brockman W, Kim TK, Koche RP, et al. Genome-wide maps of chromatin state in pluripotent and lineage-committed cells. Nature. 2007;448:553–560. doi: 10.1038/nature06008. [DOI] [PMC free article] [PubMed] [Google Scholar]
- 57.Cedar H, Bergman Y. Linking DNA methylation and histone modification: patterns and paradigms. Nat. Rev. Genet. 2009;10:295–304. doi: 10.1038/nrg2540. [DOI] [PubMed] [Google Scholar]
- 58.Hahn MA, Wu X, Li AX, Hahn T, Pfeifer GP. Relationship between gene body DNA methylation and intragenic H3K9me3 and H3K36me3 chromatin marks. PLoS One. 2011;6:e18844. doi: 10.1371/journal.pone.0018844. [DOI] [PMC free article] [PubMed] [Google Scholar]
- 59.De Gobbi M, Garrick D, Lynch M, Vernimmen D, Hughes JR, Goardon N, Luc S, Lower KM, Sloane-Stanley JA, Pina C, et al. Generation of bivalent chromatin domains during cell fate decisions. Epigenet. Chromatin. 2011;4:9. doi: 10.1186/1756-8935-4-9. [DOI] [PMC free article] [PubMed] [Google Scholar]
Associated Data
This section collects any data citations, data availability statements, or supplementary materials included in this article.


