


Abstract
Translation in baker’s yeast involves the coordinated interaction of 200 000 ribosomes, 3 000 000 tRNAs and between 15 000 and 60 000 mRNAs. It is currently unknown whether this specific constellation of components has particular relevance for the requirements of the yeast proteome, or whether this is simply a frozen accident. Our study uses a computational simulation model of the genome-wide translational apparatus of yeast to explore quantitatively which combinations of mRNAs, ribosomes and tRNAs can produce viable proteomes. Surprisingly, we find that if we only consider total translational activity over time without regard to composition of the proteome, then there are many and widely differing combinations that can generate equivalent synthesis yields. In contrast, translational activity required for generating specific proteomes can only be achieved within a much more constrained parameter space. Furthermore, we find that strongly ribosome limited regimes are optimal for cells in that they are resource efficient and simplify the dynamics of the system.
INTRODUCTION
Proteomes evolve under many different constraints including the minimization of the energy required to produce them (1), and the establishment of biochemical networks that optimize metabolic fluxes or increase fitness by other means (2). Another constraint, which is not widely studied, is that viable proteomes must be producible with a limited gene expression machinery. Gene expression is in essence a two-step process, whereby protein templates are produced during transcription, and the proteins proper during translation. Although specific limitations apply at every level, translation is overall the more resource intense step. The main components of the translation machinery are tRNAs, mRNAs and ribosomes. Particularly the latter are very costly to produce for the cell and have been proposed to limit gene expression and cell growth as a whole (1).
The optimality of a particular proteome is not only a function of its environment, but will also depend on its metabolic maintenance costs. It appears to be generally accepted knowledge that cell resources somehow limit the achievable proteomes (1), yet at present we do not have a detailed understanding of this limitation. Indeed, while the particular details of many biological mechanisms involved in gene expression are well understood now, we do not know how the individual processes interact with one another at a systems level.
To understand this we will focus on a particularly well-studied model organism for translation, baker’s yeast (Saccharomyces cerevisiae). Its translational machinery consists of ∼200 000 ribosomes, 4500 expressed mRNA species and 3 million tRNAs distributed over 42 tRNA species (3,4). Estimates of the total number of mRNA within the cell at any one time range from 15 000 to 60 000 (3,5,6). For the purpose of this contribution we will primarily focus on the lower end of this range, which is dynamically the most complex area. However, where applicable, we will discuss how conclusions are affected if the mRNA content is higher. The molecular detail of the translation-factor-mediated interactions between the individual components is now well understood (7). With all these available data, we possess in principle the information to fully characterize yeast translation. However, due to the complexity of the system we are still unable to understand the implications of these data. Even less do we understand the ‘fitness landscape’ of translation, that is how changes in parameters affect the ability of the cell to translate efficiently.
We have recently developed a stochastic simulation model of eukaryotic translation (8) that can be used to systematically probe the system and understand the implications of available knowledge about translation. For the present study, we parametrized this model using ribosome footprinting data by Ingolia (9) and other parameter values from the literature (especially (3)). We thus have a simulation model of S. cerevisiae translation under a specific growth condition (fast growth in rich medium) that represents in detail tRNA concentrations, individual ribosomes and mRNAs. The model can also provide a system-wide picture of ribosomal traffic jams on particular mRNAs including modulations of initiation rates caused by traffic jams that block the initiation sequence.
Computational modelling of translation per se is not new. The first model dates back to 1969 (10) and there has been a steady stream of improved models ever since. In recent years activity in this field has increased substantially. However, the focus of current models tends to be rather narrow as they concentrate on isolated aspects of translation, such as codon usage (11–13), ribosome–ribosome interactions (14,15), initiation (16,17) or elongation (18).
This study is an attempt to explore the system-level properties of translation. Our interest is not primarily to reproduce a particular known (or conjectured) behaviour of the bio-system. Instead we wish to use the simulation model as a computational synthesis machine to generate a systems understanding of translation. This includes exploring the structure of the parameter space that defines translation. Remarkably, we find that the overall translation rate (proteins per second) can be achieved by a wide range of parameters. In contrast, if not only the overall translation rate, but also the translation rates of each individual ORF are taken into account, then the range of parameters that leave the system invariant narrows drastically. We also find that within the range of physiologically plausible parameters, ribosomes are limiting translation. Our simulations show that a ribosome limited regime has a number of characteristics that are beneficial to the cell: Firstly, the high metabolic cost of ribosomes warrants their economical use. Secondly, too many ribosomes lead to traffic jams and hence sub-optimal use of resources which, thirdly, also makes it difficult for the cell to maintain a specific proteome.
MATERIALS AND METHODS
Simulation model and parametrization
For all simulations we used a recently published agent-based software developed by Chu et al. (8) to simulate translation. We parametrized the model for S. cerevisiae using data from (3,9). In the model ribosomes and transcripts are explicitly represented as individual agents. This means that the software keeps track for each ribosome whether it is bound to an mRNA and if so which one and at which position. For tRNA molecules only the overall numbers of mRNA-bound, free-charged and free-uncharged tRNAs of each species are accounted for. Stochastic events in the model are generated using the Gillespie (19) algorithm.
The rate of binding of ribosomes to the initiation sequence happens with a rate of  . Here C, the initiation rate factor;
  , the relative initiation rate (see below);
  , the number of transcripts of type i; and Rfree, the number of free ribosomes. The parameters
  were estimated based on the distance between ribosomes on mRNA sequences. We obtained an estimate for the number of ribosomes on each type of mRNA from the Ingolia dataset. Then we divided this by the estimated reading time of the ORF (calculated using the model by Fluitt et al.) to obtain the distance between ribosomes in seconds. This cannot be used directly as the initiation rate, because the number of free ribosomes are unknown. We calculated
  by dividing the sum over all distances by the average distance on ORF i. This is not an accurate estimate of the initiation rate because actual reading times may be impacted by traffic jams potentially overestimating the initiation rates.
Upon binding to the initiation site, a ribosome attempts to move on to the coding sequence immediately (with a very high rate). If the coding sequence is occupied, then it unbinds again. In real cells, there will be a delay between binding to the initiation site and finding the AUG site. The relevant rates are not known, hence there is no benefit gained from including this effect in the model.
The elongation step follows the Fluitt model (18,20,21) and includes competitive binding between cognate and near-cognate aa-tRNA. The effect of non-cognate tRNA on elongation is ignored. Mis-incorporations of amino acids are allowed in accordance with the model (20). After the final proofreading step ribosome translocation happens with a high rate (see Supplementary Table S1B for details). If the ribosome cannot move on because the next codon position is occupied, then it waits until the site becomes free and translocates then. Upon termination the ribosome either unbinds from the mRNA molecule or proceeds to the first AUG codon for another translation round. The decision whether or not to unbind is made probabilistically, but a ribosome always unbinds after a user-defined number of re-initiations.
We assumed that there are in total 15 000 mRNA species in the cell distributed over several thousands of species (3). The individual numbers of transcripts of type i per cell cannot be obtained from the Ingolia dataset. We therefore use an independent set of measurements reported by von der Haar (3). This dataset is not coextensive with the Ingolia set. For the simulations we used the intersection of those two sets and a total of 4248 different ORFs (see Supplementary Dataset S3 for the complete list). For the model we do not use this absolute number of copies  , but instead the relative number
  to allow convenient scaling. The number of transcripts
  of a particular ORF i in the simulation are then calculated as follows:
| (1) |
Here M is the total number of mRNA determined by the user, as opposed to MvdH the sum of all mRNA from the von der Haar set. Unless stated otherwise we used Muser = 15 000 in all simulations reported here; given the particular random seed we used this resulted in 13 018 mRNAs. All data reported here were obtained from simulations that were run for at least 5000s. This was sufficiently long to minimize the influence of any transient effects at initialization.
Throughout the article we refer to standard parameters (see Table 1 for the key parameters that have been varied; for an exhaustive list, see Supplementary Dataset S3). These are the currently best known parameter values for S. cerevisiae during exponential growth.
Table 1.
The standard parameters The standard parameters have nominally 15 000 mRNAs, however, due to the stochastic nature of the allocation algorithm this results in 13018 mRNAs only
| Number of ribosomes | 200 000 |
| Number of mRNA | 13 018 |
| Ribosome recycling Rounds | 9 |
| Number of tRNA | 3 million |
| Rate of reacharging tRNA | 47 s-1 |
Minimal transcriptome analysis
To obtain the size of the minimal transcriptome we first calculated the translational capacity. Based on the data in Supplementary Figure S1.3 we approximated this by the translation rate at 500 000 ribosomes. Using the translational capacity we could then calculate for each ORF the minimum number of transcripts  required to complete a certain number of translation rounds per second. This is obtained by the following formula:
| (2) |
Here  is the translational capacity of the i-th ORF and
  is the observed translation rate (at standard parameters in this case). The brackets indicate the ceiling function. We did this analysis for each ORF i in the simulation to obtain the minimum number of transcripts required. To obtain the minimum number of mRNAs to translate a given transcriptional profile we calculated
  the sum over all ORFs.
We performed the analysis for a number of assumed total translation rates ranging from 200 to 10 000  . For a given translational profile and translation capacities the minimum number of transcripts is a linear function of the total translation rate. To obtain Equation (6) we fitted the various sample points from the analysis to a straight line.
Minimum ribosome analysis
In the limiting case of infinite transcriptome or when the mRNA number is sufficiently large, then there will be only one ribosome per transcript. This means that there are no traffic jams and the translation rate scales linearly with the number of ribosomes and the relative expression rate  of ORF i will solely depend on the relative transcript number
  and initiation rate
  :
:
 |
(3) |
The left-hand side of this equation defines the contribution of ORF i to the translational profile. Note that the number of free ribosomes is assumed to be zero here, which is a direct consequence of the assumption of an infinite transcriptome. In this simple case, the absolute expression rate is determined by the number of ribosomes  transcribing ORF i and the time
  required to read the ORF.
| (4) |
If we allow sharing of ribosomes between different ORFs (and hence non-integer ribosome numbers), then the number of ribosomes required to yield a given average translation rate  is given by
| (5) |
To calculate the minimum number of ribosomes we used for  the observed translation rates at standard parameters and the calculated
  using the Fluitt model.
RESULTS AND DISCUSSION
Translation initiation
Among studies on the molecular mechanism of translation, translation initiation is often referred to as ‘the rate-limiting step’ of protein synthesis (e.g. (22)). The underlying rationale for this statement is that most identified translational control mechanisms impinge on translation initiation factors, and that the experimental manipulation of translation initiation for an mRNA usually alters the corresponding protein expression levels. It is worth noting that although experimental results indicate that initiation is one important control point of protein synthesis rates, it is not necessarily the only one. For example, formal control analyses have shown that control can pass between translation initiation and elongation by altering the numbers of free ribosomes (23). Because of this general perception of translation initiation as an important regulator of gene expression, we begin our study by asking in how far the observed translation initiation rates determine other observed properties of the system.
In order to investigate translation initiation using the model, we need to conceptually distinguish three elements that each could be a separate limiting factor. Firstly, there is the affinity of ribosomes to the transcript. In eukaryotic translation this is an intricate process that involves many different translation factors (24). Since we have insufficient quantitative information to model initiation faithfully, we make the simplifying assumption that the reaction follows mass-action dynamics. Secondly, the overall initiation rate also depends on the availability of free ribosomes: an increase in ribosome affinity cannot affect translation rates if there are no free ribosomes available to bind to mRNAs. Thirdly, initiation may be affected by 5′-UTR crowding caused by slow scanning of the initiation sequence: even if the ribosome affinity is high and many ribosomes are available, no further translation initiation event can happen until the previously bound ribosome has liberated the initiation region. In reality this problem is split into two parts: following cap-binding, it is likely that the small ribosomal subunit needs to scan to the AUG codon before the next small subunit can attach to the cap-structure (25). Then, following localisation of the AUG and assembly of the full ribosome, this ribosome must elongate away from the AUG before the next small subunit can reach the start codon.
In our model, ribosome affinity is approximated by mRNA-specific initiation rate factors (see Materials and Methods section for an explanation) obtained from recent footprinting data (9). These initiation rates reflect the transcript-specific effects due to 5′-UTR crowding. Therefore, we do not explicitly represent scanning in our model. For initiation rates that are significantly above the physiological ones this choice may lead to artefactual behaviours as discussed below. Note, however, that the impact of traffic jams at the initial AUG site on the ribosomal binding rate is explicitly represented in the model.
Figure 1 shows the translation rate as a function of the initiation rate factor. Clearly, the translation rate saturates for high enough values. This saturation could be due to a limitation of available space on the transcript, or due to a reduction of available free ribosomes at high initiation rates or both. In the simulations with 400 000 ribosomes (i.e. twice the best estimate) there are significant numbers of free ribosomes available within the saturated area (Figure 1 (right)). This suggests that in this case transcript capacity is limiting translation. In contrast, for 100 000 and 200 000 ribosomes there are practically no free ribosomes at saturating levels indicating that in this part of parameter space ribosome availability is limiting translation rates at high initiation rates. Physiological mRNA numbers may be significantly higher than stipulated by standard parameters. Clearly, if the size of the transcriptome is increased while keeping the ribosome number fixed, then limitation due to ribosomes is further exacerbated because more transcripts are competing for the same amount of ribosomes. It should be noted that these statements strictly pertain to global translational activity, and do not preclude that for individual transcripts the capacity is limiting.
Figure 1.

The amount of protein produced per second (a) and the number of free ribosomes at steady state (b) as a function of the initiation rate. To improve readability we use log-scale on the horizontal axis. The vertical line indicates the standard parameters with an initiation rate factor of 0.025.
Our choice to represent delays due to scanning as a part of ribosome binding affinities could potentially over-estimate the density of ribosomes on the mRNAs and under-estimate ribosome availability for high initiation rates. Based on the range of possible parameters, we can estimate the maximal impact of 5′-UTR scanning on the global translation rate which is the maximal contribution of scanning to limitation. In a live yeast cell at high growth it is thought that 10–20% of the ribosomes are free (summarized in (3)). Due to the experimental techniques used, this value itself is probably an upper limit, since ribosomes are more likely to artefactually detach from mRNAs than they are to artefactually associate with mRNAs during the polysome isolation procedures used for these assays. At standard parameters our model predicts about 10% free ribosomes for an initiation rate factor of 0.025. This falls into an area of the parameter space where the initiation rate is beginning to saturate. One conclusion to draw from this is that limitations by scanning are small: if we take the 10% estimate at face value and if we believe that ribosome density at the 5′-UTR is not limiting, then an initiation rate factor of 0.025 would reflect reality. It could equally be that the initiation rate factor is substantially higher than 0.25 but 5′-UTR crowding prevents binding of ribosomes. However, we can infer from the model that 5′-UTR crowding at most leads to a small ( %) reduction of the translation rate corresponding to the difference between the rates at an initiation rate factor of 10 (i.e. at full saturation) and the standard parameters. If indeed 20% of ribosomes are free, then the closest initiation rate factor we sampled is 0.005 which predicts about 25% free ribosomes and a
  % reduction of the translation rate. We performed a similar analysis for larger transcriptomes. We found the largest impact to be
  and
and  for 30 000 and 70 000 mRNAs, respectively.
In summary, these detailed simulations confirm our previous findings (18) that under the conditions of fast growth the global capacity for protein synthesis in S. cerevisiae is limited first and foremost by ribosome shortages. The ribosome affinity and limitations in the scanning process exert additional levels of control over global translation rates.
Transfer RNA availability
Following the investigation of translation initiation as a limiting parameter in the system, we turned our attention to elongation. This process depends on a number of parameters in the system, of which we first investigate tRNA availability. Other aspects are dealt with in the following sections.
According to the current structural understanding of the ribosome, tRNAs can be accommodated simultaneously at two out of three distinct tRNA binding sites (26). With about 200 000 ribosomes in the cell, at most 400 000 tRNAs can be bound at any one time, leaving at least 2.6 million tRNAs free in the cytoplasm. Available quantitative information (18) suggests that aminoacylation is fast compared with aa-tRNA depletion. Most of the remaining tRNAs are therefore predicted to be charged with tRNA, consistent with experimental studies on selected tRNA species (27–29). Altogether, this leaves a large excess of free tRNA in the cell.
It is not clear whether a large excess of tRNAs is important for the dynamic properties of translation. The best available biochemical knowledge suggests (18,20) that the relevant indicator for the average elongation time of a particular codon is the ratio of cognate and near-cognate aa-tRNA. In contrast, the absolute number of cognate aa-tRNA only becomes a strong determinant of elongation rates at extremely low tRNA concentrations.
In order to understand this, we conduct simulations where we vary the total number of tRNA while keeping the species composition fixed (Figure 2). For very low tRNA numbers the translation rate is very low, but it increases rapidly with the tRNA concentration. For high tRNA numbers we find, as expected, that the translation rate is insensitive to tRNA numbers. Surprisingly, in-between these two regimes, the translation rate shows a maximum (albeit a modest one). The existence of this maximum is difficult to reconcile with our theoretical expectation that the decoding speed only depends on the ratio of cognate and near-cognate tRNA. Upon closer examination we found it to be a result of trapping of tRNA in ribosomal A and P sites (Supplementary Figure S1.6). At low tRNA levels this leads to fast ORFs being disproportionally sped up (Supplementary Figure S1.1) resulting in an overall increase of the translation.
Figure 2.
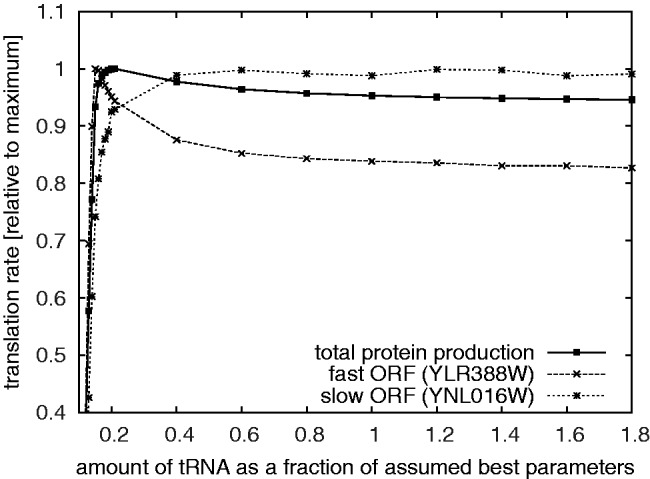
Comparing the amount of protein expressed as a function of tRNA amount. The solid line indicates the total amount of protein. The thinner line indicates the expression of one of the fastest and one of the slowest ORFs in our simulations.
It is not clear whether this effect would carry over into biological reality. As far as the biological interpretation of the simulation results is concerned, of far greater consequence is that tRNA levels are higher than one would expect to be necessary based on the simulations. For example, uniformly halving the number of tRNAs from the standard parameters has no significant effect on the translation rate, either globally or for any individual mRNA. We have shown previously that yeast fitness is robust with respect to changes in tRNA synthetase gene copy number (i.e. the activity that recharges tRNAs after a translational cycle) (18), which is consistent with the view that the tRNA system in general is designed for spare capacity. On the other hand, we note that this robustness of the translation apparatus to tRNA concentrations could be an artefact of the ‘perfect mixing’ assumption underlying the model. The spatial structure of real cells may lead to local depletions of ternary complexes in the vicinity of ribosomes (30) which may lead to local concentrations much below the global ones. This could be a particularly strong effect on local stretches of transcripts with high codon repetition. In these cases the diffusion constant could become a limiting factor of translation.
Limitation through traffic jams
Apart from tRNA availability, the role of ribosome–ribosome interactions or traffic jams in limiting translation has been frequently studied. On densely packed ribosomes traffic jams could have a material impact on the average transit time of ribosomes. There are a number of analytical/mathematical methods to understand this effect in idealized systems; particularly relevant for translation is (31); for a comprehensive review see (32). However, the analytical models are of limited value in the case of translation because traffic jams are crucially sensitive not only to polysome size, but also to the particular codon sequence (33); no analytical models are available for the latter. Moreover, traffic jams impact on the average reading time of codons and as such the availability of free ribosomes. Hence, the number of ribosomes on one transcript depends on the amount of traffic jams on this and all other transcripts. The effects of ribosome–ribosome interactions can therefore only be estimated in system-wide models such as the present one.
We quantify the impact of traffic jams by the excess time ratio to read a codon in simulations (i.e. the ratio of the reading time in the full model over the reading time for one isolated ribosome). If this ratio is high for an ORF, then traffic jams are a dominant effect. If it is 1 then no traffic jams occur; due to the stochastic nature of our simulation values slightly smaller than 1 can also occur. Figure 3 shows the distribution of these ratios across the transcriptome for three different ribosome numbers at standard parameters. It clearly emerges that the standard parameters have a peak close to 1, which indicates that traffic jams have a minimal effect. This is in strong contrast to the case of 400 000 ribosome which peaks at higher reading times and has a much wider distribution around the peak, indicating that at increased ribosome numbers, translational activity becomes significantly limited by traffic jams. In contrast, the figure also shows that for standard parameters with doubled and quadrupled mRNA numbers traffic jams are essentially absent.
Figure 3.

The distribution of the translation time excess ratio (see main text for an explanation). It quantifies the impact of traffic jams on the average reading times of codons. A value of 1 means that there is no significant impact of traffic jams on the average reading times of individual codons. Values smaller than 1 are possible because of stochastic fluctuations. We vary the number of ribosomes (left) and the size of the transcriptome (right). Doubling either the number of ribosomes or the number of mRNAs is sufficient to effectively remove the impact of traffic jams.
Number of ribosomes
So far our results predict that the translation rate is limited by the ribosome numbers; this is also consistent with previous experimental and computational results obtained with a simpler model (18). The extent to which ribosomes limit translation in the absence of scanning depends strongly on the number of mRNAs (Figure 4). At standard parameters and 100 000 ribosomes doubling the ribosome number causes a 1.34-fold increase of the translation rate, whereas doubling the mRNA content leads to a slightly smaller (1.29-fold) increase (Supplementary Figure S1.5). At standard parameters proper, that is with 200 000 ribosomes, the limitation due to mRNA (1.51-fold increase of the translation rate when the size of the transcriptome is doubled) is stronger than limitation due to ribosomes (1.16-fold increase when doubled). If on the other hand the mRNAs are doubled from standard parameters, then a further doubling of the size of the transcriptome leads to negligible increases of the translation rate only. However, at this point sensitivity to ribosome numbers is restored ( -fold increase when ribosomes are doubled). This suggests that at standard parameters with 30 000 or more mRNAs translation is no longer limited by the size of the transcriptome.
Figure 4.
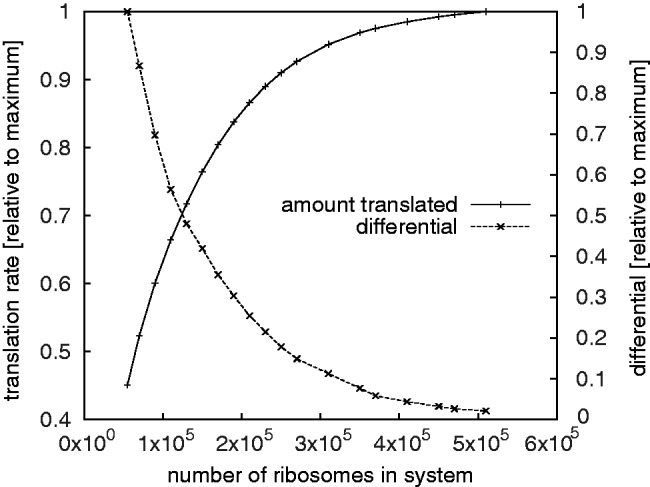
The translation rate as a function of the total number of ribosomes. The graph shows both the relative translation rate and the differential/slope (i.e.  ).
).
It is clear from Figure 5 that a given overall translation rate can be realized by a wide range of different combinations of ribosome and mRNA numbers. In order to be able to interpret this we used available biochemical data to explore in detail the cost of generating the ribosome, tRNA and mRNA complements in the yeast system (Supplementary Methods S2). We find that maintenance of the ribosome complement carries energy costs of 255 million ATP equivalents per minute, 50 times more than the cost of maintaining the tRNA complements and (depending on the number of mRNA) 50–150 times more than the cost of maintaining the mRNA transcriptome. Thus in pure energy expenditure terms, systems that would employ reduced numbers of ribosomes but increased numbers of mRNAs while allowing the same global translation rate are energetically favourable.
Figure 5.
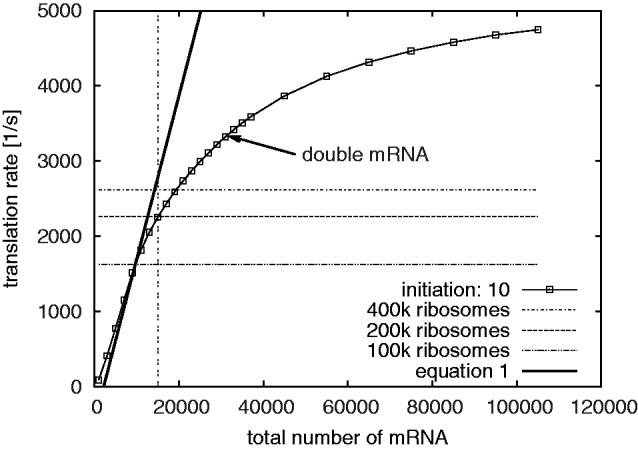
The total translation rate as a function of the total amount of mRNA. The plot shows an initiation rate of 10. As a comparison we show the total protein production for 400 000, 200 000 and 100 000 ribosomes at otherwise standard parameters with an initiation rate of 10. The data of these lines corresponds to the relevant points in Figure 1 (left). The arrow indicates the number of translated proteins that are achieved by doubling the mRNA number from the standard parameters. The line labelled ‘Equation (1)’ indicates the capacity translation rate for a given number of mRNAs, as predicted by Equation (1). Going beyond standard parameters, the system operates far below capacity. Note that Equation (1) is no longer valid at very low mRNA numbers because many low copy mRNA molecules will not be available there and hence the transcriptome will be different.
Translational profiles
An aspect we have ignored so far is the translational profile, that is the translation rate of individual ORFs. Biologically this is more relevant than the overall translation rate because it directly determines the proteome composition.
We define the translational capacity of a transcript as the maximal translation rate per transcript given an infinite (or very large) supply of ribosomes; in essence the translational capacity is the translation rate when traffic jams are the sole limiting factor. We found that (at standard parameters) most ORFs reach capacity at 500 000 ribosomes (Supplementary Figure S1.2) and we choose to approximate the capacity as the translation rate at this point.
The translational capacity sets a lower limit to the number of mRNA given a translational profile and total translation rate. If the capacities of ORFs were sufficiently large (or infinite) the minimal transcriptome size would be equal to the number of mRNA species. For example, if the capacity of an ORF is 20 proteins per second and the required rate is 23 per second, then at least two copies of this particular ORF are necessary (assuming a fixed proteome).
We performed a minimal transcriptome analysis (see Materials and Methods section) to understand the smallest transcriptome that is consistent with the translational profile obtained at standard parameters. This analysis assumes that there is an unlimited supply of ribosomes in the system. We obtained the following relationship between the total translation rate T (per second) and the minimum size of the transcriptome Mmin.
| (6) |
The fitting error associated with the slope and intercept are  and
and  , respectively. If we assume that the size of the transcriptome is M = 13 018 (i.e. Muser = 15 000), then we obtain a maximal translation rate of
  s−1. In the simulations with standard parameters we found a translation rate of
  s−1 which is just (8.7%) below the maximal rate. Another way to say this is that the actual expression rate could have been realized with a transcriptome of 12 128 mRNAs running at capacity. If we allow for fractional mRNA numbers (i.e. transcripts go in and out of existence and realize fractional averages), then the maximal expression rate increases to
  s−1 and the minimal transcriptome to achieve the existing expression rate would be
  mRNA molecules.
We also performed a minimal ribosome analysis (see Materials and Methods section) to determine the minimum number of ribosomes required to achieve the translational profile at a given translation rate. This analysis assumes a very large transcriptome, large enough to avoid traffic jams. Using the translation rates from one particular run of the model with standard parameters, we found that the minimum number of ribosomes required is 196 729, which is very close to the actually used 200 000. Note that when (i) scanning is not limiting; and (ii) the transcriptome is sufficiently large so that there are no traffic jams, then the minimum number of ribosomes is equal to the maximal number of ribosomes. Under these conditions the dynamics of translation simplifies significantly in that the overall translation rate is only determined by the number of ribosomes and the relative protein expression is determined by the specifics of the transcriptome. If on the other hand both ribosome numbers and the size of the transcriptome are limiting, i.e. there are traffic jams, then varying the number of ribosomes will also affect the translational profile. This is clear from considering the translation rates: Figure 5 predicts a translation rate of  s−1 at standard parameters. A similar translation rate (
 s−1) can be achieved in simulations using 100 000 ribosomes and 50 000 ribosomes. Since the minimum ribosome number for the translational profile resulting at standard parameters is much larger than that (196 729), it is clear that the change of ribosome numbers results in a change of the translational profile.
CONCLUSIONS
In this contribution, our approach was to take the best available knowledge about translation at face value and analyse its consequences in a computer simulation. We did not set out to reproduce any particular behaviour, nor did we fit any parameters to the data.
According to our model, the cell seems to have an over-abundance of aa-tRNAs. We suspect that this conclusion is an artefact of the perfect mixing assumption that underpins our simulations. There have been previous reports of local aa-tRNA shortages in certain circumstances. We leave it to future research to decide on the interpretation of this apparent over-abundance.
In line with previous findings, we find that ribosomes numbers are a limiting factor of translation. Based on a consideration of costs, one would certainly expect that. However, limitation by ribosomes is also dynamically beneficial. A large number of ribosomes (compared with the size of the transcriptome) leads to traffic jams. This is inefficient because it leads to an overall reduction of the elongation rate. Moreover, traffic jams also cause a more complicated dynamics in the sense that the relative translation rate of ORFs depends on both the number of ribosomes and the composition of the transcriptome. This makes it hard for the cell to control the translational profile under changing environmental conditions. We find that under standard parameters this difficult dynamical regime is still in force. If, on the other hand, the transcriptome is 30 000 or larger, which it could be according to recent estimates, then mRNA numbers effectively cease to limit the translation rate. In this case they are the sole determinant of the relative protein production rate.
The simulations presented in this contribution are based on a model parametrized for yeast. Yet, based on insights obtained from them we predict that other organisms will be in the same dynamical regime. Concretely, we predict that the number of ribosomes will be sufficiently high so that traffic jams are avoided except on few highly expressed mRNAs where the required translation rates would meet the limitations of the transcription apparatus. Moreover, limitation due to scanning will remain a sub-ordinate effect. Its primary dynamical role is in preventing traffic jams on mRNAs. This can equally be achieved by reducing the global ribosome number which would also come at a metabolic benefit. Given current understanding of translation, scanning therefore only makes sense as a secondary control mechanism. At present it is not possible to test this prediction because the required numerical information is not available for eukaryotic cell types other than baker’s yeast. However, we expect that in the near future the relevant parameters will be known and our prediction can be tested by computational modelling and experimental enquiry.
SUPPLEMENTARY DATA
Supplementary Data are available at NAR Online: Supplementary Figures 1.1–1.6, Supplementary Methods 2, Supplementary Dataset 3 and Supplementary References [34–51].
FUNDING
Funding for open access charge: School of Computing/School of Biosciences, University of Kent.
Conflict of interest statement. None declared.
Supplementary Material
REFERENCES
- 1.Dekel E, Alon U. Optimality and evolutionary tuning of the expression level of a protein. Nature. 2005;436:588–592. doi: 10.1038/nature03842. [DOI] [PubMed] [Google Scholar]
- 2.Elena S, Lenski R. Evolution experiments with microorganisms: the dynamics and genetic bases of adaptation. Nat. Rev. Genet. 2003;4:457–469. doi: 10.1038/nrg1088. [DOI] [PubMed] [Google Scholar]
- 3.von der Haar T. A quantitative estimation of the global translational activity in logarithmically growing yeast cells. BMC Syst. Biol. 2008;2:87. doi: 10.1186/1752-0509-2-87. [DOI] [PMC free article] [PubMed] [Google Scholar]
- 4.Hani J, Feldmann H. tRNA genes and retroelements in the yeast genome. Nucleic Acids Res. 1998;26:689–696. doi: 10.1093/nar/26.3.689. [DOI] [PMC free article] [PubMed] [Google Scholar]
- 5.Miura F, Kawaguchi N, Yoshida M, Uematsu C, Kito K, Sakaki Y, Ito T. Absolute quantification of the budding yeast transcriptome by means of competitive PCR between genomic and complementary DNAs. BMC Genomics. 2008;9:574. doi: 10.1186/1471-2164-9-574. [DOI] [PMC free article] [PubMed] [Google Scholar]
- 6.Zenklusen D, Larson D, Singer R. Single-RNA counting reveals alternative modes of gene expression in yeast. Nat. Struct. Mol. Biol. 2008;15:1263–1271. doi: 10.1038/nsmb.1514. [DOI] [PMC free article] [PubMed] [Google Scholar]
- 7.Hershey J, Sonenberg N, Mathews M. Translational Control in Biology and Medicine. New York: Cold Spring Harbor Laboratory Press; 2007. [Google Scholar]
- 8.Chu D, Zabet N, von der Haar T. A novel and versatile computational tool to model translation. Bioinformatics. 2012;28:292–293. doi: 10.1093/bioinformatics/btr650. [DOI] [PubMed] [Google Scholar]
- 9.Ingolia N, Ghaemmaghami S, Newman J, Weissman J. Genome-wide analysis in vivo of translation with nucleotide resolution using ribosome profiling. Science. 2009;324:218–223. doi: 10.1126/science.1168978. [DOI] [PMC free article] [PubMed] [Google Scholar]
- 10.Gordon R. Polyribosome dynamics at steady state. J. Theor. Biol. 1969;22:515–532. doi: 10.1016/0022-5193(69)90018-6. [DOI] [PubMed] [Google Scholar]
- 11.Zouridis H, Hatzimanikatis V. A model for protein translation: polysome self-organization leads to maximum protein synthesis rates. Biophys. J. 2007;92:717–730. doi: 10.1529/biophysj.106.087825. [DOI] [PMC free article] [PubMed] [Google Scholar]
- 12.Zouridis H, Hatzimanikatis V. Effects of codon distributions and tRNA competition on protein translation. Biophys. J. 2008;95:1018–1033. doi: 10.1529/biophysj.107.126128. [DOI] [PMC free article] [PubMed] [Google Scholar]
- 13.Racle J, Overney J, Hatzimanikatis V. A computational framework for the design of optimal protein synthesis. Biotechnol. Bioeng. 2012;109:2127–2133. doi: 10.1002/bit.24463. [DOI] [PubMed] [Google Scholar]
- 14.Romano M, Thiel M, Stansfield I, Grebogi C. Queueing phase transition: theory of translation. Phys. Rev. Lett. 2009;102:198104. doi: 10.1103/PhysRevLett.102.198104. [DOI] [PMC free article] [PubMed] [Google Scholar]
- 15.Ciandrini L, Stansfield I, Romano M. Role of the particle’s stepping cycle in an asymmetric exclusion process: a model of mRNA translation. Phys. Rev. E. 2010;81(Pt 1):051904. doi: 10.1103/PhysRevE.81.051904. [DOI] [PMC free article] [PubMed] [Google Scholar]
- 16.You T, Coghill G, Brown A. A quantitative model for mRNA translation in Saccharomyces cerevisiae. Yeast. 2010;27:785–800. doi: 10.1002/yea.1770. [DOI] [PubMed] [Google Scholar]
- 17.Berthelot K, Muldoon M, Rajkowitsch L, Hughes J, McCarthy J. Dynamics and processivity of 40S ribosome scanning on mRNA in yeast. Mol. Microbiol. 2004;51:987–1001. doi: 10.1046/j.1365-2958.2003.03898.x. [DOI] [PubMed] [Google Scholar]
- 18.Chu D, Barnes D, von der Haar T. The role of tRNA and ribosome competition in coupling the expression of different mRNAs in Saccharomyces cerevisiae. Nucleic Acids Res. 2011;39:6705–6714. doi: 10.1093/nar/gkr300. [DOI] [PMC free article] [PubMed] [Google Scholar]
- 19.Gillespie D. Exact stochastic simulation of coupled chemical reactions. J. Phys. Chem. 1977;81:2340–2361. [Google Scholar]
- 20.Fluitt A, Pienaar E, Viljoen H. Ribosome kinetics and aa-tRNA competition determine rate and fidelity of peptide synthesis. Comput. Biol. Chem. 2007;31:335–346. doi: 10.1016/j.compbiolchem.2007.07.003. [DOI] [PMC free article] [PubMed] [Google Scholar]
- 21.Gromadski K, Rodnina M. Kinetic determinants of high-fidelity tRNA discrimination on the ribosome. Mol. Cell. 2004;13:191–200. doi: 10.1016/s1097-2765(04)00005-x. [DOI] [PubMed] [Google Scholar]
- 22.Livingstone M, Atas E, Meller A, Sonenberg N. Mechanisms governing the control of mRNA translation. Phys. Biol. 2010;7:021001. doi: 10.1088/1478-3975/7/2/021001. [DOI] [PubMed] [Google Scholar]
- 23.Heinrich R, Rapoport TA. Mathematical modelling of translation of mRNA in eucaryotes; steady state, time-dependent processes and application to reticulocytes. J. Theor. Biol. 1980;86:279–313. doi: 10.1016/0022-5193(80)90008-9. [DOI] [PubMed] [Google Scholar]
- 24.Jackson R, Hellen C, Pestova T. The mechanism of eukaryotic translation initiation and principles of its regulation. Nat. Rev. Mol. Cell Biol. 2010;11:113–127. doi: 10.1038/nrm2838. [DOI] [PMC free article] [PubMed] [Google Scholar]
- 25.Hinnebusch AG. Molecular mechanism of scanning and start codon selection in eukaryotes. Microbiol. Mol. Biol. Rev. 2011;75:434–467. doi: 10.1128/MMBR.00008-11. [DOI] [PMC free article] [PubMed] [Google Scholar]
- 26.Frank J, Gonzalez R. Structure and dynamics of a processive Brownian motor: the translating ribosome. Ann. Rev. Biochem. 2010;79:381–412. doi: 10.1146/annurev-biochem-060408-173330. [DOI] [PMC free article] [PubMed] [Google Scholar]
- 27.Messenguy F, Delforge J. Role of transfer ribonucleic acids in the regulation of several biosyntheses in Saccharomyces cerevisiae. Eur. J. Biochem. 1976;67:335–339. doi: 10.1111/j.1432-1033.1976.tb10696.x. [DOI] [PubMed] [Google Scholar]
- 28.McLaughlin C, Magee P, Hartwell L. Role of isoleucyl-transfer ribonucleic acid synthetase in ribonucleic acid synthesis and enzyme repression in yeast. J. Bacteriol. 1969;100:579–584. doi: 10.1128/jb.100.2.579-584.1969. [DOI] [PMC free article] [PubMed] [Google Scholar]
- 29.Hartwell L, McLaughlin C. Mutants of yeast with temperature-sensitive isoleucyl-tRNA synthetases. Proc. Natl Acad. Sci. USA. 1968;59:422–428. doi: 10.1073/pnas.59.2.422. [DOI] [PMC free article] [PubMed] [Google Scholar]
- 30.Zhang G, Fedyunin I, Miekley O, Valleriani A, Moura A, Ignatova Z. Global and local depletion of ternary complex limits translational elongation. Nucleic Acids Res. 2010;38:4778–4787. doi: 10.1093/nar/gkq196. [DOI] [PMC free article] [PubMed] [Google Scholar]
- 31.Greulich P, Ciandrini L, Allen R, Romano M. Mixed population of competing totally asymmetric simple exclusion processes with a shared reservoir of particles. Phys. Rev. E. 2012;85:011142. doi: 10.1103/PhysRevE.85.011142. [DOI] [PMC free article] [PubMed] [Google Scholar]
- 32.Blythe R, Evans M. Nonequilibrium steady states of matrix-product form: a solver’s guide. J. Phys. A: Math. Theor. 2007;40:R333. [Google Scholar]
- 33.Varenne S, Lazdunski C. Effect of distribution of unfavourable codons on the maximum rate of gene expression by an heterologous organism. J. Theor. Biol. 1986;120:99–110. doi: 10.1016/s0022-5193(86)80020-0. [DOI] [PubMed] [Google Scholar]
- 34.Aebi M, Kirchner G, Chen JY, Vijayraghavan U, Jacobson A, Martin NC, Abelson J. Isolation of a temperature-sensitive mutant with an altered tRNA nucleotidyltransferase and cloning of the gene encoding tRNA nucleotidyltransferase in the yeast Saccharomyces cerevisiae. J. Biol. Chem. 1990;265:16216–16220. [PubMed] [Google Scholar]
- 35.Aoyagi Y, Tasaki I, Okumura J, Muramatsu T. Energy cost of whole-body protein synthesis measured in vivo in chicks. Comp. Biochem. Physiol. A Comp. Physiol. 1988;91:765–768. doi: 10.1016/0300-9629(88)90962-0. [DOI] [PubMed] [Google Scholar]
- 36.Bhargava P, Kassavetis GA. Abortive initiation by Saccharomyces cerevisiae RNA polymerase III. J. Biol. Chem. 1999;274:26550–26556. doi: 10.1074/jbc.274.37.26550. [DOI] [PubMed] [Google Scholar]
- 37.Birse CE, Minvielle-Sebastia L, Lee BA, Keller W, Proudfoot NJ. Coupling termination of transcription to messenger RNA maturation in yeast. Science. 1998;280:298–301. doi: 10.1126/science.280.5361.298. [DOI] [PubMed] [Google Scholar]
- 38.Cherry JM, Hong EL, Amundsen C, Balakrishnan R, Binkley G, Chan ET, Christie KR, Costanzo MC, Dwight SS, Engel SR, et al. Saccharomyces Genome Database: the genomics resource of budding yeast. Nucleic Acids Res. 2012;40:D700–D705. doi: 10.1093/nar/gkr1029. [DOI] [PMC free article] [PubMed] [Google Scholar]
- 39.Ciganda M, Williams NC. Eukaryotic 5S rRNA biogenesis. Wires RNA. 2011;2:523–533. doi: 10.1002/wrna.74. [DOI] [PMC free article] [PubMed] [Google Scholar]
- 40.Czerwoniec A, Dunin-Horkawicz S, Purta E, Kaminska KH, Kasprzak JM, Bujnicki JM, Grosjean H, Rother K. MODOMICS: a database of RNA modification pathways. 2008 update. Nucleic Acids Res. 2009;37:D118–D121. doi: 10.1093/nar/gkn710. [DOI] [PMC free article] [PubMed] [Google Scholar]
- 41.Dheur S, Nykamp KR, Viphakone N, Swanson MS, Minvielle-Sebastia L. Yeast mRNA Poly(A) tail length control can be reconstituted in vitro in the absence of Pab1p-dependent Poly(A) nuclease activity. J. Biol. Chem. 2005;280:24532–24538. doi: 10.1074/jbc.M504720200. [DOI] [PubMed] [Google Scholar]
- 42.Fatica A, Tollervey D. Making ribosomes. Curr. Opin. Cell Biol. 2002;14:313–318. doi: 10.1016/s0955-0674(02)00336-8. [DOI] [PubMed] [Google Scholar]
- 43.Gu W, Jackman JE, Lohan AJ, Gray MW, Phizicky EMC. tRNAHis maturation: an essential yeast protein catalyzes addition of a guanine nucleotide to the 5′ end of tRNAHis. Genes Dev. 2003;17:2889–2901. doi: 10.1101/gad.1148603. [DOI] [PMC free article] [PubMed] [Google Scholar]
- 44.Hage AE, Tollervey D. A surfeit of factors: why is ribosome assembly so much more complicated in eukaryotes than bacteria? RNA Biol. 2004;1:10–15. [PubMed] [Google Scholar]
- 45.Ikeuchi Y, Kitahara K, Suzuki TC. The RNA acetyltransferase driven by ATP hydrolysis synthesizes N4-acetylcytidine of tRNA anticodon. EMBO J. 2008;27:2194–2203. doi: 10.1038/emboj.2008.154. [DOI] [PMC free article] [PubMed] [Google Scholar]
- 46.Juhling F, Morl M, Hartmann RK, Sprinzl M, Stadler PF, Putz JC. tRNAdb 2009: compilation of tRNA sequences and tRNA genes. Nucleic Acids Res. 2009;37:D159–D162. doi: 10.1093/nar/gkn772. [DOI] [PMC free article] [PubMed] [Google Scholar]
- 47.Miura F, Kawaguchi N, Sese J, Toyoda A, Hattori M, Morishita S, Ito TC. A large-scale full-length cDNA analysis to explore the budding yeast transcriptome. Proc. Natl Acad. Sci. USA. 2006;103:17846–17851. doi: 10.1073/pnas.0605645103. [DOI] [PMC free article] [PubMed] [Google Scholar]
- 48.Nagalakshmi U, Wang Z, Waern K, Shou C, Raha D, Gerstein M, Snyder MC. The transcriptional landscape of the yeast genome defined by RNA sequencing. Science. 2008;320:1344–1349. doi: 10.1126/science.1158441. [DOI] [PMC free article] [PubMed] [Google Scholar]
- 49.Piekna-Przybylska D, Decatur WA, Fournier MJC. New bioinformatic tools for analysis of nucleotide modifications in eukaryotic rRNA. RNA. 2007;13:305–312. doi: 10.1261/rna.373107. [DOI] [PMC free article] [PubMed] [Google Scholar]
- 50.Qian Q, Curran JF, Bjork GRC. The methyl group of the N6-methyl-N6-threonylcarbamoyladenosine in tRNA of Escherichia coli modestly improves the efficiency of the tRNA. J. Bacteriol. 1998;180:1808–1813. doi: 10.1128/jb.180.7.1808-1813.1998. [DOI] [PMC free article] [PubMed] [Google Scholar]
- 51.Wang Y, Liu CL, Storey JD, Tibshirani RJ, Herschlag D, Brown POC. Precision and functional specificity in mRNA decay. Proc. Natl Acad. Sci. USA. 2002;99:5860–5865. doi: 10.1073/pnas.092538799. [DOI] [PMC free article] [PubMed] [Google Scholar]
Associated Data
This section collects any data citations, data availability statements, or supplementary materials included in this article.