Abstract
In aqueous solutions, in the presence of double-stranded DNA, chlorophyllin (CHL) forms complexes with each of the three DNA intercalators: acridine orange (AO), quinacrine mustard (QM), and doxorubicin (DOX). The evidence for these interactions was obtained by measurement changes in the absorption and fluorescence spectra of the mixtures containing DNA and intercalators during titration with CHL. A model of simple competition between DNA and CHL for the intercalator was used to define the measured interactions. The concentrations of the complexes estimated based on this model were consistent with the concentrations obtained by actual measurement of the absorption spectra.
The present data provide further support for the role of chlorophyllin as an “interceptor” that may neutralize biological activity of aromatic compounds including mutagens and antitumor drugs.
Keywords: Chlorophyllin, Intercalators, Acridine orange, Quinacrine mustard, Doxorubicin, Interceptors, Competitive interactions, Absorption, Fluorescence
1. Introduction
There is strong evidence that chlorophyllin (CHL), a water-soluble derivative of chlorophyll in which magnesium in center of the molecule is replaced by copper, has anti-mutagenic and anti-carcinogenic properties. Anti-mutagenic activity of CHL was demonstrated with respect to heterocyclic amines [1–3], benzo[a]pyrene [4,5], aflatoxin [6–10], heavy metals [11], and ionizing radiation [12]. Diversity of the agents whose antimutagenic activity was neutralized by CHL points out that different protective mechanisms may be involved. One mechanism is the ability of CHL to form complexes with the aromatic mutagens [13–15]. Formation of the complex of CHL with mutagen leads to reduction of concentration of mutagen in its monomeric form and thereby of its activity. Thus, CHL captures mutagen particles in the complexes and neutralizes them preventing their interaction with DNA. It was proposed to define the agents with such properties as the interceptor molecules [16].
We have previously shown that CHL forms complexes with three DNA intercalators, acridine orange (AO), quinacrine mustard (QM) and doxorubicin (DOX), with association constant 7.0×10⁵, 3.2×10⁵ and 3.3×10⁵ M−1, respectively [17]. The present study is a continuation of this earlier investigation and was aimed to further characterize molecular interactions by which CHL intercepts these intercalators. The interactions have been investigated within the three-component interactive system: intercalator–DNA–CHL.
2. Experimental
2.1. Reagents
CHL (sodium–copper salt), AO (CI 46005; 3,6-bis[dimethylamino]acridine hydrochloride, QM (2-metoxy-6-chloro-9-[4 (β-chloroethyl)amino-1-methylbutylamino] acridine), DOX, calf thymus DNA (all from Sigma Chemical Co, St. Louis, MO, USA); Tris (Tris-(hydroksymethyl)-aminomethane) (Fluka Chemie AG, Buchs, Switzerland); and HCl (PPH Polskie Odczynniki Chemiczne, Gliwice, Poland).
2.2. Solutions
All solutions were made in 30 mM Tris–HCl pH 7.4 buffer at ionic strength 0.04 M adjusted with sodium chloride. Solutions were prepared at low AO, QM and DOX concentrations to decrease formation of dimers and higher aggregates of these intercalators; the possible effects of dimerization, therefore, could be neglected in the calculations, and the assumption was made that AO, QM and DOX were present in the solutions in monomeric form only. Solutions of AO, QM, DOX and CHL were made freshly before measurements; their concentration was checked spectrophotometrically. The molar absorption coefficients, at maximal absorption, were accepted as: ε (492 nm) =61260 M−1 cm−1, ε(422 nm) =8050 M−1 cm−1, ε(479 nm) =7700 M−1 cm−1 and ε e(402 nm) =33430 M−1 cm−1 for AO, QM, DOX and CHL, respectively. Solutions were stable during all titrations; their stability and DNA concentration was determined spectrophotometrically just prior to each series of measurement. DNA concentration was calculated as nucleotide molarity accepting ε (260 nm) =6600 M−1 cm−1 molar absorptivity [18]. Purity of DNA was tested by measuring A260/A280, which according to Amutha et al. [19] has to be >1.8; the A260/A280 used in this study was within the range 1.9–2.0.
2.3. Measurements
The spectrophotometric (Cary 300-Varian, Australia) and spectrofluorometric (LS 50B-Perkin Elmer, UK) methods have been used. The measurements were carried out at the following combinations: (i) intercalator–DNA; (ii) CHL–DNA, and (iii) intercalator–DNA–CHL at the concentration ranges: 1×10⁻⁶–2×10⁻⁵ M, 1× 10⁻⁵−7.5×10⁻⁵ M, 5×10⁻⁷−3×10⁻⁶ M, 4×10⁻⁶−7×10⁻⁶ M, and 6×10⁻⁶−8×10⁻⁶ M for CHL, DNA, AO, QM and DOX, respectively, at 20 °C. Absorption measurements were done in 0.2–5.0 cm width cuvettes. Fluorescence was measured using the 5 nm excitation-, and 5, 10 and 15 nm width emission-slit for mixtures containing AO, QM or DOX, respectively. The data were processed using Prism 4 (GraphPad Software Inc, San Diego, CA, USA).
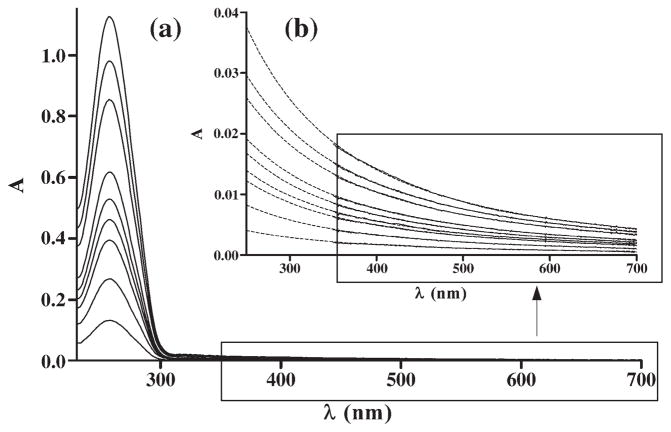
Because large DNA particles scatter light which leads to a decrease in intensity of light at the wavelength at which the absorption is being measured, during analysis of spectra of solutions containing DNA a correction for light scattering has been made. This absorbance, which can be measured at 350–700 nm range, i.e. at the wavelength at which DNA does not absorb light, grows linearly with rise in DNA concentration and it has a characteristic exponential shape depending on wavelength. For the spectral parts between 350 and 700 nm, a correction was made according to formula (1) [20], extrapolating to 250 nm.
| (1) |
where S(λ) – a contribution due to light scattering, λ –wavelength, a and b are adjustable parameters.
Fig. 1 shows absorption spectra of DNA and the contributing effect of light scattering. The correction factor for light scattering has been established during initial measurements of DNA solutions and was used to compensate for light absorption for all absorption spectra of the solutions containing DNA subsequently measured.
Fig. 1.
Absorption spectra of DNA (l=1 cm). The contribution of light scattering to the measured absorption (l=1 cm) is shown in (b). DNA concentration range was 9.5×10⁻⁶−8.5×10⁻⁵ Mbp. Solid lines: experimentally measured absorption within this spectral range; broken lines: approximation according to Eq. (1) extrapolated to 250 nm.
2.4. Determination of the association constant within the two-component system: intercalator–DNA
The McGhee–von Hippel [21] model was used to estimate intrinsic association constant Ki of the ligand (intercalator) with the polymer (DNA) and exclusion parameter n expressed by number of base pairs [Eq. (2)].
| (2) |
where , CID – concentration of DNA-bound intercalator, CI – free intercalator concentration; CD– DNA concentration (bp); n – exclusion parameter; Ki – intrinsic association constant.
The parameters characterizing intercalator–DNA interactions were determined using two approaches. The first approach was based on analysis of absorption spectra of intercalator–DNA complexes: the effects of simulated changes in Ki, n and molar absorptivity on the spectra were compared and approximated to the actually measured spectra using the least squares curve fitting approach. The spectral segments at which the intercalator and intercalator–DNA complexes but not DNA absorbs light were used. The second approach was based on fitting of the plot obtained from Eq. (2) to the data acquired from the measurements of absorption and fluorescence spectra. Taking an advantage of the absorption spectrum, the values of absorbance at the following wavelengths were used: for DNA with AO 492 nm; for DNA with QM 424 nm; and for DNA with DOX 479 nm. Concentrations of the free and bound ligand were determined according to Eq. (3) and Eq. (4). The εID(λ) values were obtained from extrapolation the spectra to completely bounded intercalator. These values were: 46,000, 4000 and 6700 M−1 cm−1 for AO–DNA, QM–DNA and DOX–DNA, respectively.
| (3) |
| (4) |
where εS(λ) – molar absorption coefficient of the mixture of intercalator with DNA; εI(λ) – molar absorption coefficient of the intercalator; εID(λ) – molar absorption coefficient of the DNA-bound intercalator; CI,0 – total concentration of the intercalator.
CI and CID were also determined from fluorescence spectra at 526, 498.5 and 595.5 nm for AO, QM and DOX, respectively, according to Eq. (5).
| (5) |
where f(λ) – spectrum of the mixture of intarcalator with DNA; fI(λ) – spectrum of the free intercalator; fID(λ) – spectrum of the DNA-bound intercalator; all spectra were normalized to unit concentration; the other variables are as in the earlier shown equations.
2.5. Estimation of concentration of the complexes intercalator–DNA and intercalator–CHL in the three-component systems
The binding equilibrium may be written:
Concentrations of the components of the mixtures were determined by iterative method using the least squares curve fitting approach to the measured absorption spectra. Assumption was made that within the measured spectral segment four chromophores contribute to the absorption: (a) free intercalator; (b) free CHL; (c) intercalator–DNA complex; and (d) intercalator–CHL complex, whose molar coefficients of absorption were determined earlier, in the independent experiments [17]. To confirm whether the concentration estimates by absorption were correct, the fluorescence emission spectra were calculated at the determined concentrations [Eq. (6)], and compared with the directly measured emission spectra.
| (6) |
The determined concentrations were compared with the concentrations calculated under the assumption that association constants, Ka, representing binding of the intercalator to CHL, determined by us before [17], Ki and n parameter, determined in the independent two-component experiments, are the same as in the three component system. In this case, the interactions between the intercalator and CHL as well as between intercalator and DNA are independent of each other. The increase in CHL concentration shifts the equilibrium in such a way that greater portion of free intercalator will bind to CHL while the portion of DNA-bound intercalator will dissociate from DNA.
Concentrations of intercalator–CHL and intercalator–DNA complexes were determined from the Eqs. (7) and (8),
| (7) |
| (8) |
where CC,0 – total concentration of CHL; CIC – concentration of intercalator–CHL complex; other parameters as in the earlier equations.
3. Results
3.1. CHL–DNA interactions
Titration of DNA with CHL indicated that CHL either does not interact with DNA or that the interactions are too weak to be detected by absorption changes within the tested concentrations.
3.2. Intercalator–DNA interactions
Progressive changes in absorption and fluorescence spectra were observed during titration as a function of the increased DNA concentration. In the absorption spectra of AO, the increase in DNA concentration led to a gradual decrease of the band representing free-intercalator (max at 492 nm) and the appearance of the band characterizing DNA-bound AO (max at 502 nm). This is evident by comparing the spectrum of AO with the AO bound to DNA (Fig. 2). Likewise, hypochromic and bathochromic shifts were seen in the bands of the mixtures of QM or DOX with DNA, with respect to the spectra of each intercalator alone (Fig. 2). Intensity of AO fluorescence rose with the rise of DNA concentration whereas fluorescence of QM and DOX was quenched by DNA. Concurrently, the shape of the fluorescence spectra of AO and QM changed – the bands become narrower and the maximum was shifting towards lower wavelength. In the case of DOX, the shape of fluorescence spectrum did not change.
Fig. 2.
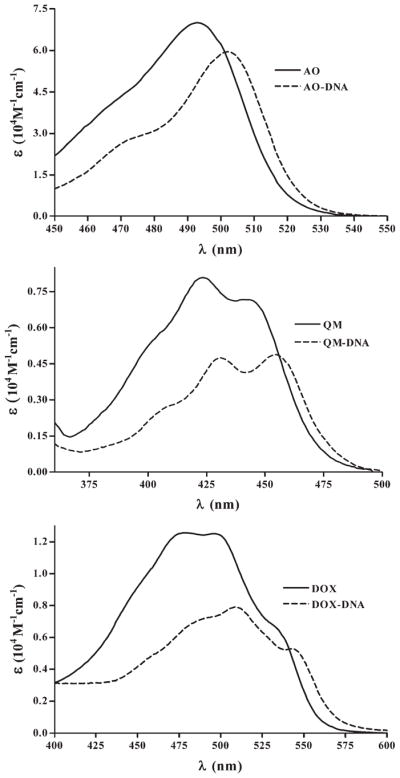
Absorption spectra of the studied intercalators, free in solution, and in complexes with DNA.
Table 1 presents the parameters characterizing intercalator–DNA interactions determined by fitting the plot obtained from Eq. (2) to the data acquired from the absorption and fluorescence spectra measurements. Parameters Ki and n obtained from the least square fitting of the spectra yield comparable results.
Table 1.
Ki and n parameters in interactions of the studied intercalators with DNA estimated based on Eq. (2)
| Intercalator | n | S.E. | Ki (M−1) | S.E. (M−1) |
|---|---|---|---|---|
| AO | 2.8 | 0.2 | 2.4×10⁵ | 0.1×10⁵ |
| QM | 1.7 | 0.1 | 2.7×10⁵ | 0.2×10⁵ |
| DOX | 1.8 | 0.1 | 2.9×10⁵ | 0.3×10⁵ |
3.3. Qualitative analysis of the spectra of mixtures of the three components: intercalator–DNA–CHL
The pilot tests have been done in which the individual components were admixed with each other in different sequence. The measurements of absorption and fluorescence indicated that shape of the spectra and band intensity were the same regardless whether DNA or CHL were added first to the solution containing intercalator. It indicates that the equilibrium was rapidly established and binding of intercalator to DNA or CHL was reversible.
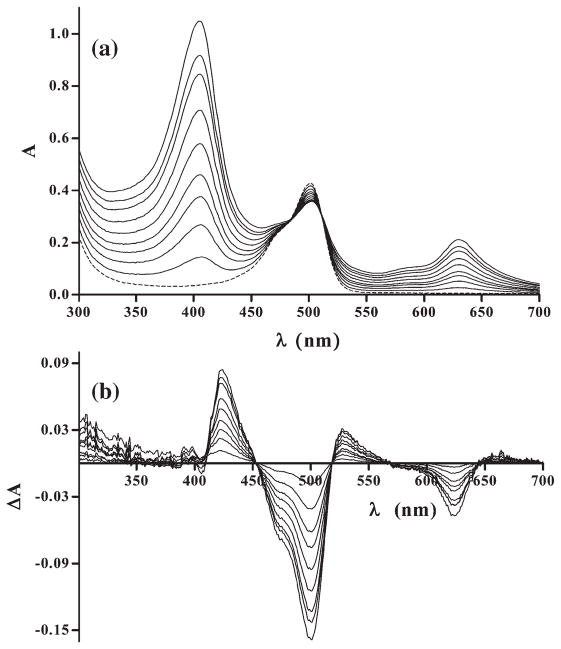
In the absorption spectra of the mixture of AO, DNA and CHL the increase in CHL concentration led to a decrease in intensity of the band at a peak between 492 nm (max for AO) and 502 nm (max for AO–DNA complex) (Fig. 3a). The observed change is related to the change in absorption spectrum of AO titrated with CHL [17]. Comparison of the differential spectra (Fig. 3b) indicated on the appearance, and then on increase, in concentration of the AO–CHL complex, during the subsequent steps of titration. This change was consistent with a shift of the band from maximum at 628 nm by about 3–4 nm towards longer wavelength observed at low CHL concentration (1−2×10⁻⁶ M). At higher CHL concentration the band shift effect was masked by the presence of free CHL. Analogous changes were seen in the case of mixtures with QM and DOX, although the effects were less pronounced due to lower absorbance of QM and DOX compared to CHL.
Fig. 3.
Absorption spectra of mixtures of AO and DNA (broken line) and of AO, DNA, and CHL (solid lines) (a). AO and DNA were at 2.8×10⁻⁶ M and 5×10⁻⁵ Mbp concentration, respectively, while CHL concentration varied from 1.0×10⁻⁶ to 1.0×10⁻⁵ M, each step by 1.0×10⁻⁶ M, from bottom to top; l=3 cm. Respective differential spectra are shown in (b).
Fluorescence quenching was observed after addition of CHL in all three cases of titration. We have shown before that complexes of the studied intercalators with CHL do not fluoresce [17]. Taking this into account, the plausible explanation for the observed quenching of fluorescence in the three-component mixtures is a decline in concentration of intercalator–DNA complex. This conclusion is in concordance with the analysis of absorption spectra, showing that the formation and increase in concentration of the intercalator–CHL complex is paralleled by a decrease of concentration the intercalator–DNA complex.
3.4. Quantitative analysis of the spectra of three-component mixtures: intercalator–DNA–CHL
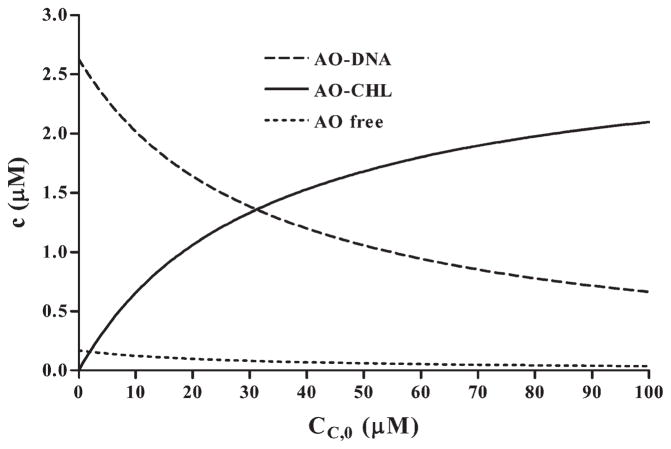
We determined concentration of the interacting constituents in the three-component mixtures based on the association constants Ka of the intercalator–CHL [17], Ki and n parameters of interactions between intercalator and DNA established in the independent experiments and initial (total) concentrations of the reactive reagents. Fig. 4 presents changes in concentration of the complexes and free intercalator taking place in the mixtures of AO, DNA and CHL. The calculated changes of concentration of the complexes and free intercalator were of similar nature within the mixtures containing QM and DOX as with AO. Namely, a decrease in concentration of the DNA-bound intercalators, an increase in concentration of intercalator–CHL complex and a modest decrease in concentration of free intercalator, were seen. In all cases, when the initial conditions were the same as in the series of the carried out measurements, by extrapolating CHL concentration to 10−3 M, most intercalator was in the complex with CHL.
Fig. 4.
Changes in concentration of individual constituents in the three-component mixture as a function of change in CHL concentration, determined assuming the simple competition model, on example of AO as the intercalator. Concentrations of AO and DNA were 2.8×10⁻⁶ M and 7.5×10⁻⁵ Mbp, respectively, while Ka, Ki and n parameter were 8.4×10⁵ M−1, 2.4×10⁵ M−1 and 2.8, respectively.
Concentrations of free intercalators and their complexes were estimated in the mixtures using the iterative procedure of the least squares. However, we were unable to use the fluorescence spectra for the same purpose because the differences between the shapes of spectra of AO and QM vs. AO–DNA and QM–DNA complexes, respectively, were too small, and in the case of DOX no difference in the shape of spectra between DNA-bound and free DOX was observed.
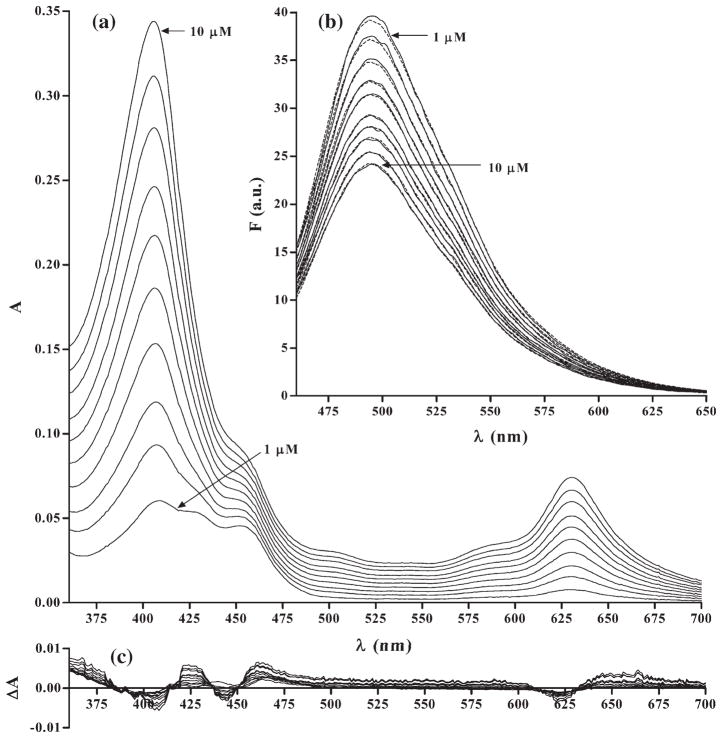
The correctness of the estimates of chromophore concentrations based on the analysis of absorption spectra was confirmed by spectral analysis of fluorescence. Towards this end their fluorescence spectra were determined based on the concentrations determined from the absorption spectra, and compared with the actually measured fluorescence spectra. Fig. 5 presents comparison of absorption spectra and the residual differences remaining after the fitting procedure, on the example of analysis of QM. As it is evident, concentrations of individual chromo-phore reactants estimated from absorption spectra were consistent with the fluorescence data, which provides additional assurance that the estimates of their concentration were not significantly biased.
Fig. 5.
Absorption spectra of three-component QM–DNA–CHL mixtures (l=1 cm) (a). Experimentally obtained fluorescence spectra of the same mixtures (solid lines) and respective fluorescence spectra estimated from the concentrations calculated based on the absorption spectra (broken lines) (b). Residuals remaining after iterative fit using least squares approach (c). QM and DNA were at 8×10⁻⁶ M and 4.5×10⁻⁵ Mbp concentration, respectively, while CHL concentration varied from 1.0×10⁻⁶ to 1.0×10⁻⁵ M, each step by 1.0×10⁻⁶ M, selected concentrations are indicated by arrows.
Concentrations of the components determined based on assumption that association constants Ka, Ki and n parameter determined in the independent two-component experiments are the same as in the three-component system, were compared with the concentrations determined using least squares iterative fitting of the absorption spectra (Fig. 6). It was observed that concentrations of the intercalator–CHL complexes determined by the measured absorption spectra were somewhat higher compared with these acquired by computing, based on the data obtained from two-component systems. The differences, however, are within statistical confidence limits which indicate that the model of simple competition could be applied in the present experiments, and was providing consistent results.
Fig. 6.
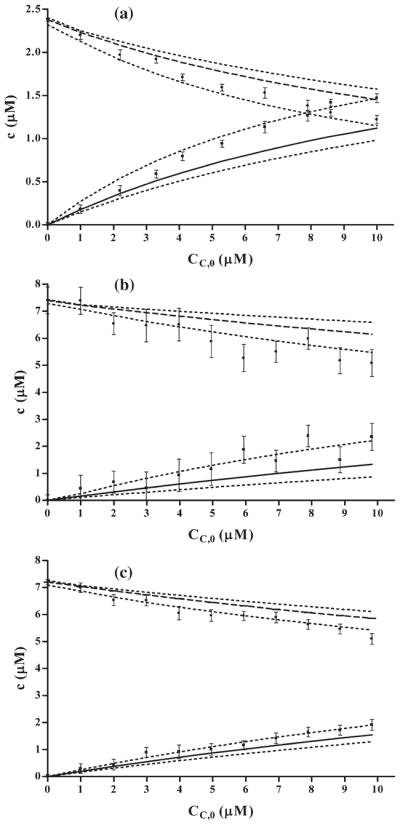
Comparison of concentrations of intercalator–DNA and intercalator–CHL complexes calculated based on data from two-component systems (solid lines – intercalator–CHL, dashed lines – intercalator–DNA complexes, dotted lines illustrate confidence limits in concentration estimates resulting from uncertainty of Ka, Ki and n parameter estimates), and from iterative least squares fit to absorption spectra (dots – intercalator–DNA, squares –intercalator–CHL complexes, respectively). (a) AO–DNA–CHL mixtures, concentrations of AO and DNA were 2.8×10⁻⁶ M and 3.25×10⁻⁵ Mbp, respectively, (b) DOX–DNA–CHL mixtures, concentrations of DOX and DNA were 8×10⁻⁶ M and 3×10⁻⁵ Mbp, respectively, (c) QM–DNA–CHL mixtures, concentrations of QM and DNA were 8 × 10⁻⁶ M and 4.5×10⁻⁵ Mbp, respectively.
4. Discussion
4.1. Intercalator–DNA system
The observed changes in absorption and fluorescence spectra of the intercalators upon their addition into DNA solutions are characteristic of the intercalative mechanism of their binding. Similar changes were seen by other authors who studied DNA interactions with a variety of different intercalators [18,19,22,23].
Association constant Ki of intercalator binding to DNA depends on ionic strength of the solution, decreasing with rise of the latter [24,25]. Because buffers of relatively low ionic strength were used in this study it was expected that the association constants of the intercalators with DNA will be somewhat higher compared with the data in literature where the binding was studied at higher salt concentration.
Our present estimates of AO binding to DNA (Ki =2.4×10⁵, and n=2.8) are consistent with earlier data [25]. Likewise, the absorption and fluorescence spectra of the AO–DNA complexes presented here are consistent with the spectra reported by these authors. It should be noted, however, that the effect of autoassociation of AO was neglected in the present study because of its relatively low concentration.
In the case of interactions between DOX and DNA, Messori et al. [26], using spectrophotometric methods, determined Ki =3.3×10⁶ M−1 and n=3.8, in BPES buffer at pH 7.0 and 0.185 M NaCl. Under the same ionic conditions, and also using spectrophotometric methods, Chaires et al. [24] found Ki = 7 × 10⁵ M−1 and n = 3.5 for binding of daunamycin (daunarubicin) to DNA. Because the structure of daunamycin is similar to that of DOX (in daunorubicin the proton – while in DOX hydroxyl group – is at C14), one would expect similarity in their binding to DNA. Like in the case of DOX–DNA and AO–DNA, the Ki for daunamycin–DNA was decreasing at higher ionic strength [24].
The values of association constant Ki as well as the n parameter for DOX–DNA interactions obtained by us (Table 1) are somewhat lower compared to the data in the literature cited above. As mentioned, this may be due to the differences in ionic strength and buffer composition. However, the absorption spectrum of DNA–DOX presented by us is strikingly similar to the one reported by other authors [24,27]. Similar to our findings, Angeloni et al. [27] observed distinct decrease in intensity of DOX fluorescence upon binding to DNA. They do not mention, however, whether or not the binding affected the shape of fluorescence spectrum.
Interactions of QM with mono- and polynucleotides were studied by Selander [28]. The author indicates on affinity of QM to guanine reflected by quenching of QM fluorescence upon binding to polynucleotides with high GC content. Using electroluminescence method Jennings and Ridler [29] found that QM intercalates into DNA in a similar manner as ethidium bromide, which is considered a classical model of intercalation. However, we were unable to find in the literature the spectral data and interaction constants of QM binding to DNA. Furthermore, it is difficult to assess whether QM binding is reversible because this intercalator is also known to bind covalently to DNA [30]. QM was used in studies of CHL and caffeine as the “interceptors” neutralizing biological activity of aromatic mutagens; CHL protected HL-60 and MCF-7 cells from QM but not from nitrogen mustard, the latter having similar chemical reactive moiety as QM but lacking the aromatic structure [31,32].
The observed differences between the studied intercalators in the exclusion parameter n may reflect the difference in the change of conformational (topological) structure in the DNA adjacent to the site of the intercalation, modulated by the intercalator, which may alter a capability to accommodate a subsequent intercalating molecule [33].
4.2. The three-component system: intercalator–DNA–CHL
Spectrophotometric analysis of the three-component system is difficult because of complexity of possible interactions. In solutions containing AO, CHL and DNA, even when formation of aggregates of higher orders is neglected, the following interactions can be expected: AO–AO, CHL–CHL, AO–CHL, AO–DNA and CHL–DNA. This leads to a possibility of the presence of eight types of chromophores. However, the investigations of the individual components combined with the data obtained in two-component systems, and with the literature data, taken collectively, allowed us to accept the following assumptions which simplified analysis of the experimental data:
The possibility of auto-aggregation of CHL was neglected based on the evidence that absorption spectra of CHL do not change with its concentration [17].
The autoassociation effects [25,34,35] could be neglected because the intercalators were studied at low concentrations. The lack of autoassociation at these concentrations was confirmed in independent measurements.
Within the tested concentrations, either the CHL did not interact with DNA or the interactions were so weak that they did not affect the absorption spectra, as shown by the independent experiment.
Acceptance of these assumptions decreased the number of possible types of chromophores in the mixtures to five. Additionally, since DNA does not absorb at the wavelength at which the measurement were done (350–700 nm), the number of types of light absorbing chromophores can be reduced to four. Furthermore, because at the presently used excitation wavelength DNA, CHL and CHL–intercalator complexes do not show measurable fluorescence [17], only two chromophores, namely the free intercalator and DNA-bound intercalator, contributed to the fluorescence spectrum of the three-component mixture.
The model of simple competition between DNA and CHL for the intercalator used in the present study was found to be accurate within the confidence limits of the obtained results (Fig. 6). For each of the intercalator studied the results show distinct decrease of the intercalator–DNA complex concentration as a function of the increase in CHL concentration. The decrease, however, was somewhat more pronounced than that expected from the simple competition model. This discrepancy may be due to a change in affinity of the intercalator binding in the presence of CHL. It is also possible that the presence of DNA in the solution will affect the affinity of intercalators to CHL. Although we were unable to observe the measurable effect that would indicate on CHL–DNA interactions, the spectroscopic results of Neault and Tajmir–Riahi [36] indicate that CHL is an external DNA binder with no affinity for DNA intercalation. The binding constant of CHL to DNA determined by these authors was orders of magnitude lower than compared to Ki estimated by us for binding of AO, QM or DOX to DNA. It cannot be formally excluded, however, that the external binding of CHL to DNA may affect accessibility and affinity of the binding sites in DNA to intercalators.
It should be noted that the McGee–von Hippel model was used by us in both approaches of the intercalating ligand binding determination. In the “classic” model we have determined concentrations based on the changes in absorption and fluorescence for a given wavelength and fitted it to the McGhee–von Hippel plot. In the iterative approach we have estimated K and n, and the absorption spectra obtained based on this estimate were fitted to the actual measurements. Thus, although in both approaches the same model was applied, the computation methods were different yielding results that were consistent between the approaches.
The published data on interactions in three-component system are scarce, perhaps reflecting complexity of this type of analysis. An attempt to reveal the interactions within the caffeine, AO and DNA system although led to rather limited quantitative solutions, demonstrated that caffeine can function as “interceptor” of AO suppressing its intercalative binding to DNA [37]. The authors neither introduced any specific model nor measured the binding constants, but expressed the equilibrium binding as a sum of constants of all possible interactions within the system.
Using NMR methodology and applying the two-component model Davies et al. [38] investigated interactions between caffeine, intercalating agents with aromatic structure and single-and double-stranded DNA oligomers. To describe the interactions they applied, the model of competition between DNA and caffeine for the intercalator. This model, however, was not compared with the experimental data.
The model of simple competition was used to analyze interactions of two intercalators, daunamycin and ethidium bromide, between themselves and with DNA, measured by spectroscopic methods [39]. The assumption was made that daunamycin and ethidium compete with each other for binding sites in DNA. The results were consistent with the applied model [39].
Our present data and the methodology models, validated by the above discussed specifics from the literature, allow us to conclude that CHL competes with DNA for binding of free intercalator. The model of simple competition in the intercalator–DNA–CHL system, thus, provides a good approximation of the changes in concentration of the intercalator–DNA in the presence of CHL. Our data thus provide further support for the role of chlorophyllin as an “interceptor” that may neutralize biological activity of aromatic compounds including mutagens and antitumor drugs.
Acknowledgments
Supported by BST 0706-802 (ZW) and by NIH NCI CA 28 704 (ZD).
References
- 1.Dashwood RH, Guo D. Inhibition of 2-amino-3-methylimidazo[4,5-f] quinoline (IQ)–DNA binding by chlorophyllin: studies of enzyme inhibition and molecular complex formation. Carcinogenesis. 1992;13:1121–1126. doi: 10.1093/carcin/13.7.1121. [DOI] [PubMed] [Google Scholar]
- 2.Dashwood RH, Guo D. Antimutagenic potency of chlorophyllin in the Salmonella assay and its correlation with binding constants of mutagen–inhibitor complexes. Environ Mol Mutagen. 1993;22:164–171. doi: 10.1002/em.2850220309. [DOI] [PubMed] [Google Scholar]
- 3.Hernaez J, Xu M, Dashwood RH. Effects of tea and chlorophyllin on the mutagenicity of N-hydroxy-IQ: studies of enzyme inhibition, molecular complex formation, and degradation/scavenging of the active metabolites. Environ Mol Mutagen. 1997;30:468–474. doi: 10.1002/(sici)1098-2280(1997)30:4<468::aid-em12>3.0.co;2-b. [DOI] [PMC free article] [PubMed] [Google Scholar]
- 4.Arimoto S, Kanyama K, Rai H, Hayatsu H. Inhibitory effect of hemin, chlorophyllin and related pyrrole pigments on the mutagenicity of benzo [a]pyrene and its metabolites. Mutat Res. 1995;345:127–135. doi: 10.1016/0165-1218(95)90048-9. [DOI] [PubMed] [Google Scholar]
- 5.Reddy AP, Harttig U, Barth MC, Baird WM, Schimerlik M, Hendricks JD, Bailey GS. Inhibition of dibenzo[a,l]pyrene-induced multi-organ carcinogenesis by dietary chlorophyllin in rainbow trout. Carcino-genesis. 1999;20:1919–1926. doi: 10.1093/carcin/20.10.1919. [DOI] [PMC free article] [PubMed] [Google Scholar]
- 6.Breinholt V, Hendricks J, Pereira C, Arbogast D, Bailey G. Dietary chlorophyllin is a potent inhibitor of aflatoxin B1 hepatocarcinogenesis in rainbow trout. Cancer Res. 1995;55:57–62. [PubMed] [Google Scholar]
- 7.Dashwod RH, Negishi T, Hayatsu H, Breinholt V, Hendricks J, Bailey G. Chemopreventive properties of chlorophylls towards aflatoxin B1: a review of the antimutagenicity and anticarcinogenicity data in rainbow trout. Mutat Res. 1998;399:245–253. doi: 10.1016/s0027-5107(97)00259-5. [DOI] [PubMed] [Google Scholar]
- 8.Kensler TW, Groopman JD, Roebuck BD. Use of aflatoxin adducts as intermediate endpoints to assess the efficacy of chemopreventive interventions in animals and man. Mutat Res. 1998;402:165–172. doi: 10.1016/s0027-5107(97)00294-7. [DOI] [PubMed] [Google Scholar]
- 9.Hayashi T, Schimerlik M, Bailey G. Mechanisms of chlorophyllin anticarcinogenesis: dose-responsive inhibition of aflatoxin uptake and biodistribution following oral co-administration in rainbow trout. Toxicol Appl Pharmacol. 1999;158:132–140. doi: 10.1006/taap.1999.8695. [DOI] [PubMed] [Google Scholar]
- 10.Egner PA, Muñoz A, Kensler TW. Chemoprevention with chlorophyllin in individuals exposed to dietary aflatoxin. Mutat Res. 2003;523–524:209–216. doi: 10.1016/s0027-5107(02)00337-8. [DOI] [PubMed] [Google Scholar]
- 11.García-Rodríguez MC, López-Satniago V, Altamirano-Lozano M. Effect of chlorophyllin on chromium trioxide-induced micronuclei in polychromatic erythrocytes in mouse peripheral blood. Mutat Res. 2001;496:145–151. doi: 10.1016/s1383-5718(01)00225-x. [DOI] [PubMed] [Google Scholar]
- 12.Kumar SS, Chaubey RC, Devasagayam TP, Priyadarsini KI, Chauhan PS. Inhibition of radiation-induced DNA damage in plasmid pBR322 by chlorophyllin and possible mechanism(s) of action. Mutat Res. 1999;425:71–79. doi: 10.1016/s0027-5107(98)00250-4. [DOI] [PubMed] [Google Scholar]
- 13.Arimoto S, Fukuoka S, Itome C, Nakano H, Rai H, Hayatsu H. Binding of polycyclic planar mutagens to chlorophyllin resulting in inhibition of the mutagenic activity. Mutat Res. 1993;287:293–305. doi: 10.1016/0027-5107(93)90022-8. [DOI] [PubMed] [Google Scholar]
- 14.Arimoto-Kobayashi S, Harada N, Tokunaga R, Odo J, Hayatsu H. Adsorption of mutagens to chlorophyllin–chitosan, an insoluble form of chlorophyllin. Mutat Res. 1997;381:243–249. doi: 10.1016/s0027-5107(97)00188-7. [DOI] [PubMed] [Google Scholar]
- 15.Hayatsu H, Sugiyama C, Arimoto-Kobayashi S, Negishi T. Porphirins as possible preventers of heterocyclic amine carcinogenesis. Cancer Lett. 1999;143:185–187. doi: 10.1016/s0304-3835(99)00122-6. [DOI] [PubMed] [Google Scholar]
- 16.Hartman PE, Shankel D. Antimutagens and anticarcinogens: a survey of putative interceptor molecules. Environ Mol Mutagen. 1990;5:145–182. doi: 10.1002/em.2850150305. [DOI] [PubMed] [Google Scholar]
- 17.Pietrzak M, Wieczorek Z, Stachelska A, Darzynkiewicz Z. Interaction of chlorophyllin with acridine orange, quinacrine mustard and doxorubicin analyzed by light absorption and fluorescence spectroscopy. Biophys Chemist. 2003;104:305–313. doi: 10.1016/s0301-4622(02)00387-3. [DOI] [PMC free article] [PubMed] [Google Scholar]
- 18.Zhen QX, Zhang QL, Liu JG, Ye BH, Ji LN, Wang L. Synthesis, characterization and DNA binding of ruthenium (II) complexes containing the atatp ligand. J Inorg Biochem. 2000;78:293–298. doi: 10.1016/s0162-0134(00)00056-8. [DOI] [PubMed] [Google Scholar]
- 19.Amutha R, Subramanian V, Balachandran UN. Interaction of benzidine with DNA: experimental and modelling studies. Chem Phys Lett. 2001;344:40–48. [Google Scholar]
- 20.Holt C, Parker TG, Dalgleish DG. Measurement of particle sizes by elastic and quasi elastic light scattering. Biochim Biophys Acta. 1975;400:238–292. doi: 10.1016/0005-2795(75)90183-x. [DOI] [PubMed] [Google Scholar]
- 21.McGhee JD, von Hippel PH. Theoretical aspects of DNA–protein interactions: co-operative and non-co-operative binding of large ligands to a one-dimensional homogeneous lattice. J Mol Biol. 1974;86:469–489. doi: 10.1016/0022-2836(74)90031-x. [DOI] [PubMed] [Google Scholar]
- 22.Renault E, Fontaine-Aupart MP, Tfibel F, Gardes-Albert M, Bisagni E. Spectroscopic study of the interaction of pazelliptine with nucleic acids. J Photochem Photobiol. 1997;40:218–227. doi: 10.1016/s1011-1344(97)00059-6. [DOI] [PubMed] [Google Scholar]
- 23.Wu HL, Li WY, He XW, Miao K, Liang H. Spectral studies of the binding of lucigenin, a bisacridinium derivative with double-helix DNA. Anal Bioanal Chem. 2002;373:163–168. doi: 10.1007/s00216-002-1309-8. [DOI] [PubMed] [Google Scholar]
- 24.Chaires JB, Dattagupta N, Crothers DM. Studies on interaction of anthracycline antibiotics and deoxyribonucleic acid: equilibrium binding studies on interaction of daunomycin with deoxyribonucleic acid. Biochemistry. 1982;21:3933–3940. doi: 10.1021/bi00260a005. [DOI] [PubMed] [Google Scholar]
- 25.Kapuscinski J, Darzynkiewicz Z. Interactions of acridine orange with double stranded nucleic acids. Spectral and affinity studies. J Biomol Struct Dyn. 1987;5:127–143. doi: 10.1080/07391102.1987.10506381. [DOI] [PubMed] [Google Scholar]
- 26.Messori L, Temperini C, Piccioli F, Animati F, Di Bugno C, Orioli P. Solution chemistry and DNA binding properties of MEN 10755, a novel disaccharide analogue of doxorubicin. Bioorg Med Chem. 2001;9:1815–1825. doi: 10.1016/s0968-0896(01)00092-x. [DOI] [PubMed] [Google Scholar]
- 27.Angeloni L, Smulevich G, Marzocchi MP. Absorption, fluorescence and resonance Raman spectra of adriamycin and its complex with DNA. Spectrochim Acta. 1982;38A:213–217. [Google Scholar]
- 28.Selander RK. Interaction of quinacrine mustard with mononucleotides and polynucleotides. Biochem J. 1973;131:749–755. doi: 10.1042/bj1310749. [DOI] [PMC free article] [PubMed] [Google Scholar]
- 29.Jennings BR, Riedler PJ. Interaction of chromosomal stains with DNA an electrofluorescence study. Biophys Struct Mech. 1983;10:71–79. doi: 10.1007/BF00535543. [DOI] [PubMed] [Google Scholar]
- 30.Ferguson LR, Denny WA. The genetic toxicology of acridines. Mutat Res. 1991;258:123–160. doi: 10.1016/0165-1110(91)90006-h. [DOI] [PubMed] [Google Scholar]
- 31.Ardelt B, Kunicki J, Traganos F, Darzynkiewicz Z. Chlorophyllin protects cells from the cytostatic and cytotoxic effects of quinacrine mustard but not nitrogen mustard. Int J Oncol. 2001;18:849–853. doi: 10.3892/ijo.18.4.849. [DOI] [PubMed] [Google Scholar]
- 32.Kapuscinski J, Ardelt B, Piosik J, Zdunek M, Darzynkiewicz Z. The modulation of the DNA-damaging effect of polycyclic aromatic agents by xanthines: Part I. Reduction of cytostatic effects of quinacrine mustard by caffeine. Biochem Pharmacol. 2002;63:625–634. doi: 10.1016/s0006-2952(01)00904-2. [DOI] [PubMed] [Google Scholar]
- 33.Kapuscinski J, Darzynkiewicz Z. Increased accessibility of bases in DNA upon binding of acridine orange. Nucleic Acids Res. 1983;11:7555–7568. doi: 10.1093/nar/11.21.7555. [DOI] [PMC free article] [PubMed] [Google Scholar]
- 34.Lamm ME, Neville DM. The dimer spectrum of acridine orange hydrochloride. J Phys Chem. 1965;69:3872–3877. [Google Scholar]
- 35.Menozzi M, Valentini L, Vannini E, Arcamone F. Self-association of doxorubicin and related compounds in aqueous solution. J Pharm Sci. 1984;73:766–770. doi: 10.1002/jps.2600730615. [DOI] [PubMed] [Google Scholar]
- 36.Neault JF, Tajmir-Riahi HA. Structural analysis of DNA–chlorophyll complexes by Fourier transform infrared difference spectroscopy. Biophys J. 1999;76:2177–2182. doi: 10.1016/S0006-3495(99)77372-8. [DOI] [PMC free article] [PubMed] [Google Scholar]
- 37.Lyles MB, Cameron IL. Interactions of the DNA intercalator acridine orange, with itself, with caffeine, and with double stranded DNA. Biophys Chemist. 2002;96:53–76. doi: 10.1016/s0301-4622(02)00036-4. [DOI] [PubMed] [Google Scholar]
- 38.Davies DB, Veselkov DA, Djimant LN, Veselkov AN. Hetero-association of caffeine and aromatic drugs and their competitive binding with a DNA oligomer. Eur Biophys J. 2001;30:354–366. doi: 10.1007/s002490100150. [DOI] [PubMed] [Google Scholar]
- 39.Xie HP, Jiang JH, Chu X, Cui H, Wu HL, Shen GL, Yu RQ. Competitive interaction of the antitumor drug daunorubicin and the fluorescence probe ethidium bromide with DNA as studied by resolving trilinear fluorescence data: the use of PARAFAC and its modification. Anal Bioanal Chem. 2002;373:159–162. doi: 10.1007/s00216-002-1306-y. [DOI] [PubMed] [Google Scholar]


