Abstract
The success of magnetic nanoparticle (mNP)-based diagnostic and therapeutic techniques is dependent upon how the mNP are distributed in vivo. The potential efficacy and timing of a given magnetic nanoparticle treatment or diagnostic test is largely determined by the number of nanoparticles in each tissue and microscopic compartment: e.g., in the intravascular and extravascular spaces, in the interstitial space, cell surface and in cell cytoplasm. Techniques for monitoring these cell-level interactions generally require the harvesting and destruction of tissues or cells at each time point of interest. We present a method (magnetic spectroscopy of Brownian motion, MSB) for longitudinally monitoring nanoparticle binding to cell surface proteins and uptake by cancer cells in vitro using the harmonics of the magnetization produced by the nanoparticles. These harmonics can be measured rapidly and noninvasively without the need for nanoparticle modifications and without damaging the cells. We demonstrate sensitivity of this harmonic signal to the nanoparticles’ microenvironment and use this technique to monitor the nanoparticle binding activities of different cell lines.
Introduction
The cellular response to magnetic nanoparticles (mNP) serves as both a catalyst and a barrier to their use as diagnostic or therapeutic agents. The level of mNP aggregation following uptake into tumor cells improves the efficacy of magnetic mNP hyperthermia1, but uptake by phagocytic cells of the reticuloendothelial system (RES) limits a mNP’s circulation time2 and their ability to reach the targeted site. Significant efforts are focused on understanding the distribution of mNPs within the compartments forming the microenvironment and how they move across compartment boundaries3. A critical factor influencing the biodistribution and pharmacokinetics of mNPs is their physical design including size, shape, and surface functionalization4,5. Surface functionalization includes biocompatible coatings like PEG, which helps to slow removal by the RES, and active targeting molecules which bind specific receptors, such as ligands or antibodies2.
Imaging modalities play a critical role in realizing the potential diagnostic and therapeutic applications for magnetic mNPs3, and a variety of clinical and experimental technologies have been developed6,7. Elsaesser et al6 have recently reviewed the capabilities of a number of these techniques. Most studies of mNP cellular uptake rely on electron and light microscopy4-6,8-10. These techniques allow for subcellular resolution but require sample destruction, suffer from depth limitations, or rely on chemical modification of mNPs by conjugation of fluorophores to the mNPs. The distinct advantages of magnetic and fluorescent techniques have driven the development of multifunctional particles that incorporate fluorescent dyes or quantum dots in a composite nanostructure11,12. These composite nanostructures seek to offer numerous capabilities including imaging, therapy, targeting, and functional biosensing within a single deliverable13,14. Other techniques to quantify magnetization of individual cells in populations, such as magnetophoresis15-17, are also applicable to studies of mNP-cell interactions. Magnetic resonance imaging (MRI) can detect magnetic mNPs without the need for fluorescent tags, and although the limits of sensitivity are continually being advanced13,18, the sensitivity severely limits the functionality. The MRI response to mNPs is also highly nonlinear making quantification problematic. In 2005, magnetic particle imaging (MPI) was introduced to directly quantify magnetic mNP concentrations19 but it is not capable of isolating mNPs to microscopic compartments. MPI is being commercialized as a preclinical modality by Royal Philips Electronics and Bruker BioSpin and in vivo images have been published20.
Biosensing is important in evaluating the mNP status in tissues and cells. Magnetic spectroscopy of nanoparticle Brownian motion (MSB)21 is capable of sensing changes in the mNP microenvironment in vitro22-25. In the presence of a magnetic field, the mNP seek an equilibrium magnetization where magnetic energy, seeking to align the particles, is balanced with thermal energy, seeking to randomize the mNP’s alignment. As the direction of the applied field changes, an mNP’s magnetic moment can follow via Brownian or Neel relaxation. In Brownian relaxation an mNP’s magnetic core and surface coating physically rotate, while in Neel relaxation the moment of the magnetic core realigns without physical motion of the mNP. The magnetization and harmonic spectra of particles undergoing Brownian relaxation will be influenced by environmental conditions including temperature22, binding23, and viscosity24. Cellular binding and endocytosis will change the physical environment of the mNPs and hence the mNP’s harmonic spectra observed using MSB.
Methods
The endocytosis of bionized nanoferrite (BNF) mNPs by murine breast adenocarcinoma (MTG-B) cel l s has been studied previously1,8. We have seen extensive cell surface association of the mNPs and the formation of mNP aggregates within cellular endosomes. These changes in the physical environment produce a substantial shift in the harmonic spectra of the mNP’s magnetization, termed the MSB signal.
In this study, we examine the spectral shift caused by cell surface association and internalization and discuss how this technique could aid in studying the interactions between cells and mNPs. We used MTG-B mouse mammary carcinoma cells and hydroxyethyl starch-coated iron oxide mNPs to investigate the cell uptake process in time. MSB measurements were made sequentially in time as the cell uptake reduced the number of free mNPs and increased the number of cell-surface and intracellular bound mNPs. At each time point one sample was removed, non-bound mNPs were removed and the sample was prepared to determine its iron content using mass spectroscopy.
To investigate cell-specific mNP binding, an array of cell lines (MTG-B cells and human mammary adenocarcinoma cells MCF-7 and BT-474) were assessed by MSB every thirty minutes for five hours following addition of mNPs to the sample using MSB to determine the rate of binding and compare with literature values.
Cell cultures
MTG-B, BT-474 and MCF-7 cells were incubated at 37°C in Alpha Minimum Essential Medium (α-MEM, for MTG-B), DMEM/High Glucose (for MCF-7) or DMEM/F-12 50/50 (for BT-474), each with 10% fetal bovine serum, 1% pen-strep, and 1 % L-glutamine. The cells were dissociated with EDTA (Invitrogen 13151-014) and diluted in 1.5 mL Eppendorf tubes at a concentration of 5 million cells per mL (final volume 1 mL) using their respective cell culture media. To determine the mNP-cell binding rates of different cell lines, three different cancer cell lines were used: MTG-B murine breast tumor cells, and HER2-positive BT-474 and HER2-negative MCF-7 human breast cancer cell lines. The cell lines used to compare uptakes were prepared as described but suspended at a concentration of 1 million cells per mL (final volume 1 mL). To prepare transmission electron microscopy samples, cells were suspended at this concentration with mNP at 0.2 mg Fe/mL for five hours.
Nanoparticles
Hydroxyethyl starch (HES)-coated iron oxide (BNF mNPs) (MicroMod GmbH, Germany) were used in this study. Grüttner et al26 describe the design and synthesis of the dextran coated BNF nanoparticles, and Bordelon et al27 analyze the properties of the starch coated mNPs. These mNPs have an approximately 50 nm core comprised of multiple magnetite crystals (12-20 nm diameter). The iron concentration as purchased is 27 mg/ml. The surface of the nanoparticles has a zeta potential of −18 mV at pH 728. The particles are hydrophilic and stable in aqueous buffers (pH > 4). A Malvern ZetaSizer Nano ZS was used to determine the hydrodynamic size of the mNPs; a mean diameter of 116 nm was found.
Magnetic spectroscopy of nanoparticle Brownian motion (MSB)
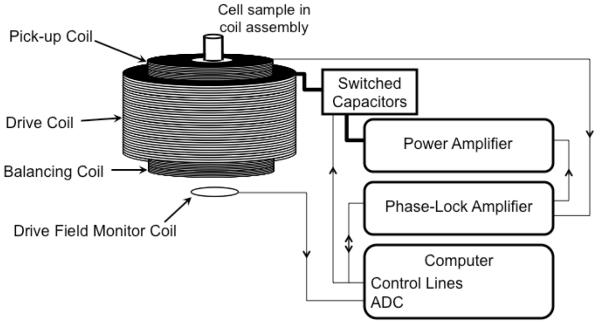
The MSB spectrometer used to measure the magnetization was a modified version of one described previously22,29,30, and is diagrammed in Figure 1. Briefly, the drive field is controlled by the computer’s link to the phase-lock amplifier. The phase-lock amplifier, an SR830 (Stanford Research Systems, Sunnyvale, CA), generates a pure sinusoidal voltage, which is fed into the resonant drive circuit. The computer controls the amplitude and frequency of the voltage produced by the phase-lock amplifier. An audio power amplifier (QSC PL 236) drives a current through the resonant drive coil. The resonant frequency of the coil is determined by the capacitor switched into series with the drive coil by the computer-controlled switch. The magnetic field induces a voltage in the drive field monitoring coil that is read by an ADC so the computer can adjust the voltage generated by the phase-lock amplifier to obtain the desired drive field amplitude; it is maintained at 10 mT/μ0 for all frequencies (290, 510, 1050, 1270, 1740 and 2110 Hz). The pickup coil is connected in series with a balancing coil. The balancing coil has opposite polarity of the pickup coil and is placed far from the NP sample so it only records the drive field. The balancing coil cancels the current generated by the drive field in the pickup coil leaving only that produced by the nanoparticle sample. It acts very much like a bridge that is unbalanced by the nanoparticles. The phase-lock amplifier is used to measure the harmonics (3rd and 5th) generated by each of the nine NP samples. The detectability limit of the setup has been determined to be approximately 20 μg Fe.
Figure 1. Diagram of the apparatus used to measure the MSB signal from samples of magnetic nanoparticles.
The computer controls the system components and the sequence of measurements acquired. The computer directs the phase-lock amplifier to generate a sinusoidal voltage of a given frequency and amplitude which is output to the power amplifier. The power amplifier drives the current into the resonant drive coil. The resonant frequency of the drive coil is controlled by the capacitor that the computer switches into series with the coil. The amplitude of the drive field is measured by the ADC card, which samples the current generated in a field measurement coil. The computer adjusts the output voltage of the phase-lock amplifier to obtain the correct drive field. The pickup coil and balancing coil are fixed inside the drive field coil. The pickup and balancing coils are in series and the output is measured by the phase-lock amplifier, which outputs the measured voltage at each harmonic to the computer.
Iron quantification verification with inductively coupled plasma mass spectrometry (ICP-MS)
The iron content of the cell culture media and cells was measured with inductively coupled plasma mass spectrometry (ICP-MS, Agilent 7500cx). ICP-MS is capable of detecting iron concentrations in biological samples at parts-per-billion sensitivity31. Six MTG-B cell samples (1 mL each of 5×10⁶ cells/ml) had BNF mNPs added to a final concentration of 0.35 mg Fe/mL in typical MTG-B media in 1.5 mL Eppendorf tubes. A higher concentration of mNP and cells was used in this experiment than in the comparative cell study (0.2 mg Fe/ml) to allow for a higher iron content in the cell pellet as binding occurred. Control cell samples were prepared in the same fashion using PBS in lieu of mNP. Three additional media controls were prepared with mNPs added to 1 mL of MTG-B media to a final concentration of 0.35 mg Fe/mL to assess any non cell-specific binding effects. All of the samples were incubated in a heating block to maintain a temperature of 37°C.
In a previous study we did not find similar concentrations of nanoparticles to be more cytotoxic in vitro than PBS control.32 Dennis, et al injected similar nanoparticles into tumors at a concentration of 5 mg/cm3 without greater cytotoxicity than controls.1 We have also systemically administered these nanoparticles in mice at a concentration of 0.2 mg Fe/g body mass without noting acute toxicity.28
The sensitivity of the mNP harmonic spectra to cellular activity was monitored over time by preparing six samples of the MTG-B cells and three control samples consisting of MTG-B medium without cells. The MSB signal of each of the nine samples was recorded at 290, 510, 1050, 1270, 1740 and 2110 Hz and 10 mT/μo directly after mNP addition to the samples. These measurements were repeated every hour for a total of five hours. After each measurement, one of the cell and mNP samples was centrifuged at 2000 g for 30 seconds and the media removed and retained. The cell pellet was then resuspended in 1 mL of fresh MTG-B media and centrifuged again. The cells were centrifuged a total of four times and a total of approximately 4 mL of media was retained. This centrifugation process was repeated for the cell samples with PBS added instead of mNP at one, three and five hours after initial measurements were taken.
Each sample (cell pellets and media washes) was weighed and digested in trace elements grade hydrochloric acid. The samples were then processed for iron content by the ICP-MS at the Trace Metal Analysis Core Facility in the Chemistry Department at Dartmouth College.
Results
Harmonic response over time
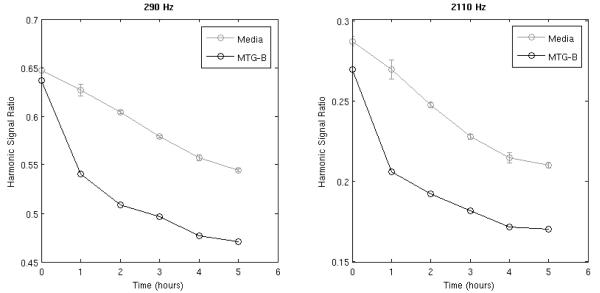
The sensitivity of the mNP harmonic spectra to cellular activity was monitored over time by preparing six samples of the MTG-B cells and three control samples consisting of MTG-B medium without cells. To each of these samples, we added 500 μg Fe/mL of BNF mNPs and immediately recorded the harmonic spectrum at 290, 510, 1050, 1270, 1740 and 2110 Hz and 10 mT/μ0. Between measurements all samples were kept at 37°C in a heat block. We recorded the harmonics at several time points over a five-hour period (see Figure 2). A single measurement of the 3rd and 5th harmonics took less than five seconds and had repeatability of less than 0.5%. All of the cell-incubated samples showed a rapid separation from the control response (Figure 2). The ratio of the harmonics is independent of particle concentration, and thus will not be affected by any inconsistency in mNP concentration across samples22,24. Eberbeck et al33 have recently studied the aggregation of mNPs in cell culture media. They conclude aggregation is the likely cause of the change in the spectral response with time. In stock solution, the BNF mNPs produce a magnetic response stable within 1-2% and show no signs of visible aggregation after several days, but the control sample in cell culture media had visible aggregates within 24 hours.
Figure 2. Time Course of the Spectral Response of BNF Nanoparticles Incubated with MTG-B Cells.
Measurements were pre-formatted at 290 Hz or 2110Hz and 10 mT/μo. The error bars demonstrate standard deviations of the harmonic amplitudes for the three media samples. The ratio of the third to the fifth harmonic for media and the cell samples at the time of centrifugation is shown at 290 Hz (left) and 2110 Hz (right).
TEM confirmation and microenvironments
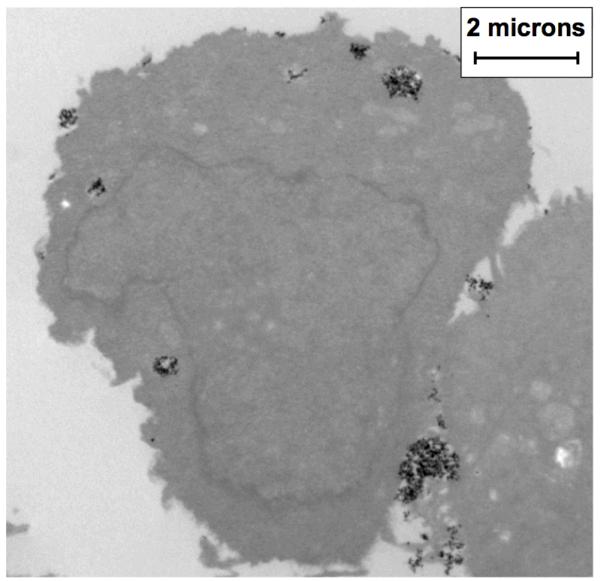
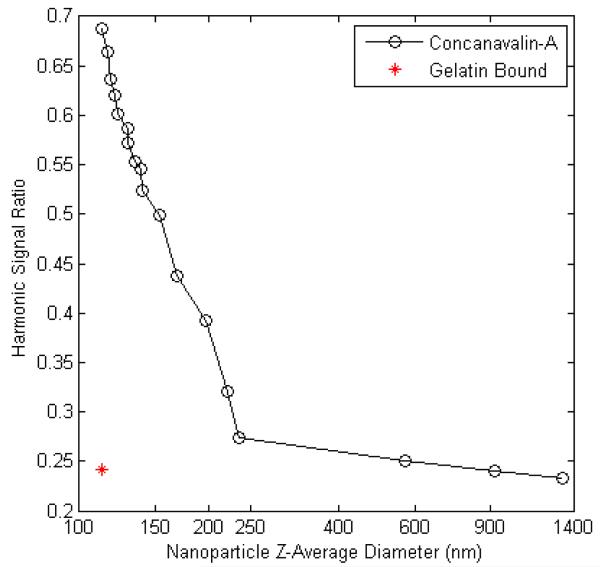
Following a five-hour assessment period, TEM images of the MTG-mNP samples were acquired. These images demonstrated aggregates of the mNPs within cellular endosomes and adhered to the surface of the cells (see Figure 3). The aggregation or cell membrane association alters the ability of the mNPs to undergo Brownian relaxation and, as a result, alters the spectral response. Previously, we used the lectin Concanavalin-A (Sigma-Aldrich L7647) to chemically aggregate similar dextran-coated mNPs24. To study the impact of aggregate size on spectral response treated BNF mNP samples with different concentrations o f Concanavalin-A (ConA) were produced. Using dynamic light scatter size measurements, we assessed the mean aggregate size of the mNP and looked for correlation between aggregate size and spectral response. This measurement, performed with a Malvern Zetasizer Nano ZS (Figure 4), demonstrates the impact of increasing aggregation on the ratio of the 5th and 3rd harmonic amplitudes. A stock solution sample of BNF mNPs has a mean hydrodynamic size of 116 nm and a harmonic ratio of 0.688 at 420 Hz and 22.9 mT/μ0. The harmonic ratio rapidly dropped by 0.414 as the mean hydrodynamic size increased to 235 nm. A continued increase in the hydrodynamic size to 1321 nm only produced a 0.040 change in the ratio. This smaller change in harmonic response with larger aggregates suggests that the Brownian motion at that frequency is correspondingly smaller. We also prepared a sample of the BNF mNPs in porcine gelatin (Sigma-Aldrich G2500) and recorded the harmonic response once the gelatin had solidified. The harmonic ratio from this gelatin bound sample of mNPs is shown in Figure 4 to be comparable to the response from the highly aggregated mNPs. The amplitude as well as the phase angles at both the 3rd and 5th harmonics are similar for those two mNP conditions at that frequency. It is therefore difficult to differentiate aggregation from reduced mobility at that frequency.
Figure 3. TEM Image of BNF Nanoparticles (Black Pixels) Incubated with MTG-B Cells for Five Hours.
Aggregates of mNPs are observed both within and outside of cells. Intracellular mNPs are typically found within vesicles. Extracellular mNPs are attached, in aggregates, to the cell plasma membrane.
Figure 4. This figure demonstrates a change in the 5th/3rdHarmonic Ratio with Increasing Hydrodynamic Aggregate Size at 420 Hz and 22.9 mT/μo.
The response from a gelatin bound sample of mNPs (red star) compares closely with the response of the highly aggregated mNPs (average hydrodynamic diameter of greater than 250 nm). Hydrodynamic diameter measurements were obtained with dynamic light scattering and mNPs were aggregated using the lectin Concanavlin-A.
Inductively coupled plasma mass spectrometry (ICP-MS) analysis of cell-bound iron
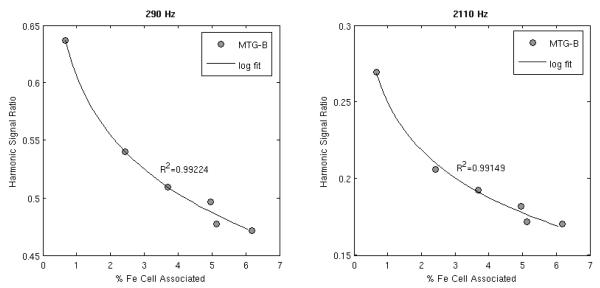
Analysis of the cell samples by the ICP-MS facility at Dartmouth College demonstrated a relationship between cell internalized and cell-surface bound iron with MSB signal. Cells incubated with mNPs at 0.35 mg Fe/ml shower a linear increase in Fe amount with incubation time. Fe levels increased linearly 200-2000 fold with increasing incubation time, as compared with the no-MNP PBS-cell controls. A logarithmic correlation between MSB signal and cell iron association was observed (see Figure 5).
Figure 5. Increased cell-bound iron levels correlate with a decreased MSB signal.
The ratio of the fifth to the third harmonic signal of cell samples at the time of centrifugation is shown at 290 Hz (left) and 2110 Hz and 10 mT/μo along with a logarithmic fit to the data.
Comparison of nanoparticle association with three breast tumor cell lines
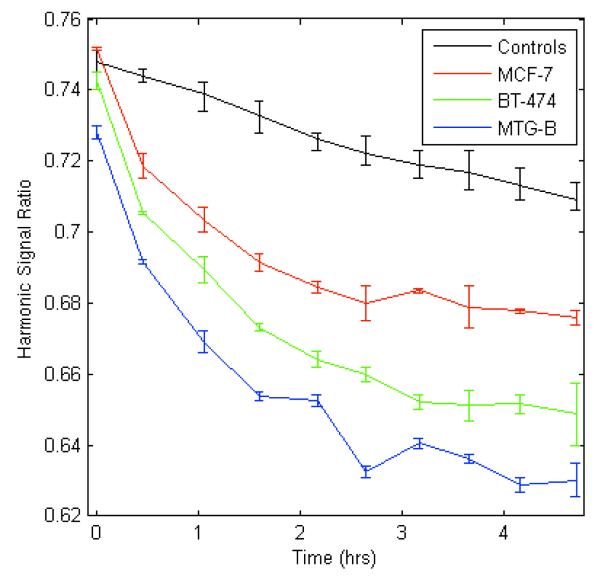
Two human breast tumor cell lines (MCF-7 and BT-474) and one mouse mammary adenocarcinoma cell line (MTG-B) were suspended in their respective media types in triplicate at a concentration of 106 cells/ml. Media controls were assessed in duplicate for each media type. MNPs (0.2 mg Fe/ml) were added to each of the 1 ml samples. MSB signals were obtained at 290 Hz and 10 mT/μ0 every 30 minutes for five hours. All samples were kept in a heat block at 37°C for the duration of the experiment. The greatest signal change was demonstrated in the MTG-B cells, followed by the BT-474 cells and, finally, the MCF-7 cells (Figure 6).
Figure 6. The change in mNP harmonic ratio over time when incubated with three different cell lines. Measurements were acquired at 290 Hz and 10 mT/μo.
Control error bars indicate the range of responses for mNPs in the three different cell culture media. The greatest signal change was demonstrated in the MTG-B cells due to more mNP-cell association.
Discussion
The spectral responses of mNPs that have been incubated with cancer cells have marked similarities to bound or aggregated mNPs. For medical applications such as mNP hyperthermia, an ability to remotely monitor and quantify binding and aggregation of mNPs within cells would be highly beneficial1. Recently, it has been shown that the unique spectral response generated by mNPs in different environments can allow for concurrent quantification of the proportion of mNPs within each environment25. That ability is a primary goal for the MSB technique. A wide variety of experimental in vitro and in vivo conditions challenge the ability to accurately quantify physical parameters of these conditions and how they might affect MSB signals. As evidenced in Figure 3, mNPs are present in a variety of aggregate sizes and associated in various fashions with the cell surface. Binding and aggregation have similar impacts on the harmonic spectra of the mNPs used in this study but for different particle designs or different excitation parameters this might not be true. The mechanism for aggregation’s influence on the harmonics must be fully understood. While suppression of Brownian motion is one likely cause, dipole interactions between mNPs may also contribute to the signal change. Future studies will examine differences in MSB signal change due to mNP binding to the cell surface as compared with MSB signal change due to mNP internalization by cells.
The extent to which the MSB technique can be performed quantitatively at tissue depth will determine its value in vivo. These measurements can already differentiate mNP binding and endocytosis with various cell lines without many of the limitations imposed by current techniques. Though harmonic-based measurements can’t provide the subcellular resolution provided by microscopy, they can provide a quantitative measure of the number of mNPs within various microscopic compartments25. This technique can also allow for both constant monitoring of the mNPs without the need for sample destruction at time points of interest and a significant reduction in limitations on depth of measurement. Different cell environments or the impact of different uptake inhibitors or stimulants could be monitored continually by comparing the relative changes in the harmonic responses. Figure 6 demonstrates such an ability by comparing the harmonic response of mNPs over time when incubated with MCF-7, BT-474, and MTG-B cell lines. The MTG-B and BT-474 have comparable rates of change in harmonic ratio though with an offset, while the MCF-7 cells cause a slower change in the mNP harmonic ratio. Steinhauser et al34 compared the uptake of 210 nm PEGylated NPs by BT-474 and MCF-7 cell lines using flow cytometry and found the BT-474 line to have taken up more NPs over the first 5 hours of incubation. Steinhauser et al34 used a different NP type and different sample preparations, but their results do show a similar relation between the uptake rates of BT-474 and MCF-7 cell lines. As a preliminary screen for NP and cell interaction, the results of Figure 6 would offer a substantial savings in time and materials over a TEM- or ICP-MS-based study. This technique does not provide the visual confirmation of TEM, but if quantitative capabilities can be realized in the in vitro realm it would be a powerful tool for advancing our knowledge of the biological fate of mNPs.
Conclusion
The success of mNP-based diagnostic and therapeutic techniques depends on a thorough understanding and control of the mNPs’ fate in vivo. An array of techniques has been developed for tracking cellular uptake of mNPs, however their use in the in vivo realm has been limited. The harmonic spectra of mNPs can be made sensitive to cellular uptake or surface binding, allowing for remote monitoring of such activity. This monitoring can be done continuously without the need for sample destruction and without severe limitations on sample size or preparation. Further development of this technique should allow for quantitative measurement of the relative concentrations of mNP bound to the cell surface or endocytosed by the cells. Future work will also test the efficacy and applications of in vivo MSB.
Insight statement.
We introduce a technique for rapidly and non-destructively monitoring the binding and uptake of magnetic nanoparticles by cancer cells. We utilize environmental influences on the harmonics of the particles’ magnetization and harmonic spectra to remotely detect nanoparticle fate in vitro using magnetic spectroscopy of Brownian motion (MSB). As the nanoparticles bind to cells, their MSB spectra change, allowing comparisons of the rates of nanoparticle binding to different cell types. This technique can provide substantial savings in both time and materials compared to current alternatives. New methods of monitoring the interactions of magnetic nanomaterials with cells are especially relevant to work using novel nanostructures created for the imagining or treatment of disease.
Acknowledgments
Funding Sources
Support for this work was provided by the Dartmouth Center of Cancer Nanotechnology Excellence (National Institutes of Health National Cancer Institute grant 1U54CA151662-01), the Innovation Program at Thayer School of Engineering, and the Norris Cotton Cancer Center at Dartmouth-Hitchcock Medical Center.
references
- 1.Dennis CL, et al. Nearly complete regression of tumors via collective behavior of magnetic nanoparticles in hyperthermia. Nanotechnology. 2009;20:395103. doi: 10.1088/0957-4484/20/39/395103. [DOI] [PMC free article] [PubMed] [Google Scholar]
- 2.Petros RA, DeSimone JM. Strategies in the design of nanoparticles for therapeutic applications. Nat Rev Drug Discov. 2010;9:615–627. doi: 10.1038/nrd2591. [DOI] [PubMed] [Google Scholar]
- 3.Sanhai WR, Sakamoto JH, Canady R, Ferrari M. Seven challenges for nanomedicine. Nature Nanotech. 2008;3:242–244. doi: 10.1038/nnano.2008.114. [DOI] [PubMed] [Google Scholar]
- 4.Jiang W, Kim BYS, Rutka JT, Chan WCW. Nanoparticle-mediated cellular response is size-dependent. Nature Nanotech. 2008;3:145–150. doi: 10.1038/nnano.2008.30. [DOI] [PubMed] [Google Scholar]
- 5.Verma A, Stellacci F. Effect of surface properties on nanoparticle-cell interactions. Small. 2010;6:12–21. doi: 10.1002/smll.200901158. [DOI] [PubMed] [Google Scholar]
- 6.Elsaesser A, et al. Quantification of nanoparticle uptake by cells using microscopical and analytical techniques. Nanomedicine (Lond) 2010;5:1447–1457. doi: 10.2217/nnm.10.118. [DOI] [PubMed] [Google Scholar]
- 7.Jing Y, et al. Quantitative intracellular magnetic nanoparticle uptake measured by live cell magnetophoresis. The FASEB Journal. 2008;22:4239–4247. doi: 10.1096/fj.07-105544. [DOI] [PMC free article] [PubMed] [Google Scholar]
- 8.Giustini AJ, Ivkov R, Hoopes PJ. Magnetic nanoparticle biodistribution following intratumoral administration. Nanotechnology. 2011;22:345101. doi: 10.1088/0957-4484/22/34/345101. [DOI] [PMC free article] [PubMed] [Google Scholar]
- 9.Chithrani BD, Ghazani AA, Chan WCW. Determining the size and shape dependence of gold nanoparticle uptake into mammalian cells. Nano Lett. 2006;6:662–668. doi: 10.1021/nl052396o. [DOI] [PubMed] [Google Scholar]
- 10.Wan J, Meng X, Chen K. Incorporation of magnetite nanoparticle clusters in fluorescent silica nanoparticles for high-performance brain tumor delineation. Nanotechnology. 2010;21:235104–235104. doi: 10.1088/0957-4484/21/23/235104. [DOI] [PubMed] [Google Scholar]
- 11.Insin N, et al. Incorporation of iron oxide nanoparticles and quantum dots into silica microspheres. ACS Nano. 2008;2:197–202. doi: 10.1021/nn700344x. [DOI] [PubMed] [Google Scholar]
- 12.Selvan ST, Tan TTY, Jana NR. Functional and multifunctional nanoparticles for bioimaging and biosensing. Langmuir. 2010;26:11631–11641. doi: 10.1021/la903512m. [DOI] [PubMed] [Google Scholar]
- 13.Nasongkla N, et al. Multifunctional Polymeric Micelles as Cancer-Targeted, MRI-Ultrasensitive Drug Delivery Systems. Nano Lett. 2006;6:2427–2430. doi: 10.1021/nl061412u. [DOI] [PubMed] [Google Scholar]
- 14.Santra S, Kaittanis C, Grimm J, Perez JM. Drug/Dye-Loaded, Multifunctional Iron Oxide Nanoparticles for Combined Targeted Cancer Therapy and Dual Optical/Magnetic Resonance Imaging. Small. 2009;5:1862–1868. doi: 10.1002/smll.200900389. [DOI] [PMC free article] [PubMed] [Google Scholar]
- 15.Zborowski M, et al. Red blood cell magnetophoresis. Biophys J. 2003;84:2638–2645. doi: 10.1016/S0006-3495(03)75069-3. [DOI] [PMC free article] [PubMed] [Google Scholar]
- 16.Winoto-Morbach S, Tchikov V, Müller-Ruchholtz W. Magnetophoresis: I. Detection of magnetically labeled cells. J. Clin. Lab. Anal. 1994;8:400–406. doi: 10.1002/jcla.1860080610. [DOI] [PubMed] [Google Scholar]
- 17.Winoto-Morbach S, Tchikov V, Müller-Ruchholtz W. Magnetophoresis: II. Quantification of iron and hemoglobin content at the single erythrocyte level. J. Clin. Lab. Anal. 1995;9:42–46. doi: 10.1002/jcla.1860090108. [DOI] [PubMed] [Google Scholar]
- 18.Bouchard L-S, Anwar MS, Chen FF. Picomolar sensitivity MRI and photoacoustic imaging of cobalt nanoparticles. Proc Natl Acad Sci USA. 2009;106:4085–4089. doi: 10.1073/pnas.0813019106. [DOI] [PMC free article] [PubMed] [Google Scholar]
- 19.Gleich B, Weizenecker J. Tomographic imaging using the nonlinear response of magnetic particles. Nature. 2005;435:1214–1217. doi: 10.1038/nature03808. [DOI] [PubMed] [Google Scholar]
- 20.Weizenecker J, Gleich B, Borgert J. Three-dimensional real-time in vivo magnetic particle imaging. Phys Med Biol. 2009;54:L1–L10. doi: 10.1088/0031-9155/54/5/L01. [DOI] [PubMed] [Google Scholar]
- 21.Weaver JB, Rauwerdink AM, Sullivan CR, Baker I. Frequency distribution of the nanoparticle magnetization in the presence of a static as well as a harmonic magnetic field. Med Phys. 2008;35:1988–1994. doi: 10.1118/1.2903449. [DOI] [PMC free article] [PubMed] [Google Scholar]
- 22.Weaver JB, Rauwerdink AM, Hansen EW. Magnetic nanoparticle temperature estimation. Med Phys. 2009;36:1822–1829. doi: 10.1118/1.3106342. [DOI] [PMC free article] [PubMed] [Google Scholar]
- 23.Rauwerdink AM, Weaver JB. Measurement of molecular binding using the Brownian motion of magnetic nanoparticle probes. Appl. Phys. Lett. 2010;96:033702–033702-3. [Google Scholar]
- 24.Rauwerdink AM, Weaver JB. Harmonic phase angle as a concentration-independent measure of nanoparticle dynamics. Med Phys. 2010;37:2587–2592. doi: 10.1118/1.3426294. [DOI] [PMC free article] [PubMed] [Google Scholar]
- 25.Rauwerdink AM, Weaver JB. Concurrent quantification of multiple nanoparticle bound states. Med Phys. 2011;38:1136. doi: 10.1118/1.3549762. [DOI] [PMC free article] [PubMed] [Google Scholar]
- 26.Grüttner C, et al. Synthesis and antibody conjugation of magnetic nanoparticles with improved specific power absorption rates for alternating magnetic field cancer therapy. J Magn Magn Mater. 2007;311:181–186. [Google Scholar]
- 27.Bordelon DE, et al. Magnetic nanoparticle heating efficiency reveals magneto-structural differences when characterized with wide ranging and high amplitude alternating magnetic fields. J. Appl. Phys. 2011;109:124904. [Google Scholar]
- 28.Giustini AJ, Petryk AA, Hoopes PJ. Ionizing radiation increases systemic nanoparticle tumor accumulation. Nanomedicine. 2012;8:818–821. doi: 10.1016/j.nano.2012.05.001. [DOI] [PMC free article] [PubMed] [Google Scholar]
- 29.Weaver JB, Kuehlert E. Measurement of magnetic nanoparticle relaxation time. Med Phys. 2012;39:2765. doi: 10.1118/1.3701775. [DOI] [PMC free article] [PubMed] [Google Scholar]
- 30.Rauwerdink AM, Giustini AJ, Weaver JB. Simultaneous quantification of multiple magnetic nanoparticles. Nanotechnology. 2010;21:455101. doi: 10.1088/0957-4484/21/45/455101. [DOI] [PMC free article] [PubMed] [Google Scholar]
- 31.Jain TK, Reddy MK, Morales MA, Leslie-Pelecky DL, Labhasetwar V. Contrast agents for MRI based on iron oxide nanoparticles prepared by laser pyrolysis. Mol Pharm. 2008;5:316–327. doi: 10.1021/mp7001285. [DOI] [PubMed] [Google Scholar]
- 32.Giustini AJ, Gottesman RE, Petryk AA, Rauwerdink AM, Hoopes PJ. Kinetics and pathogenesis of intracellular magnetic nanoparticle cytotoxicity. Proc. SPIE: Energy-based Treatment of Tissue and Assessment. 2011:790118–790118-7. doi: 10.1117/12.876519. [DOI] [PMC free article] [PubMed] [Google Scholar]
- 33.Eberbeck D, et al. Quantification of the aggregation of magnetic nanoparticles with different polymeric coatings in cell culture medium. J. Phys. D: Appl. Phys. 2010;43:405002. [Google Scholar]
- 34.Steinhauser I, Spänkuch B, Langer K. Trastuzumab-modified nanoparticles: optimisation of preparation and uptake in cancer cells. Biomaterials. 2006;27:4975–4983. doi: 10.1016/j.biomaterials.2006.05.016. [DOI] [PubMed] [Google Scholar]


