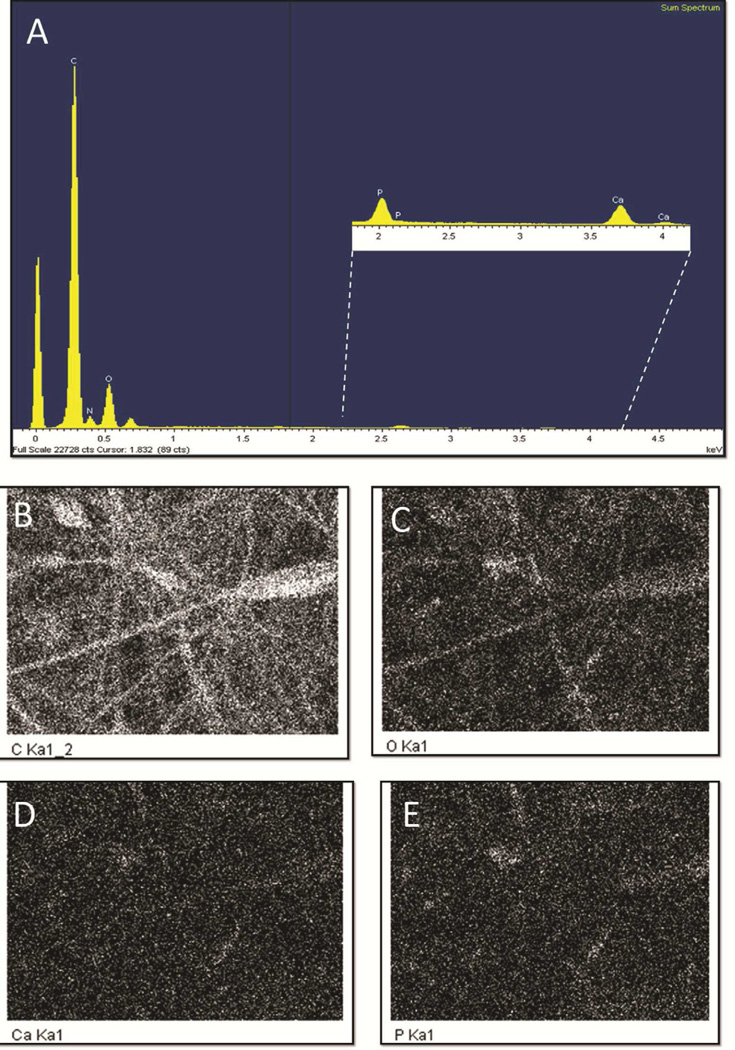
Figure 5. Electron dispersion spectroscopy of CTS-GP and CTS-HA-GP bio-composite nanofibers.
Spectral analyses comparing the elemental compositions of 0.1% genipin crosslinked chitosan nanofibers (A). Insert: 1.0% HA-containing 0.1% genipin crosslinked 7% chitosan nanofibers show new peaks for calcium and phosphorous due to the presence of hydroxyapatite nanoparticles. Dot-analyses representing the elemental topographical distribution of carbon (B), oxygen (C), calcium (D) and phosphorous (E) of the HA-containing nanofibers.

